

TL;DR
Generative AI ROI is proven when verified savings beat full cost against a baseline, so scale what clears it and stop what does not. Published benchmarks disagree, from BCG’s measured 13.8% average return to a widely reported MIT NANDA finding that 95% see no return. Those studies measure different things, so set your own target from your own baseline. Calculate ROI as realized benefit minus total cost, divided by total cost, and count build, run and hidden costs such as human review. In an illustrative contract-review case, realizing 60% of freed hours returns 85% in year one with a 6.5-month payback, while realizing 30% loses money. Prove the result with a baseline, a control group and scale, fix or stop thresholds agreed with finance before the pilot starts.
Key Takeaways
- Generative AI ROI is the verified net financial return of a use case, measured against the full cost of building, running and governing it.
- Benchmarks range from BCG’s 13.8% measured average to 92% of Snowflake’s early adopters reporting a positive return, because each study measures something different.
- The denominator must include build, run and hidden costs, especially human review of outputs, the line most often left out.
- Freed time is not cash until it is redeployed or a budget falls, so the realization rate decides most business cases.
- In the illustrative contract-review example, year-one ROI swings from 85% at 60% realization to -7.4% at 30%, while the model stays the same.
- Prove the number with a baseline, a control group and scale, fix or stop thresholds agreed with finance before the pilot starts.
The Contract-Review Pilot the CFO Would Not Sign Off
Picture a legal operations team presenting a pilot it is proud of. A large language model drafts first-pass reviews of supplier agreements, and the lawyers say each review now takes about half as long as before.
Then the CFO asks three questions. What does one reviewed agreement cost now, including the model, the platform and the lawyer who checks the draft? How many agreements go through the tool each month? And did any of the saved hours turn into money, such as lower outside counsel spend or roles left unfilled?
Nobody in the room has the answers, because nobody measured the old process before the pilot began.
The pilot may well deserve funding. Without those numbers, though, it cannot be defended in a budget review, and it will lose to a project that can show its math.
The sections below answer the CFO’s three questions in order. They show what one output really costs, how volume turns time into money and when saved hours become cash. Then they close with the staged test that finance will accept.
What Generative AI ROI Means (and What It Does Not)
Generative AI ROI is the verified net financial return from a generative AI use case, compared with everything it cost to build and run. Above all, the word that matters is verified. The gain has to show up in a budget, a revenue line or a cost that would otherwise have been paid.
That sounds obvious, but many business cases still stop one or two steps short. They report how many people use the tool, or how many minutes it saves per task, and then call that ROI. Those numbers matter because they feed the calculation, but on their own they prove very little.
The distinction also shapes how you plan an enterprise generative AI deployment. For example, a rollout judged on usage tends to buy more seats. A rollout judged on return instead picks fewer workflows, each with an owner who answers for the result.
Adoption, Productivity, Value and ROI Are Four Different Measures
Think of these four measures as a ladder rather than a list. Each rung depends on the one below it, but each proves something different. So a business case should say which rung it has actually reached.
| Measure | Question it answers | Example evidence | Proves ROI? |
|---|---|---|---|
| Adoption | Are people using it? | Weekly active users, share of eligible work routed through AI | No |
| Productivity | Is the task faster? | Minutes saved per agreement or ticket | No |
| Value | Did a business outcome improve? | Lower cost per ticket, shorter cycle time | Partly |
| ROI | Did the net return beat the full cost? | ROI percentage, payback in months | Yes |
In practice, many stalled business cases sit on the second rung. The tool is used, and the work is faster than before. But nobody has traced the gain to a financial line, so finance reads it as a claim.
Case Study
90% Faster Vendor Selection with LLM Agreement Processing
A real estate developer turned unstructured vendor agreements into searchable data with LLM extraction and a chat interface, cutting manual processing time by 82%.
Read the Case Study →Hard Returns, Cost Avoidance and Soft Value
Returns come in three kinds, and finance treats each one differently because each reaches the books in a different way. A hard return changes a number in the ledger during the period. Cost avoidance prevents spending that would otherwise have happened, while soft value improves quality or speed in ways that are real but hard to price.
| Category | What it looks like | Example measure |
|---|---|---|
| Hard return | Lower spend or higher revenue booked in the period | Cost per ticket, outside counsel spend, conversion revenue |
| Cost avoidance | Spending that no longer has to happen as volume grows | Hires avoided, overtime not paid, contractors not renewed |
| Soft value | Better quality, speed or experience | First-pass accuracy, time to launch, employee satisfaction |
Released capacity deserves special care. For instance, suppose an analyst saves five hours a week and fills them with other work of similar value. The company gained capacity, but it did not gain cash.
That capacity becomes cash only when it is redeployed to work you would otherwise pay for, or when the budget for the role falls. A credible business case states which of the two it expects, and by when. It also says what share of freed time it assumes will be captured, since that share drives the result more than any other input.
Generative AI ROI Benchmarks for 2026: What the Research Shows
Published benchmarks and broader generative AI statistics help you sanity-check a business case, as long as you know what each one measured. The best-known studies seem to contradict each other, and the reasons behind the gap are more useful than any single headline number.
The Headline Numbers Side by Side
This table lists only studies whose methods are public, together with the sample behind each figure. Read the last column first, because it explains most of the disagreement.
| Source | Finding | Sample | What it measures |
|---|---|---|---|
| BCG (published September 17, 2026) | Weighted-average ROI of 13.8% on GenAI and AI agent deployments, up 2.6 points from 11.2% in mid-2025 | 423 respondents (285 North America, 138 Europe), surveyed May 2026 | Measured return on deployed systems |
| BCG (same study) | About 19% for high-maturity companies, against 8-9% for low or no maturity | Same sample | How AI maturity shifts the return |
| Snowflake and Omdia, The ROI of Gen AI and Agents 2026 | 92% of early adopters report a positive return; those who quantified it report $1.49 back per $1 invested | 2,050 professionals worldwide | Self-reported return among early adopters |
| Deloitte | Most reach satisfactory ROI on a typical use case in 2-4 years; only 6% see payback within a year | 1,854 executives in Europe and the Middle East, 2025, plus 24 interviews | Time to payback |
| MIT NANDA, The GenAI Divide (2025) | 95% of organizations see no business return, despite $30-40 billion of enterprise GenAI spend | 153 survey responses, 52 interviews, 300+ public initiatives | Measurable profit and loss impact |
| GitHub Copilot experiment (2022) | Developers with Copilot finished a coding task 55% faster | 95 developers | Task speed, not enterprise ROI |
Reading the Spread Between Studies
Each row measures something different, which explains the spread. BCG’s IT budget research, for example, reports a measured return on live deployments, at 13.8% on average. Snowflake’s study with Omdia instead asks early adopters whether they see a positive return, and 92% say yes.
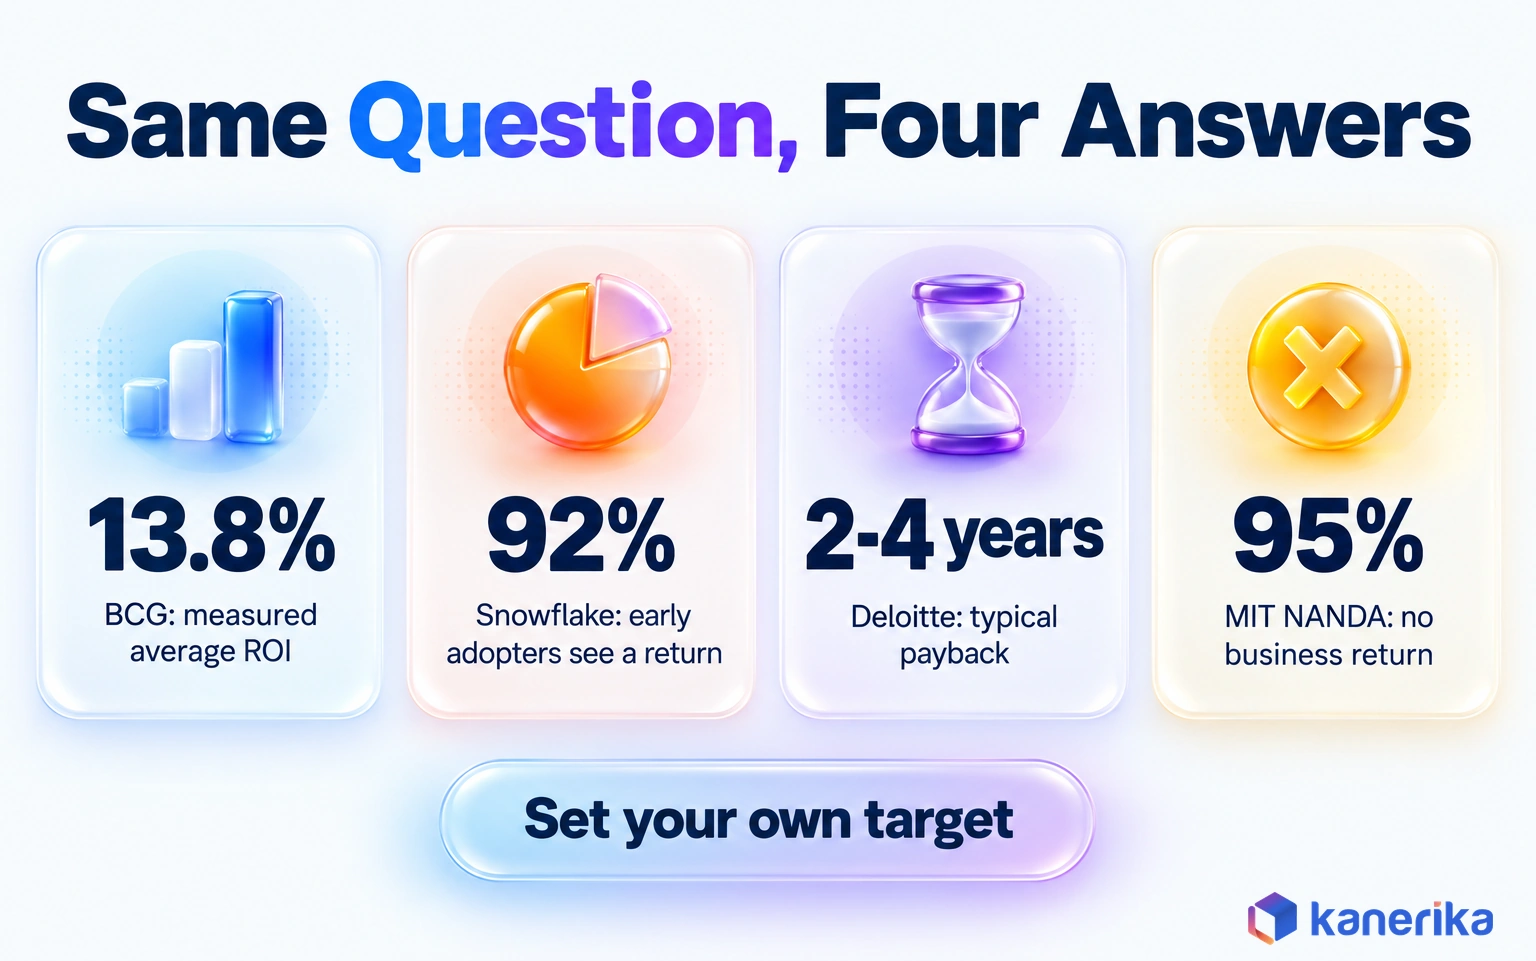
Deloitte’s survey looks at time instead. A typical AI use case takes 2-4 years to reach satisfactory ROI, while executives expect 7-12 months from other technology investments. Even among the most successful projects, only 13% paid back within 12 months, so slow payback is the norm.
Then there is the figure that travels furthest. A widely reported MIT NANDA study found that 95% of organizations saw no business return from generative AI. Its base was 153 survey responses and 52 interviews, so treat it as a warning about measurement rather than a census.
Finally, the 2022 GitHub Copilot experiment sits apart from the rest. It timed 95 developers on one task, and the Copilot group finished 55% faster than the group without it. It also completed the task more often, at 78% against 70%. That is strong evidence of task speed, but it tells you nothing about what a company earned.
Why One Study Says 95% See No Return and Another Says 92% Do
Six differences in method explain most of the gap between these studies, so check each one before you quote a benchmark.
- Definition of ROI: Some studies count productivity as return, while others count only booked financial impact.
- Self-reported or finance-measured: A respondent’s sense of a positive return is easier to give than a number a controller has checked.
- Who was asked: Early adopters with years of practice report better results than a cross-section of all companies.
- AI maturity: BCG found high-maturity companies earning about 19%, more than double the 8-9% of low or no-maturity peers.
- Time window: A study run soon after launch will miss returns that, on Deloitte’s data, often take years.
- Cost scope: A return measured against licenses alone looks far better than one measured against the full cost stack.
The practical lesson, then, is to set your own target from your own baseline. A survey average cannot tell you whether your contract-review pilot pays back, because it was measured on someone else’s work, costs and definitions.
Talk to Kanerika
Build a Generative AI Business Case Finance Will Sign
Bring one use case and its volumes. Kanerika will help you set the baseline, count the full cost and model ROI and payback at realistic realization rates.
Schedule a Demo →The Full Cost of Generative AI: What Belongs in the Denominator
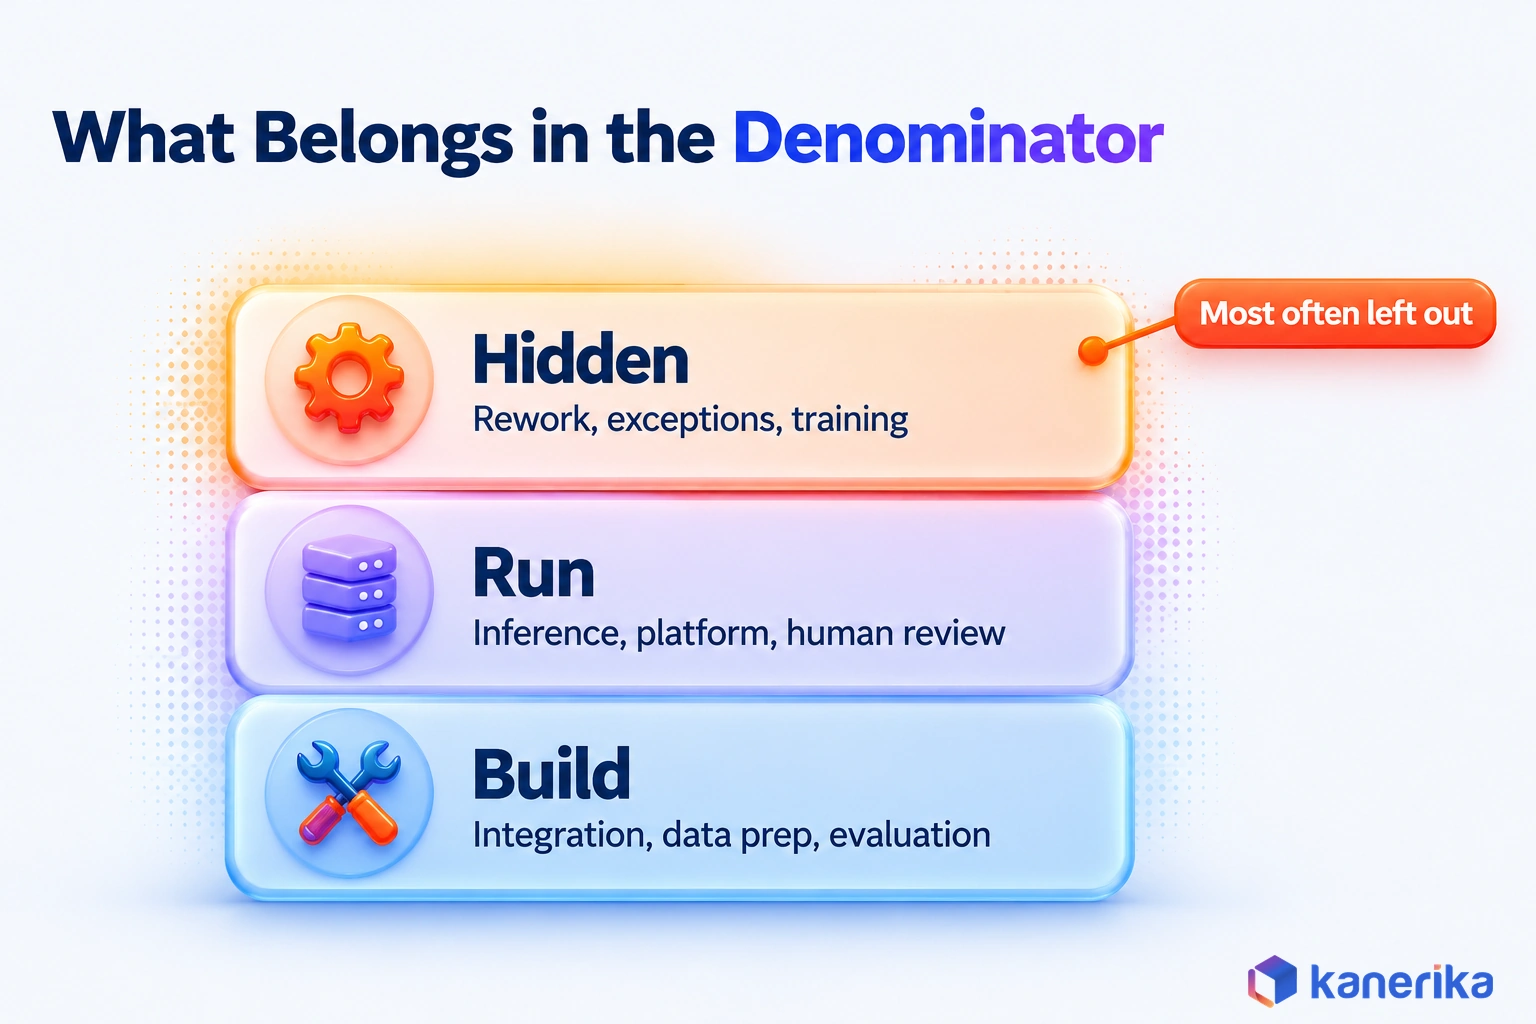
An ROI figure is only as honest as its denominator, and the denominator is where optimistic business cases hide. A license or token bill is the visible part, but only part. The rest sits in other budgets, so nobody adds it up unless someone is asked to.
Build Costs
Build costs are mostly one-time, and they land before any value arrives. They include integrating the model with the systems that hold the work, such as a contract repository or a ticketing tool. Data preparation is often the heaviest item, because documents must be cleaned, labeled and permissioned before a model can use them safely. How heavy it gets also depends on whether you choose retrieval or model fine-tuning.
Two more items are also easy to forget. A security and legal review has to approve what data the model sees, as well as where its outputs go. The security risks of large language models then set the scope of that review. An evaluation set, meaning a few hundred real examples with known correct answers, also has to exist before anyone can say the system works.
Checklist
Generative AI Checklist
Use Kanerika’s Generative AI Checklist to confirm data readiness, security review and evaluation are planned before you cost a use case.
Get the Checklist →Run Costs
Run costs recur every month while the system is live. Inference, the tokens or compute each request consumes, scales with volume as well as with how much context each prompt carries. Platform fees, vector storage, logging and monitoring then sit on top.
Still, the largest run cost is often human. When a lawyer, agent or analyst checks every output before it is used, that review time belongs in the denominator. Leave it out and the same hours get counted twice, once as a saving and once as free.
Hidden Costs
Hidden costs appear only after launch, which is why so many pilot budgets miss them. They include exception handling, rework from bad outputs, change management and training, as well as model and prompt updates and vendor price changes. The table brings every cost line together with the team that usually pays for it.
| Line item | One-time or recurring | Usual owner |
|---|---|---|
| Integration and data preparation | One-time, with upkeep | IT and data engineering |
| Security, privacy and legal review | One-time per use case | Security and legal |
| Evaluation set and test harness | One-time, refreshed | AI or product team |
| Inference and platform | Recurring | IT or cloud budget |
| Human review of outputs | Recurring | Business unit |
| Exception handling and rework | Recurring | Business unit |
| Change management and training | One-time, then refreshers | HR and the business owner |
| Model and prompt updates | Recurring | AI or product team |
| Vendor price changes | Recurring risk | Procurement |
The owner column matters as much as the cost column. When human review sits in a business unit’s budget and inference sits in IT’s, the cost of one use case is split across several ledgers. So give one finance owner the job of rolling them into a single number per use case, and review it each quarter.
How to Calculate Generative AI ROI: Formula and Worked Example
Once benefits are defined and costs listed, the calculation itself is short. Three numbers carry most of the weight: the ROI percentage, the payback period and the cost of each output you actually accept.
The Formula, Payback Period and Cost per Accepted Output
Use the same three formulas for every use case, so results can be compared across a portfolio and over time.
ROI %            = (realized annual benefit - total annual cost) / total annual cost x 100

Payback (months) = (upfront cost + year-1 run cost) / monthly realized benefit

Cost per accepted output = total run cost / outputs accepted without rework
Realized benefit is the term that needs the most care, since it is the easiest to overstate. It counts only gains that reach a financial line, once you apply the realization rate shown below.
Cost per accepted output, meanwhile, is the unit-economics check. A cheap output that needs rework is not cheap, so divide by the outputs people used as delivered.
Worked Example: AI-Assisted Contract Review
The example below is illustrative, with round numbers for a mid-sized legal operations team. It is the same pilot the CFO questioned at the start, now with the numbers filled in. Replace each input with your own baseline before you rely on it.
| Input or result | Value | How it is derived |
|---|---|---|
| Agreements per year | 12,000 | Baseline volume |
| Review time before AI | 3.0 hours | Measured baseline per agreement |
| Review time with AI, including the human check | 1.2 hours | Pilot measurement |
| Hours saved per agreement | 1.8 hours | 3.0 minus 1.2 |
| Loaded hourly cost | $60 | Salary, benefits and overhead |
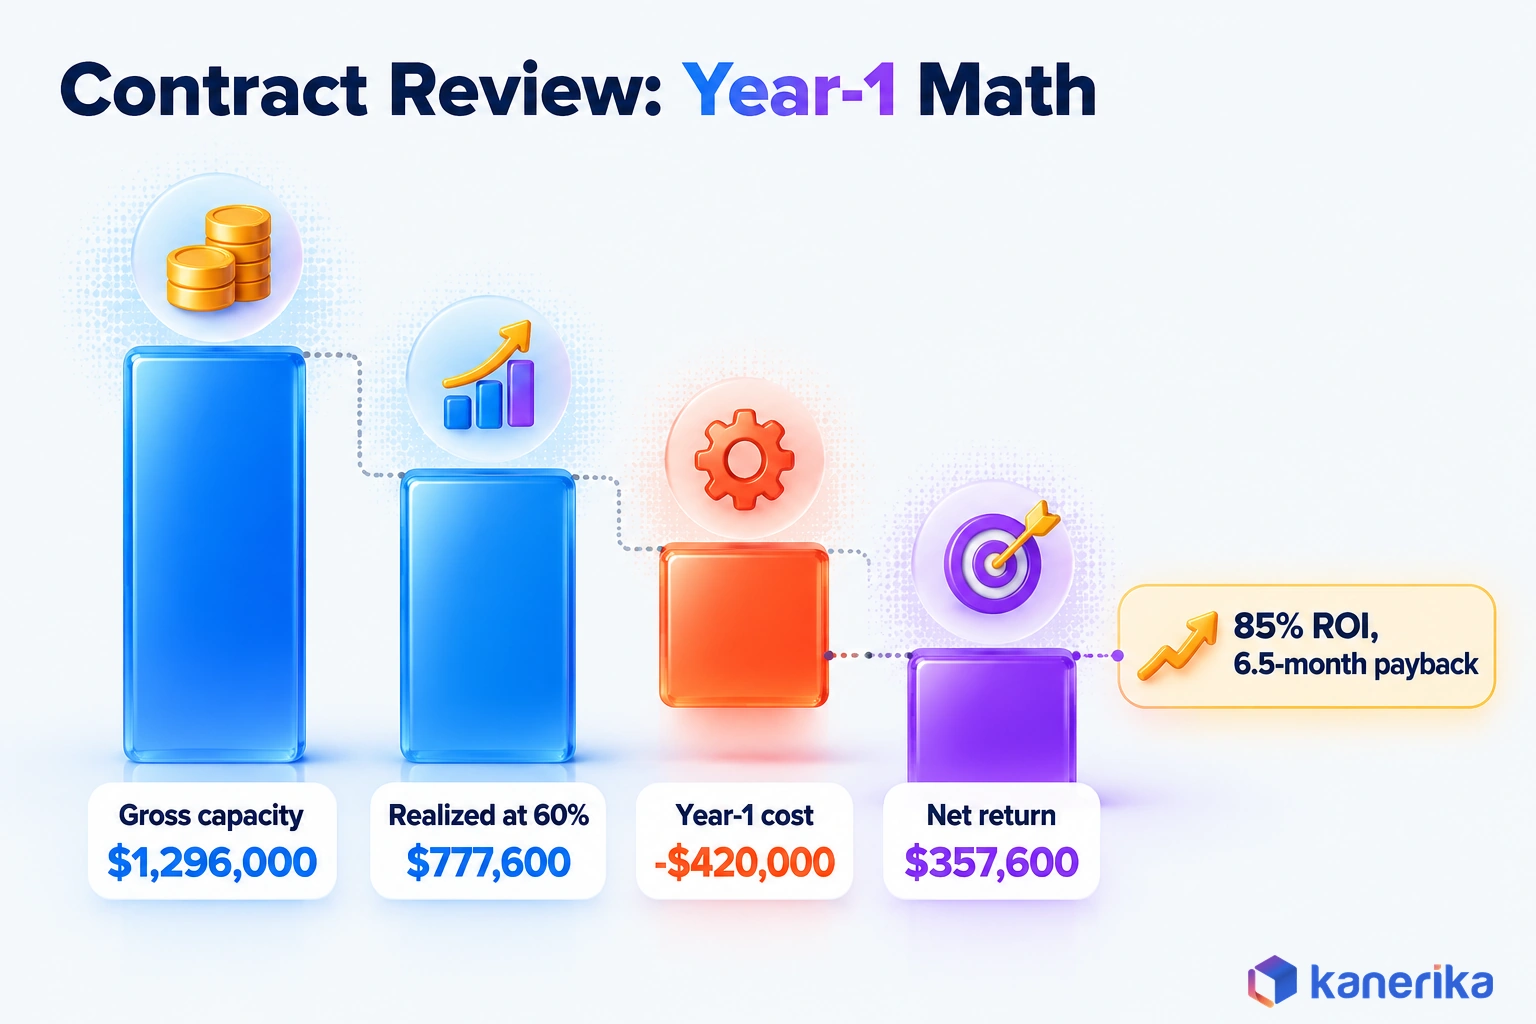
| Gross capacity released | 21,600 hours, worth $1,296,000 | 12,000 x 1.8 hours x $60 |
| Realization rate | 60% | Share of freed hours redeployed or not backfilled |
| Realized annual benefit | $777,600 | $1,296,000 x 60% |
| Year-1 cost | $420,000 | $250,000 build and integration, $120,000 run (inference, platform, monitoring), $50,000 training and change |
| Year-1 ROI | 85% | ($777,600 – $420,000) / $420,000 |
| Payback | 6.5 months | $420,000 / $64,800 realized per month |
| Year-2 ROI | 548% | ($777,600 – $120,000) / $120,000 |
In that table, two lines in particular do the real work. The realization rate turns 21,600 freed hours into $777,600 of benefit instead of $1,296,000. That is because some freed time is always absorbed by meetings, slack and lower-value work. And the 1.2 hours already include the lawyer’s check, so review effort is never counted as free.
Unit Economics and the Year-Two View
Per agreement, the same numbers look like this. Before AI, one agreement cost $180 in review time. With AI it costs $72 in review time plus about $10 in run cost, because $120,000 spread across 12,000 agreements is $10 each.
Year two looks far better because the build cost does not repeat. At the same volume and realization, $777,600 of benefit against $120,000 of run cost then gives 548%. So a pilot judged only on year one can be stopped too early. A year-two figure on its own, though, can flatter a weak case.
Sensitivity: The Two Numbers That Decide the Business Case
A business case is only as strong as its weakest assumption, so test the inputs most likely to be wrong. In this example, two of them dominate everything else, especially in year one.
| Scenario | Realized benefit | Year-1 ROI | Payback |
|---|---|---|---|
| Base case: 60% realization, 1.2 hours with AI | $777,600 | 85% | 6.5 months |
| Slower review: 1.5 hours with AI, 60% realization | $648,000 | 54% | 7.8 months |
| Break-even: about 32% realization | $420,000 | 0% | 12 months |
| Low realization: 30%, 1.2 hours with AI | $388,800 | -7.4% | 13 months |
Halving the realization rate turns an 85% return into a loss, while the model, the prompts and the accuracy stay exactly the same. Slower human review also hurts. Every extra 0.3 hours per agreement adds up to 3,600 hours a year, so it removes $129,600 of realized benefit at 60% realization.
The lesson for anyone defending a budget is plain. Adoption and redeployment decide ROI far more than model quality does. So the plan for freed hours deserves as much scrutiny as the choice of model, and it should name who will capture them.
AI Assessment
How Ready Is Your Organization to Capture AI Value?
Score your data, governance, skills and use cases in a short AI maturity assessment, and see which gaps stand between your pilots and a return finance will accept.
Start Your AI Assessment →Which Metrics Measure Generative AI ROI
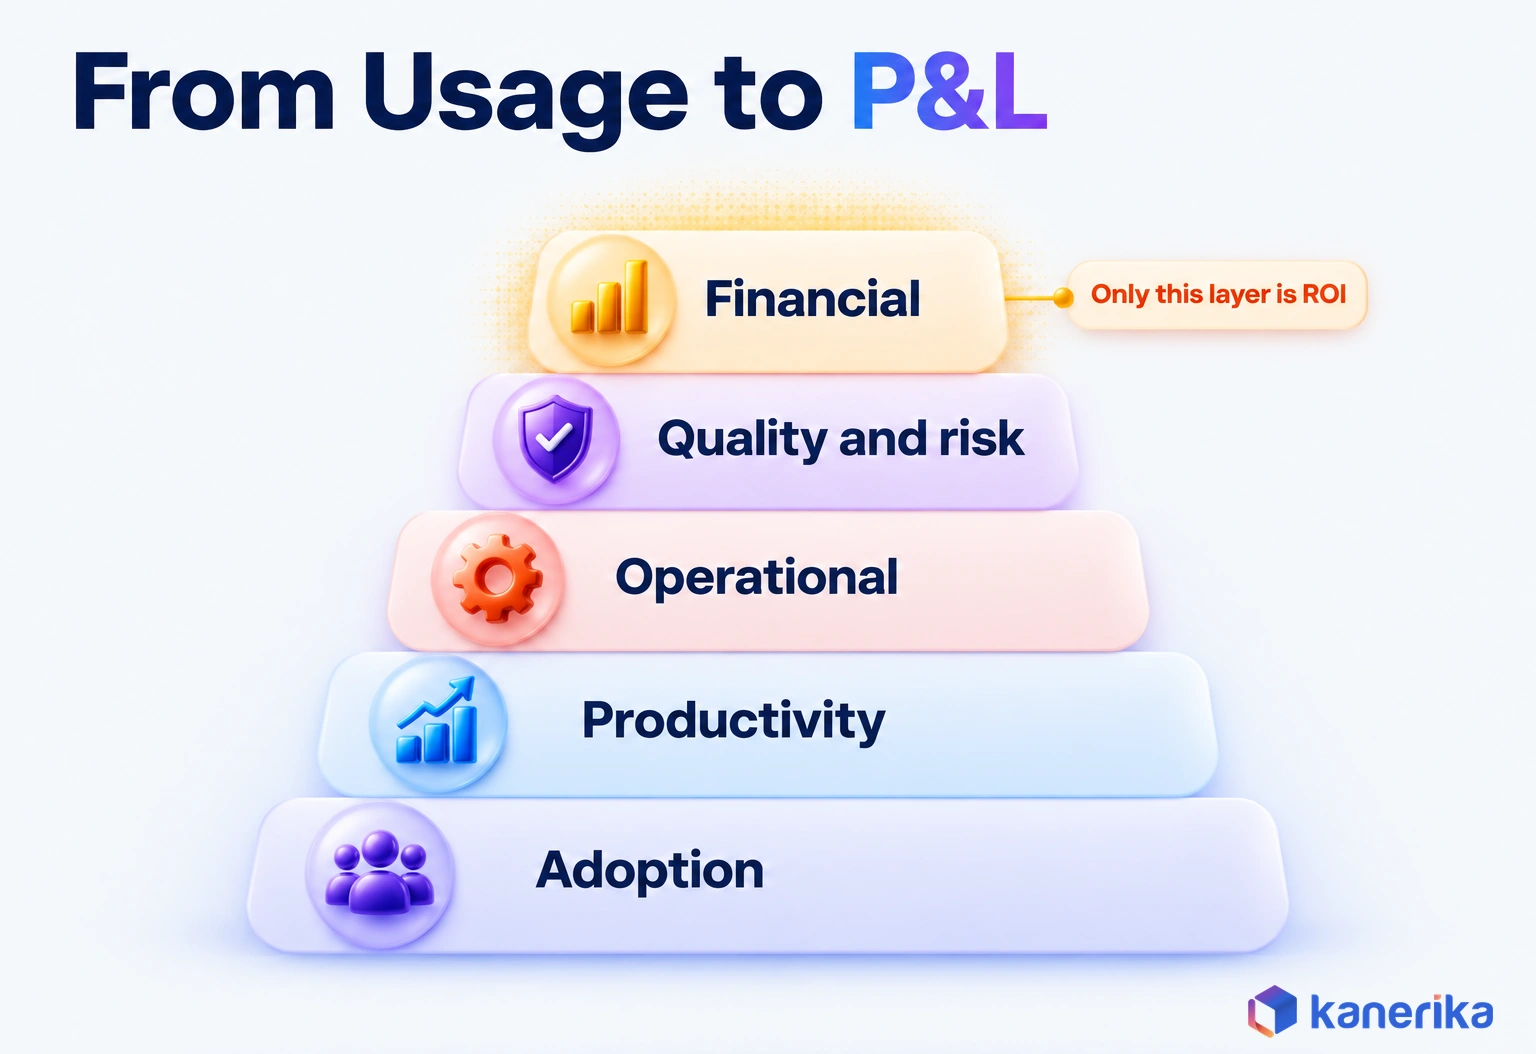
Metrics turn the formula into something you can track every month, so problems surface early. They work best in layers, from usage at the bottom to profit and loss at the top. That is because a problem in a lower layer usually predicts a problem in the return.
This expands the four-rung ladder from the start of the guide into five tracking layers. Operational and quality-and-risk metrics split the value rung, so you can see which part is slipping.
| Layer | Metrics | What it tells you |
|---|---|---|
| Adoption | Weekly active users, share of eligible work routed through AI | Whether the tool is part of the workflow |
| Productivity | Time per task, tasks per FTE, backlog size | Whether the work got faster |
| Operational | Cycle time, first-pass accuracy, escalation rate | Whether the process improved end to end |
| Quality and risk | Error rate, hallucination rate, rework rate | Whether the gains are safe to keep |
| Financial | Net savings, ROI percentage, payback, cost per accepted output | Whether the investment paid off |
Track all five layers, but report the financial layer to the board. When the financial number stalls, the lower layers show where to look. Low adoption calls for workflow redesign, while a high rework rate points back to data or prompts.
Lead Metrics by Use Case
Each of the common generative AI use cases also has a lead metric, the one most closely tied to money. Pick it before the pilot starts, so the baseline measures the right thing.
| Use case | Lead metric | Financial line it moves |
|---|---|---|
| Customer support | Cost per resolved ticket | Support operating cost |
| Software delivery | Cycle time per change | Engineering capacity, release speed |
| Document processing | Cost per document processed without rework | Back-office cost, outside counsel spend |
| Sales and marketing content | Cost per approved asset, conversion rate | Agency spend, pipeline |
The same lead-metric logic applies to analytics. When you build a case for generative AI for data analytics, the lead metric is usually the time to answer a business question. That time then ties back to analyst hours or to external reporting spend.
Generative AI ROI by Use Case and Implementation Approach
How you build a use case shapes its cost curve as much as what the use case does. For example, the same contract-review goal can run on an off-the-shelf copilot, on retrieval over your own documents or on a fine-tuned model. Each option then has a different denominator and a different point where the return shows up.
| Approach | Main cost drivers | Where ROI shows up | When it is the wrong choice |
|---|---|---|---|
| SaaS copilot | Per-seat licenses, training | Individual productivity on general tasks | Gains stay with each person and never reach a process metric |
| API plus prompts | Tokens, integration, prompt upkeep | Narrow, high-volume tasks inside existing apps | Outputs need company knowledge a prompt cannot hold |
| RAG over company data | Data preparation, retrieval infrastructure, access controls | Answers grounded in your own documents | Source content is messy, outdated or unpermissioned |
| AI agent | Orchestration, tool access, monitoring, approvals | Multi-step work that crosses systems | Steps are fully predictable and a rule would do |
| Fine-tuned model | Training data, compute, retraining cycles | Consistent output in a specialist format or tone | Knowledge changes often or volumes are low |
Deciding between RAG or fine-tuning is often the largest cost decision in that table. One moves spend into data preparation, while the other moves it into training cycles. Similarly, the choice of generative AI versus predictive AI matters just as much. A forecasting or scoring problem rarely needs a generative model, and a predictive one usually costs less to run than a generative one.
When Traditional Automation Is the Better Financial Choice
Some work does not need generative AI at all. High-volume, rule-based and deterministic tasks are cheaper and more predictable when handled by workflow automation or RPA. Typical examples include routing invoices by vendor code, as well as copying fields between systems.
The reason is cost per run: a rule costs almost nothing, never hallucinates and needs no human check. Generative AI earns its cost where inputs are unstructured and judgment varies, such as reading a contract clause or drafting a reply. So apply a simple test. If you can draw the logic as a flowchart, automate it with rules, and if the work needs reading and interpretation, consider a model.
On-Demand Webinar
Custom vs Off-the-Shelf AI: Expert Insights on Choosing the Right Solution
Kanerika experts compare building custom AI with buying ready-made tools, including what each choice means for cost, fit and time to value.
Watch the Webinar →A Staged Path: Baseline, Pilot With a Control Group, Then Scale or Stop
Boards trust numbers that were planned before a pilot more than numbers found after it. A staged path gives finance that confidence, and it also gives the delivery team clear rules for taking an AI pilot to production or stopping it.
- Define the financial outcome and its owner: Name the line to move, such as outside counsel spend, and the finance partner who confirms it.
- Measure the baseline for 4-8 weeks: Record volume, time per task, error rate and cost per unit before anything changes.
- Pilot with a control group: Run one team or region with AI while a comparable one works without it, over the same period.
- Count the full cost: Include build, run and hidden costs, with human review time measured instead of assumed.
- Validate against the baseline: Compare the pilot group with both the baseline and the control group, so seasonal swings do not pass as gains.
- Run the sensitivity test: Recalculate ROI at lower realization and slower review, and then check whether the case survives.
- Apply the scale, fix or stop gate: Use thresholds agreed before launch, such as a minimum year-1 ROI and a maximum payback period.
- Review value every quarter: Re-measure benefit and cost in production, since volumes, prices and models all change.
The control group is what separates proof from anecdote. Without one, a busy quarter or a strong new hire can look like an AI gain, even though AI played no part. Once you have one, the difference between the two groups is an effect you can defend in front of an audit committee.
Set Scale, Fix and Stop Thresholds in Finance Terms
Write the thresholds in the language finance already uses. A team might agree to scale when year-1 ROI clears its hurdle rate and payback falls under 12 months. It would fix the case when gains are real but costs run high, and stop when the pilot group cannot beat the control group.
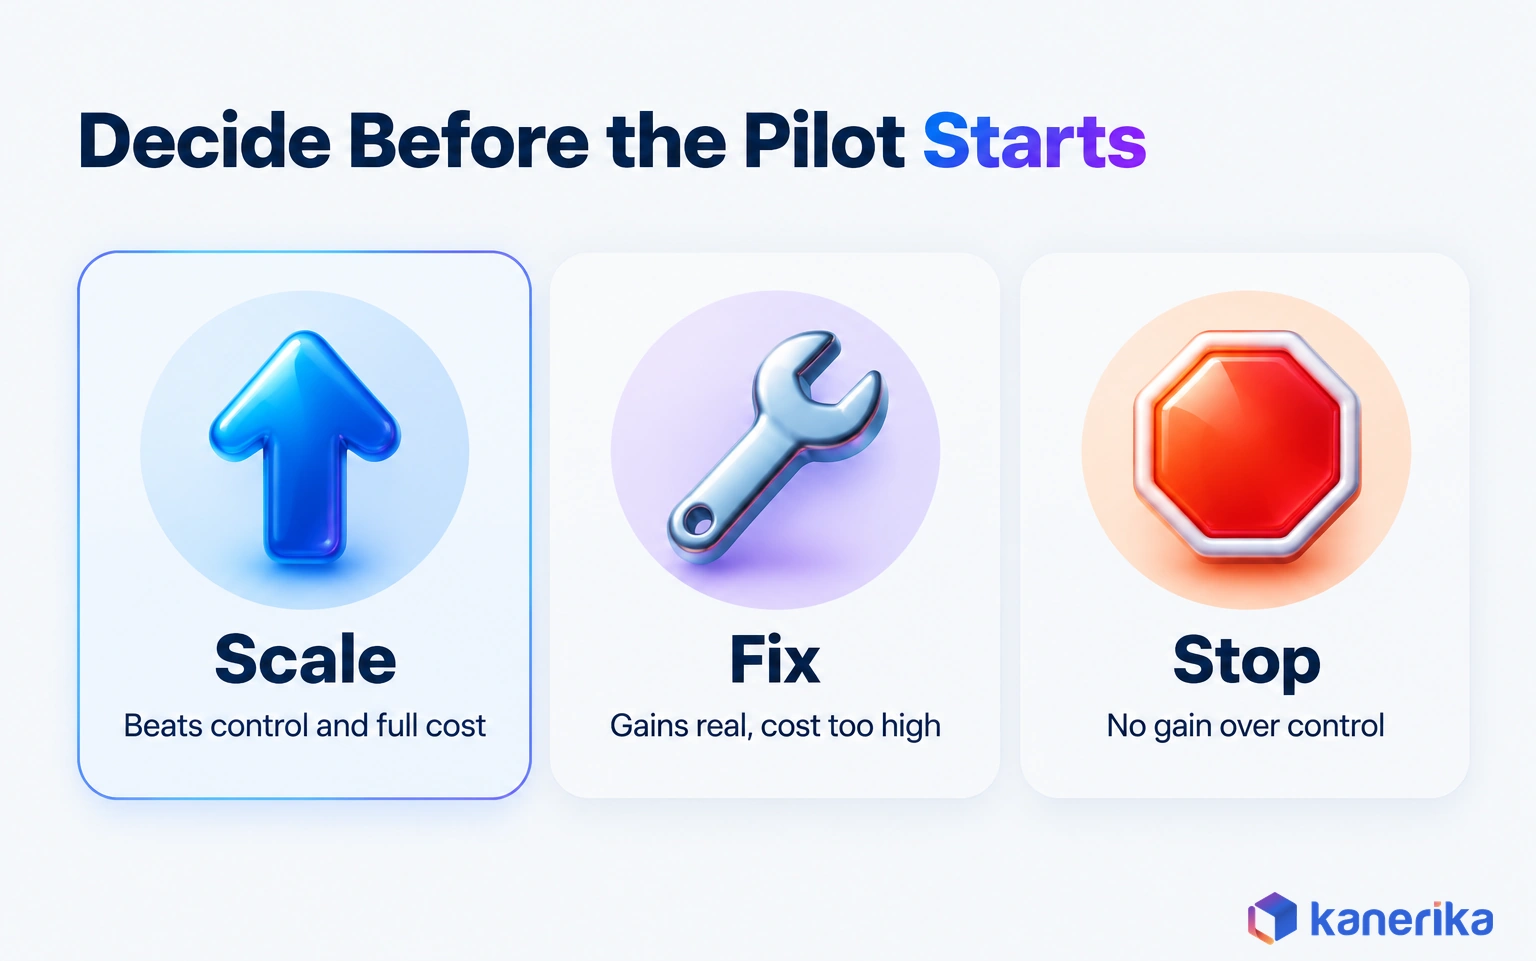
Apply that to the worked example, assuming a 15% hurdle rate and a 12-month payback ceiling. The base case, at 85% and 6.5 months, clears both and scales.
The 30% realization case, at -7.4% and 13 months, goes to fix rather than stop. Its time saving is real, and only the redeployment plan failed. A pilot that cannot beat its control group on time per agreement is the one that stops.
Why Generative AI ROI Falls Short: Risks and Common Mistakes
When a generative AI program fails to show a return, the model is rarely the cause. The usual culprit is a measurement gap, or a cost that nobody planned for, and both can be fixed before the next pilot starts.
Three common failures are the measurement gaps covered above: freed time counted as cash, no baseline, and review and rework left out of the cost. The other four are delivery risks, and each one erodes the return through a different part of the formula.
Pilots chosen for demo appeal tend to run on low-volume work, so even a large saving per task never moves a financial line. Data that is not ready raises the build cost before any value arrives. Snowflake found 96% of respondents grapple with significant issues, with data quality and quantity on top at 40%.
Governance gaps hit the timeline instead of the budget. When rules on data access and output use are unclear, projects stall at security review, so the payback date slips while run costs keep accruing. Model drift is the slowest risk, because accuracy slips as inputs, prompts or model versions change and rework rises without anyone noticing.
Adjust the Return for Risk
Risk belongs inside the calculation, not in a footnote. The simplest method is expected error cost, since it fits straight into the formula. Multiply the cost of one bad output by how often it happens, and then subtract the result from the benefit.
In contract review, a missed indemnity clause may be rare but expensive. As an illustration, suppose one agreement in 1,000 slips through with a missed clause costing $20,000. At 12,000 agreements a year, that is 12 misses and $240,000.
Realized benefit then falls from $777,600 to $537,600, and year-1 ROI falls from 85% to about 28%. Mandatory review of high-risk clauses lowers that number, and so do the security controls set during the build.
On-Demand Webinar
The Real Cost of LLM Security Risks and How to Reduce Them
An on-demand Kanerika session on what LLM security failures cost a business and the controls that reduce that exposure.
Watch the Webinar →How Kanerika Measures and Delivers Generative AI ROI
At Kanerika, we start each generative AI engagement from the financial outcome and the baseline, before any model is chosen. We agree on the line a use case should move, measure the current process and design the pilot so finance can check its result.
Our work with a real estate developer backed by a large Middle-Eastern public investment fund shows those inputs in practice. Its vendor agreements sat as unstructured PDFs in Oracle Content Management Cloud, so finding terms meant reading documents by hand. We assessed the data, prepared Google Cloud for the workload and then built LLM extraction with a chat interface for vendor queries.
- 82% reduction in manual processing time
- 75% increase in cloud integration efficiency
- 90% boost in vendor selection
These are operational outcomes, but they are the inputs the worked example turns into money: hours removed per agreement, volume and time redeployed. The vendor agreement case study describes the project in full. Our generative AI services also cover the same path, from baseline to a scaled production system.
Kanerika Service
Generative AI Services Built Around a Measurable Return
Kanerika scopes each generative AI use case from a financial outcome and a baseline, then builds, pilots and scales what the numbers support.
Explore Generative AI ServicesWhat Good Generative AI ROI Looks Like in 2026
A good return is one that clears your own hurdle rate on verified numbers. BCG’s 13.8% average is a reference point, not a target, because your risk and your volumes decide the bar.
- A good return is verified benefit above the full cost, confirmed against a baseline and a control group.
- It also survives a sensitivity test at lower realization and slower review.
- It scales on unit economics, so cost per accepted output falls as volume grows.
Use cases that pass all three tests are the ones worth scaling across the enterprise, while the rest go back for fixing or stop.
So how do you prove generative AI ROI in 2026? Measure the baseline, count every cost and apply the formula with a realistic realization rate. Then let thresholds agreed in advance decide whether to scale, fix or stop.
Frequently Asked Questions
What is generative AI ROI?
Generative AI ROI is the verified net financial return from a generative AI use case compared with its full cost. Benefit counts only gains that reach a financial line, such as lower spend or new revenue. Cost covers build, run and hidden items, including human review of outputs. Usage and time saved feed the calculation as inputs.
How do you calculate generative AI ROI?
Subtract total annual cost from realized annual benefit, divide by total annual cost and multiply by 100. Realized benefit applies a realization rate to freed hours, because only redeployed or unbudgeted time becomes money. Add payback in months, which divides upfront and year-one cost by monthly realized benefit, and track cost per accepted output.
How can companies maximize generative AI ROI?
Pick high-volume workflows with a measurable baseline and a named financial owner. Plan where freed hours will go before launch, since the realization rate drives most of the return. Keep human review efficient with good evaluation sets, choose the cheapest approach that fits the task and review benefit and cost every quarter once the system goes live.
What is a good ROI for generative AI in 2026?
There is no universal figure. BCG’s 13.8% weighted average is a useful reference point, and its high-maturity companies reached about 19%. A good return for your organization is verified benefit above the full cost that beats your internal hurdle rate, with a payback period your finance team accepts and a case that survives sensitivity testing.
How do you measure the ROI of an AI copilot?
Start with a baseline of time per task and output quality for the people who will use the copilot. Run a pilot group and a control group over the same period and compare the results. Convert saved hours into money only where the time is redeployed, then subtract license, training and review costs to reach ROI.
How do hallucinations and human review affect generative AI ROI?
Both reduce the return. Human review adds labor cost to every output, and hallucinations add rework plus the expected cost of errors that slip through. Measure review time as part of the AI-assisted process from the first day of the pilot. Then estimate risk as the cost of one bad output multiplied by how often it happens.
When should an enterprise stop a generative AI pilot?
Stop when the pilot group cannot beat the control group on the agreed metric, or when the case fails its preset thresholds under realistic assumptions. A pilot that only works at an unrealistic realization rate should also stop. Agree these stop conditions with finance before launch, so the decision follows the evidence and avoids sunk-cost pressure.
How do you turn AI productivity gains into cost savings?
Decide in advance where freed hours will go. They become savings when they replace paid work such as outside counsel or contractors, when planned hires are avoided or when overtime falls. They become revenue when staff move to sales or delivery work. Record the chosen route in the business case and measure it after launch.
Is generative AI more cost-effective than traditional automation?
It depends on the work. Rule-based, high-volume and predictable tasks are usually cheaper with workflow automation or RPA, since rules cost little to run and need no human review. Generative AI pays off where inputs are unstructured and judgment varies, such as reading contracts or drafting replies. Many processes combine both to keep total cost down.
What costs should be included in a generative AI ROI calculation?
Include build costs such as integration, data preparation, security review and evaluation sets. Add run costs such as inference, platform fees, monitoring and the time people spend reviewing outputs. Then add hidden costs, including exception handling, rework, training, model and prompt updates and vendor price changes. One finance owner should total them per use case.
What metrics measure generative AI ROI?
Use five layers of metrics. Adoption shows weekly active users and the share of eligible work routed through AI. Productivity covers time per task and tasks per FTE. Operational metrics track cycle time and first-pass accuracy, and quality metrics track error and rework rates. Financial metrics such as net savings, ROI percentage and payback go to the board.
What is the average ROI for generative AI?
BCG research published in September 2026 put the weighted-average measured ROI on generative AI and AI agent deployments at 13.8%, up from 11.2% in mid-2025. Snowflake and Omdia found that early adopters who quantified their return reported $1.49 back for every dollar invested. Averages vary by study, so set your own target from a baseline.
Is generative AI actually profitable for enterprises?
It can be, and the evidence is mixed. BCG found high-maturity companies earning about 19% on deployments, compared with 8-9% for companies with low or no AI maturity. A widely reported MIT NANDA study found 95% of organizations saw no business return. Profit depends on use case choice, full cost accounting and redeploying the time that AI frees.
Why do so many generative AI projects fail to show ROI?
Most failures come from measurement and planning gaps. Teams skip the baseline, count saved time as cash, leave human review out of the cost and pick pilots for demo appeal. Data problems add to this, since Snowflake research found data quality and quantity were the top issue for 40% of respondents. Governance delays and model drift also erode returns.
Why is measuring generative AI ROI hard?
Benefits are spread across many small tasks and many teams, so they rarely land on one budget line. Costs sit in different budgets too, from IT inference bills to review time in business units. Freed hours stay as capacity until someone redeploys them. Without a baseline and a control group, a seasonal swing can look like an AI gain.
How long does it take for generative AI to deliver ROI?
Deloitte found that most organizations reach satisfactory ROI on a typical AI use case in two to four years, against the seven to twelve months expected for other technology. Only 6% reported payback within a year. Narrow, high-volume use cases with a measured baseline can pay back sooner, as the illustrative contract review example in this guide shows.
Which industries and use cases see the highest generative AI ROI?
Returns tend to be strongest where work is high volume, document heavy and well measured. Customer support, document processing, contract review, software delivery and marketing content are common examples across banking, insurance, legal, retail and manufacturing. The workflow matters more than the sector, so choose use cases with a clear baseline, a financial owner and enough volume.