TL;DR
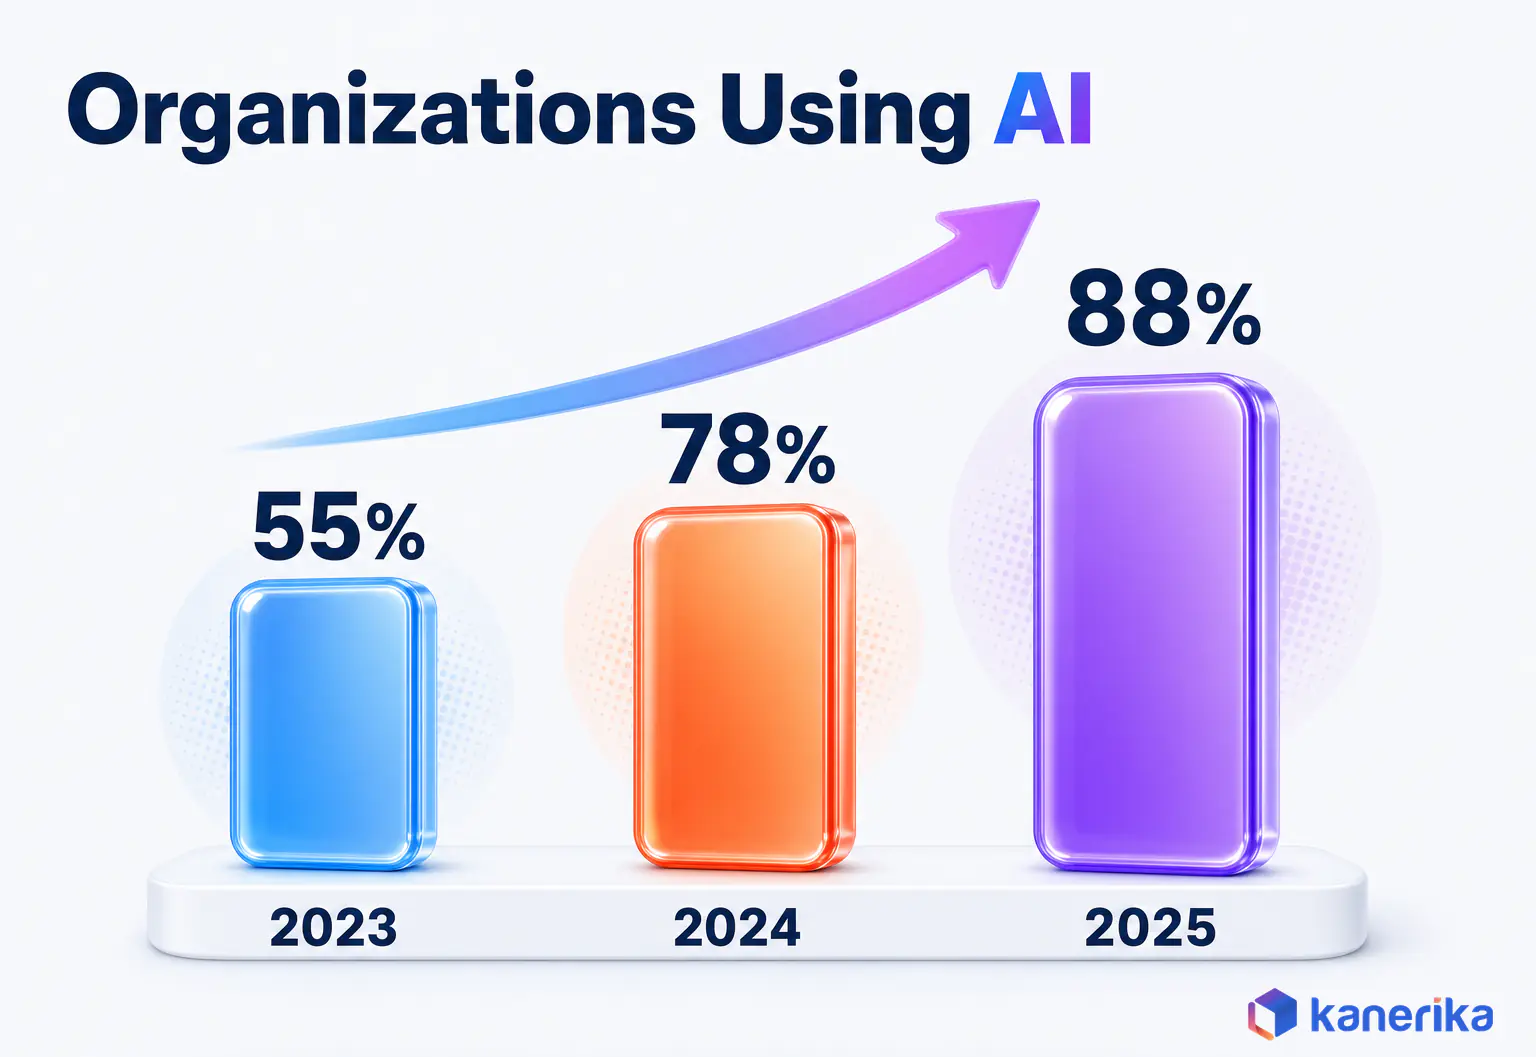
Generative AI statistics for 2026 show adoption that is wide among organizations and workers but uneven across businesses, with measured impact in a minority. Stanford’s AI Index 2026 found AI of any kind in use at 88% of organizations in 2025. About 41% of US workers used generative AI for work in November 2025, per the Federal Reserve.
About one in five US businesses used AI in early 2026, rising to 37% of firms with 250 or more staff, per the Census Bureau. Only 37% of respondents saw any impact on earnings in McKinsey’s 2026 survey, as reported by FM magazine. Judge reach by adoption numbers and impact by measured, dated results.
Key Takeaways
- Organizational AI adoption reached 88% in 2025 (Stanford AI Index 2026), while 17% to 20% of all US businesses used AI in early 2026 (US Census Bureau).
- The figures disagree because surveys count different units: organizations, workers or every business.
- Enterprise generative AI spend reached $37 billion in 2025, and 76% of AI solutions were bought rather than built (Menlo Ventures).
- Measured impact still trails use: 37% report some EBIT impact and about 6% are high performers in 2026 (McKinsey, as reported by FM magazine).
- Controlled research shows real but uneven gains, such as 14% more customer issues resolved per hour (NBER, QJE 2025).
- Governance also lags use: 97% of organizations with AI breaches lacked proper AI access controls in 2025 (IBM).
Two Reports, One CFO and a 70-Point Gap
Picture a CFO preparing for a budget meeting, when two reports land on the desk. A Federal Reserve note from April 2026 says about 18% of US firms had adopted AI by the end of 2025. The Stanford AI Index 2026, however, says organizational adoption reached 88%.
Both numbers are correct. They simply count different things, so that difference decides whether a generative AI business case looks late or early.
This guide collects the generative AI statistics that matter in 2026, each with its source and its data year. It also explains why the figures disagree, what companies spend, and where measured impact shows up. If you want the technology first, start with how generative AI models and LLMs work.
Generative AI Statistics 2026 at a Glance
A statistic is only as useful as its source and its date, so the table below pairs every headline figure with both. Read the data-year column first, because most reports published in 2026 describe what happened in 2025.
The Stanford figure, for example, shows the lag. It was published in 2026, yet it measures adoption during 2025, while the Census range covers December 2025 to May 2026.
Headline Figures, Sources and Data Years
Overall, two patterns stand out. The reach figures near the top of the table are large and still rising. The value figures lower down, however, are smaller and concentrated in fewer companies, and the rest of this guide explains that gap.
How Widely Is Generative AI Adopted in 2026?
Adoption is the first half of the title question, and the honest answer depends on who you ask. A survey of organizations, a survey of every US business and a survey of workers each return a different number, and each one is correct.
Most organization and business surveys also ask about AI of any kind, not generative AI alone. For generative AI itself, the Federal Reserve found 41% of US workers using it in November 2025. In the same note, 54% of the labor force worked at firms using large language models. The AI Index 2026 adds 53% population adoption.
Organizations: From 55% to 88% in Two Years
The Stanford AI Index tracks how many organizations use AI in at least some part of the business. Its 2025 edition reported 78% in 2024, compared to 55% in 2023. The AI Index 2026 then puts the figure at 88% for 2025.
That climb of 33 points in two years is especially steep. Keep the unit in mind, though. An organization counts as an adopter when AI is in use somewhere inside it, so one team’s pilot can be enough.
US Businesses and Sectors: 17% to 20%
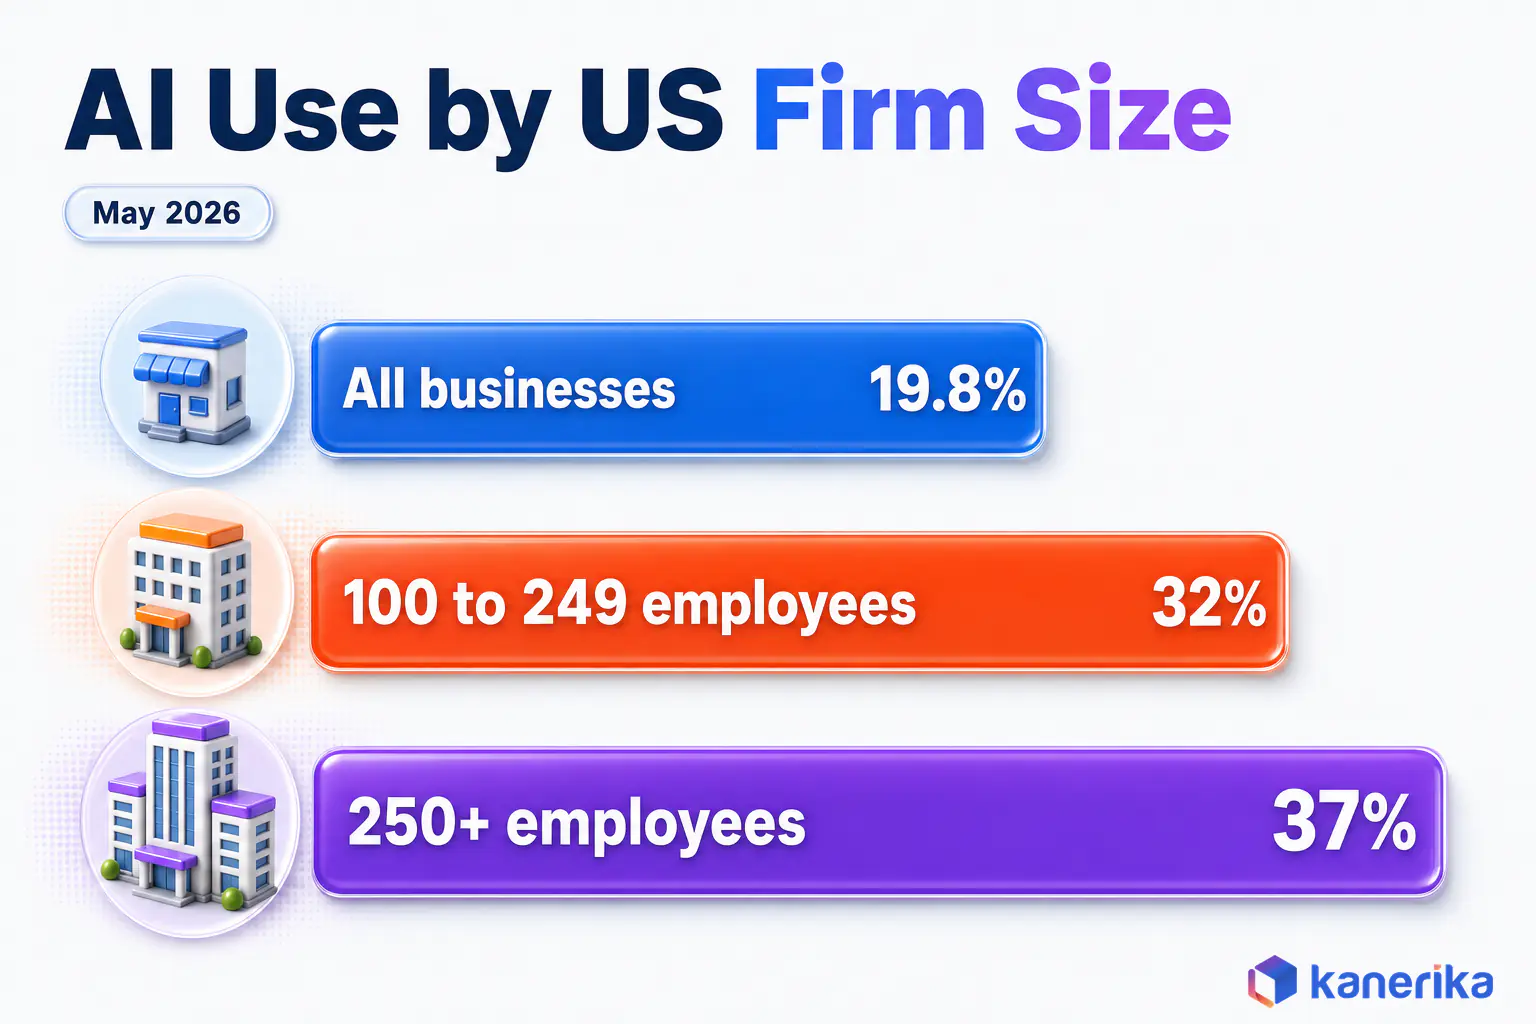
The US Census Bureau, in contrast, asks a far broader group: every kind of business, from small shops to large manufacturers. In its Business Trends and Outlook Survey, AI use hovered between 17% and 20% from December 2025 to May 2026. The national rate stood at 19.8% as of May 3, 2026, and between 20% and 23% of businesses expected to use AI within six months.
Sector also matters. The same Census release shows these rates as of May 3, 2026.
| Sector (US) | Businesses using AI, May 2026 |
|---|
| Information | 39.7% |
| Finance and Insurance | 33.9% |
| All US businesses | 19.8% |
| Retail trade | About 14% |
Information and finance firms run on documents, code and data, so generative AI tools fit there first. Retailers carry more physical work, so their adoption trails. For examples by function, see generative AI use cases that work and Kanerika’s guide to generative AI for retail.
Firm size moves the number too. In the Census data from December 2025 to May 2026, 37% of firms with at least 250 employees used AI. Fewer than 20% of the smallest firms, those with four or fewer employees, did the same. Among firms with 100 to 249 employees in the period ending May 3, 2026, the rate was 32%.
Workers and Developers
Counting people instead of firms gives a higher number again. The Federal Reserve’s April 2026 note found about 41% of US workers used generative AI for work as of November 2025. It also cites a November 2025 survey estimating that 78% of the labor force works at firms that have adopted AI. About 54% also work at firms that use large language models.
Developers sit further ahead. In the 2025 Stack Overflow Developer Survey, 84% of respondents used or planned to use AI tools, up from 76% a year earlier. Half of professional developers, 51%, used them every day.
Countries and Population
Generative AI reached 53% population adoption within three years, faster than the PC or the internet, according to the Stanford AI Index 2026. Usage varies widely by country and correlates strongly with GDP per capita. The UAE at 64% and Singapore at 61% beat that pattern, while the United States ranked 24th at 28.3% despite its high income.
Students may be the clearest leading indicator of all. The same 2026 report finds 4 in 5 university students now use generative AI, which shapes the habits of the next intake of employees. For the wider picture of how companies roll the technology out, see Kanerika’s overview of AI adoption.
Why Do Generative AI Adoption Statistics Disagree?
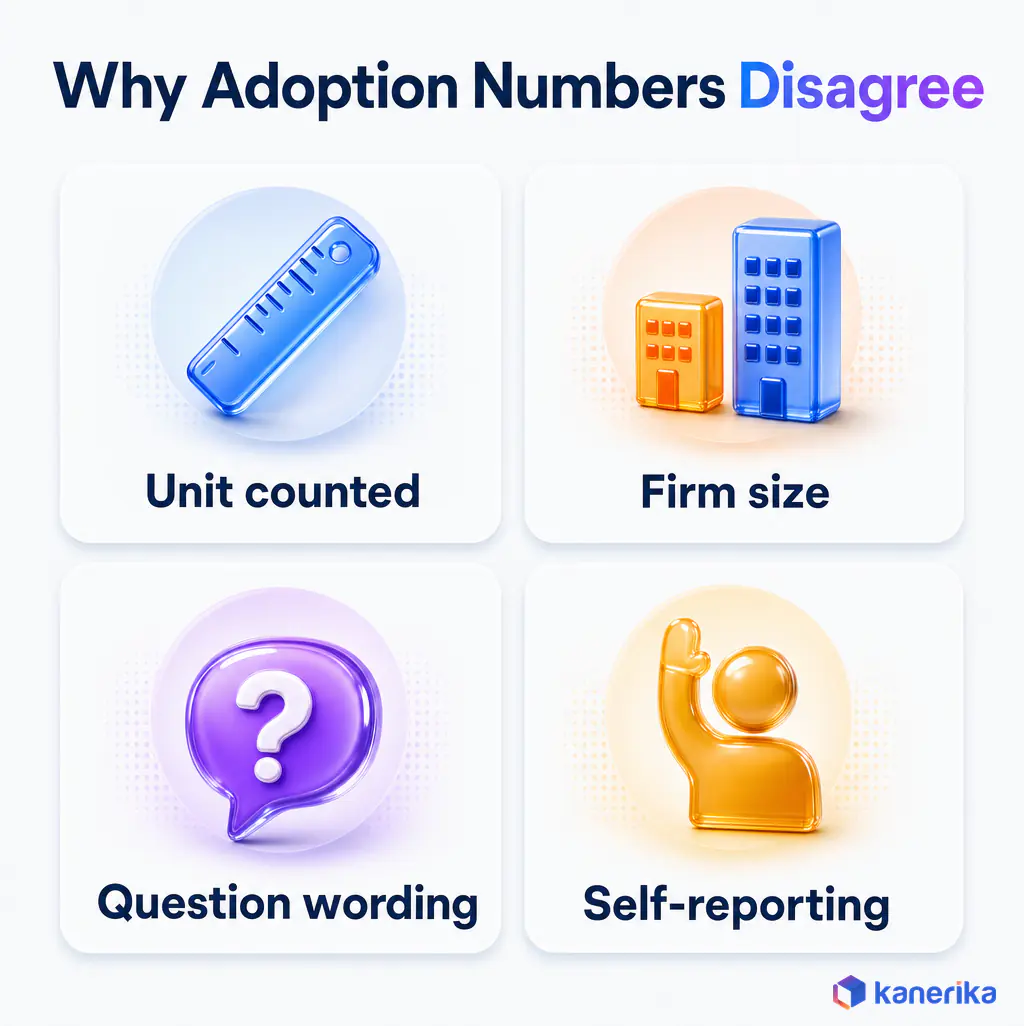
Generative AI statistics disagree because each survey counts a different thing. Each figure is accurate for the group it measures. Once you know the unit, the firm, worker and organization figures describe the same economy from three angles.
Take a manufacturer with 5,000 staff where one marketing team uses a chatbot. An organization survey then counts the whole company as an adopter. A worker survey counts only that team, and an all-business survey gives the company the same weight as a two-person shop.
Four Reasons the Numbers Split
The unit counted. Organization surveys ask whether AI is used anywhere, worker surveys ask whether a person uses it, and business surveys count each firm once. The Federal Reserve, for instance, puts the US firm rate at about 18% for year-end 2025. Once weighted by employment, the same economy shows 78% of the labor force at adopting firms.
Firm size. Large companies adopt first, and they also employ a large share of workers. That is why the Census rate reaches 37% among firms with 250 or more employees in its December 2025 to May 2026 data. Across all businesses, the rate was 19.8% as of May 3, 2026.
Question wording. In November 2025 the Census Bureau also broadened its question. It now asks about AI “in any business function” rather than only AI used in producing goods or services. A wording change can move a series with no change in real behavior, so compare figures only within one method.
Self-reporting. Most adoption figures come from people describing their own use. They are honest answers, yet they measure perception, which is why the impact section below separates self-reported gains from measured ones.
So surveys record what respondents say about AI rather than what projects deliver. Project records offer a useful cross-check, as shown in what Kanerika’s delivery data shows about enterprise AI adoption.
A pilot only shows up in impact figures once it scales, and that step is where many programs stall. The video below explains how to design pilots that lead to real adoption.
Watch on YouTube
AI Pilot Projects: The Secret to Successful Adoption
Why adoption figures only turn into business impact once pilots scale, and how to design an AI pilot with the success measures, owners and data that carry it into production.
How Much Are Companies Spending on Generative AI?
Spending is the second test of adoption, because budgets show commitment in a way survey answers cannot. Here the figures split cleanly into money already spent and money that is only forecast.
Enterprise Spend: $37 Billion in 2025
Menlo Ventures estimates that enterprises spent $37 billion on generative AI in 2025, compared to $11.5 billion in 2024. That is a 3.2-fold rise in one year, and the largest share, $19 billion, went to applications rather than infrastructure.
Buying also beat building. Menlo found that 76% of enterprise AI solutions in 2025 were purchased rather than built in-house. Most firms, in other words, want working tools more than model research. The pattern shows up across generative AI in the enterprise as well as in the crowded market for generative AI tools.
Investment and Forecasts
Investor money tells a related story at a far larger scale. US private AI investment reached $285.9 billion in 2025, more than 23 times China’s $12.4 billion, according to the Stanford AI Index 2026. Private investment in generative AI alone was $33.9 billion in 2024, up 18.7% compared to 2023, per the AI Index 2025.
Forecasts then sit on top of those measured figures. In January 2026, Gartner forecast that worldwide AI spending would total $2.52 trillion in 2026, up 44% year over year, as reported by iTWire. That figure covers all AI spending, not generative AI alone, and it is a projection rather than a count.
For that reason, label every number in a business case as measured or forecast. A measured total for 2025 and a forecast for 2026 answer different questions, and adding them together produces nonsense.
Why Market-Size Estimates Disagree
Published generative AI market-size estimates differ widely, so this guide does not repeat one. None that we checked could be traced to a primary page showing both the figure and the method behind it.
Scope explains most of the spread. One estimate counts only foundation models, another adds the applications built on them, and a third folds in chips and cloud capacity. Each choice is defensible, but the totals cannot be compared. Measured enterprise spend, such as Menlo’s $37 billion for 2025, is the safer anchor for planning.
What Generative AI Costs to Run
Running a model has also become far cheaper. The Stanford AI Index 2025 found the cost of querying a model at GPT-3.5 level fell more than 280-fold between November 2022 and October 2024. Over the same period, hardware costs fell about 30% a year, while energy efficiency improved about 40% a year.
Cheaper inference therefore changes the business case. A use case that failed on cost in 2023 may pass in 2026, so re-run old numbers before you dismiss an idea. In particular, teams weighing hosted models against private LLMs should model both cost curves.
Kanerika Service
Generative AI Consulting and Development
Kanerika designs, builds and governs generative AI applications, from copilots and document assistants to agents, scoped to a measured business problem and costed before the first build.
Explore Generative AI Services
What Business Impact Is Generative AI Delivering?
Business impact is the second half of the title question, and it is where generative AI statistics shrink. Many companies use generative AI, while far fewer can point to a change in profit.
Think of a sales team whose staff say a writing assistant saves them time each week. Unless that time turns into more deals or lower costs, the finance team sees no change in earnings.
Profit Impact: 37% See Some, About 6% See a Lot
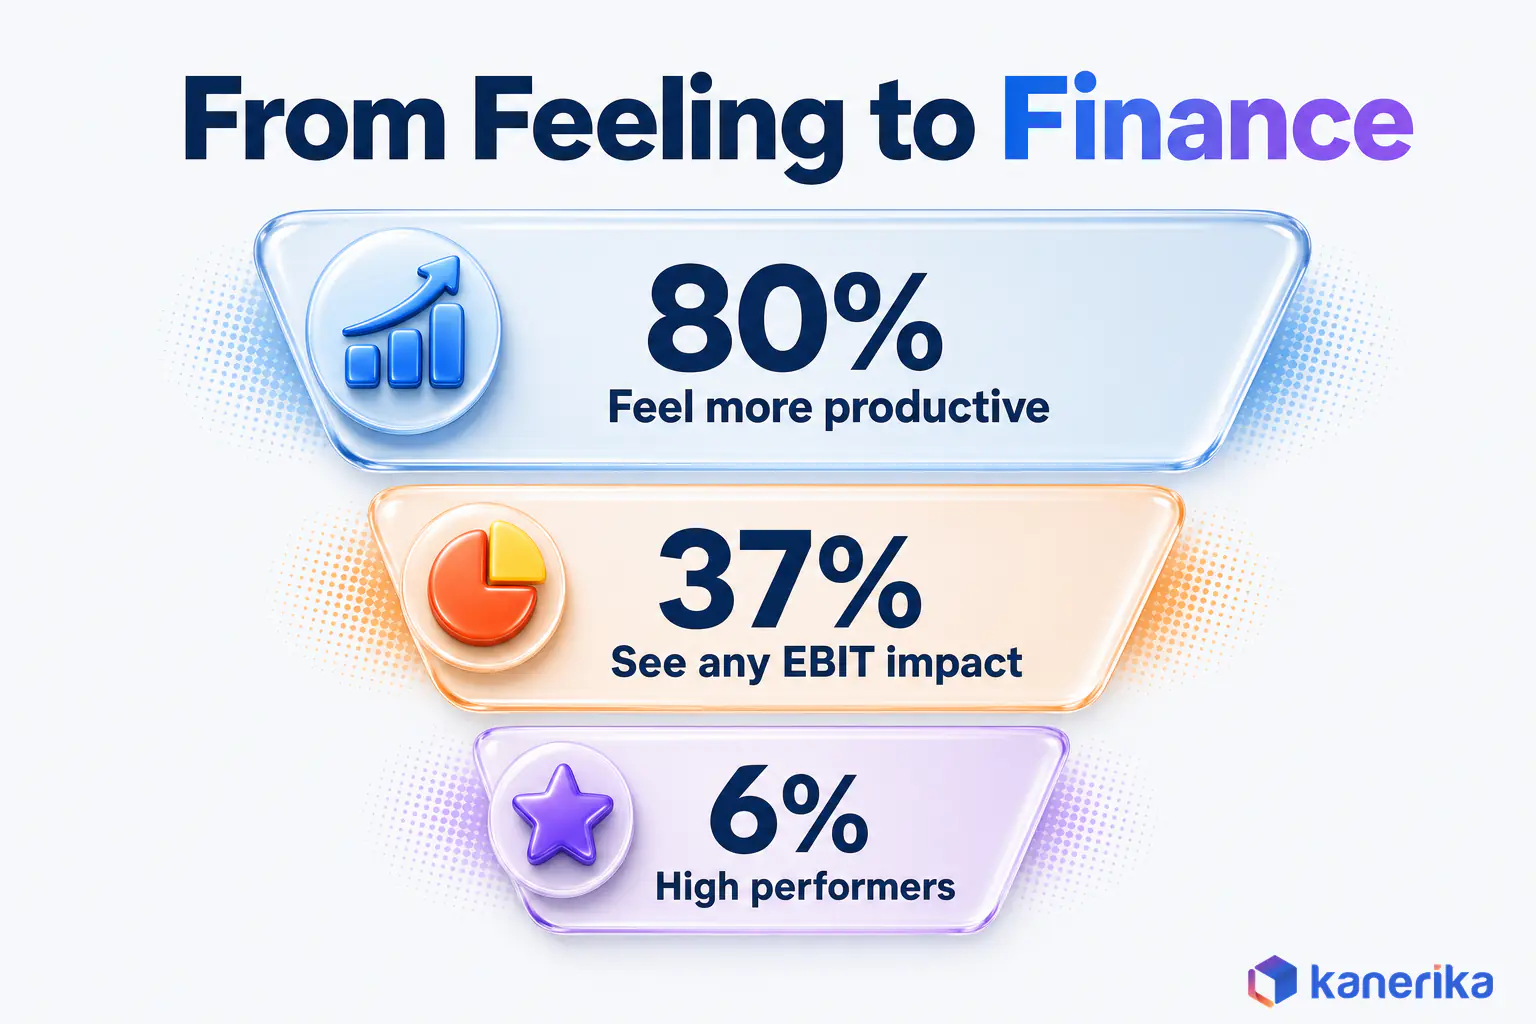
McKinsey’s 2026 State of AI survey, as reported by FM magazine, found that 37% of respondents attribute at least some EBIT impact to AI. Only about 6% qualify as high performers, meaning they attribute at least 5% of EBIT to AI and describe its impact as significant.
Scale is still improving. The same 2026 survey found 44% of respondents scaling AI across the enterprise, up from 38% a year earlier. Among organizations with at least $1 billion in revenue, 54% are scaling.
Perception, though, runs well ahead of profit. In the same McKinsey survey, 80% of respondents said AI improved individual productivity. That is more than double the share reporting any EBIT impact.
The steps that turn felt productivity into earnings are covered in measuring generative AI ROI, from baselines to attribution.
Productivity, Self-Reported and Measured
Self-reported gains are useful, but controlled studies carry more weight. One NBER study followed 5,179 customer-support agents and appeared in the Quarterly Journal of Economics in 2025. With a generative AI assistant, issues resolved per hour rose 14% on average, while novice workers gained 34%.
These two kinds of figure measure different things. The 80% from the same McKinsey survey is a share of people who feel more productive. The 14% in the NBER study, by contrast, is a measured change in output.
Even the measured gain was uneven. It was concentrated among novice and low-skilled agents, with minimal impact on experienced and highly skilled ones, per the same NBER paper. So a business case should model the gain per role and experience level, not one average.
Value to Consumers
Outside the firm, the value is already large. The Stanford AI Index 2026 values generative AI tools at $172 billion a year to US consumers by early 2026. The same report finds the median value per user tripled between 2025 and 2026.
Much of that value comes from tools people use for free, and staff bring the same tools to work. When those tools are unapproved, they become the shadow AI whose breach costs appear in the risk section below. For how marketing teams apply them, see generative AI for marketing.
Workforce and Jobs: What the Data Shows
Jobs are where generative AI statistics meet careers, and the data shows workers moving faster than hiring plans. About 41% of US workers used generative AI for work in November 2025, per the Federal Reserve. The measured gains favor newer staff, since novice support agents resolved 34% more issues per hour in the NBER study published in 2025.
The job effects show up first at the entry level. Employment for software developers aged 22 to 25 has fallen nearly 20% from 2024, according to the Stanford AI Index 2026 economy chapter. One-third of organizations expect AI to reduce their workforce in the coming year, while almost half expect little to no change, per the same chapter.
Large-scale job losses have not yet shown up in overall employment data, the AI Index adds. For the skills side of the picture, see Kanerika’s guide to the AI talent shortage.
Generative AI Agent Statistics
AI agents, systems that plan and carry out multi-step tasks, are the biggest change in the 2026 data. They extend generative AI from answering questions to doing work, so their adoption and reliability figures feed straight into business impact.
Large companies are moving first. The same McKinsey survey found 40% of large companies scaling AI agents in at least one function. Large here means at least $1 billion in revenue. The prior-year figure was 27%, while smaller organizations stayed flat at 22%.
Capability has also jumped. On the OSWorld benchmark of real computer tasks, agent success rose from 12% to about 66%, according to the Stanford AI Index 2026. The same report notes that agents still fail roughly 1 in 3 attempts on structured benchmarks.
| Agent signal | Figure | Source and year |
|---|
| Large companies ($1 billion+ revenue) scaling AI agents | 40%, up from 27% | McKinsey, as reported by FM magazine, 2026 |
| Smaller organizations (under $1 billion revenue) scaling AI agents | 22%, flat | McKinsey, as reported by FM magazine, 2026 |
| Agent success on OSWorld computer tasks | 12% to about 66% | Stanford AI Index 2026 |
A one-in-three failure rate is tolerable for drafting, but unacceptable for payments. So design agentic AI work with human checkpoints, as covered in our guides to multi-agent AI systems and AI agent evaluation.
Whether an agent or a fixed workflow fits a task is often a cost decision. The podcast below walks through one such choice.
Generative AI Risk, Trust and Governance Statistics
Risk is the brake on business impact, because every breach, wrong answer or policy gap eats into the gains above. The 2025 and 2026 figures also show that use has outrun control.
Breach Costs and the Governance Gap
The newest figures set the stakes. IBM’s 2026 report puts the average cost of a data breach at a record $4.99 million, up 12%. AI-driven attacks rose 56%, while model inversion attacks carried an average cost of $6 million.
AI also cuts the bill. Organizations using AI extensively in security, for example, saved $1.93 million per breach in the 2026 IBM report.
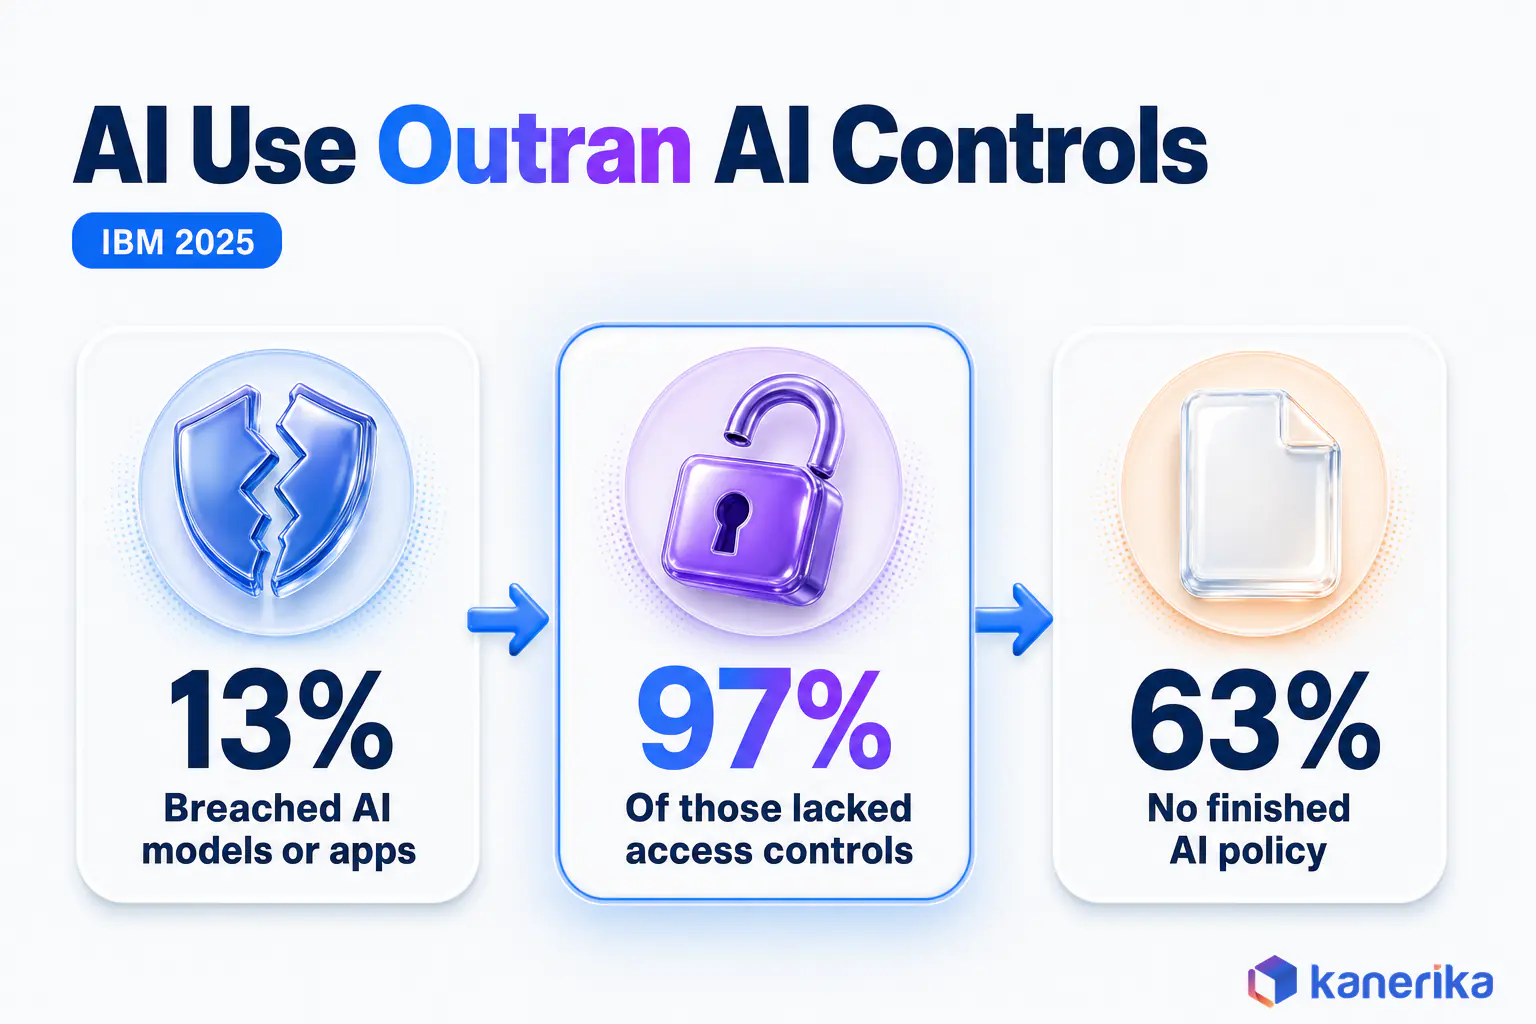
The governance gap was already visible a year earlier. IBM’s 2025 report found 13% of organizations reported breaches of AI models or applications, and 97% of those lacked proper AI access controls. In the same 2025 study, 63% of the breached organizations studied had no AI governance policy or were still developing one.
Shadow AI means staff using tools the company has not approved. In IBM’s 2025 findings, organizations with high levels of shadow AI paid $670,000 more per breach on average. One in five organizations also reported a breach tied to it, a pattern covered in Kanerika’s guide to shadow AI.
Trust in AI Output
Trust trails use in two different ways: in what the tools produce, and in what they will do to work. On output, the 2025 Stack Overflow survey found 46% of developers distrusted the accuracy of AI tools, while 33% trusted it. Only 3% highly trusted it, per the same survey.
With so few highly trusting the output, review steps stay in the workflow, and that caps the productivity gain. On work, the AI Index 2026 finds 73% of experts expect AI to improve how people do their jobs, compared to 23% of the public.
| Risk signal | Figure | Source and year |
|---|
| Average cost of a data breach | $4.99 million, up 12% | IBM, 2026 |
| Growth in AI-driven attacks | Up 56% | IBM, 2026 |
| Average cost of model inversion attacks | $6 million | IBM, 2026 |
| Savings with extensive AI in security | $1.93 million per breach | IBM, 2026 |
| Developers who distrust AI accuracy | 46% (33% trust) | Stack Overflow, 2025 |
| Expect a positive impact on jobs | 73% of experts, 23% of the public | Stanford AI Index, 2026 |
Frameworks such as AI TRiSM exist to close exactly these gaps, with controls for trust, risk and security in one model. For policy design, also see Kanerika’s AI governance best practices.
How to Use Generative AI Statistics in a Business Case
A statistic belongs in a business case only once it passes a few plain checks. The CFO from the opening scene can then put these six questions to any figure, including the ones in this guide.
Run the AI Index 2026 figure of 88% through them. It counts organizations, describes 2025 and records use. That makes it a good reason to act, while it says little about return.
- What unit is counted? Firms, workers and organizations give different answers, as shown above.
- Who was asked, and how large are they? Samples of large firms run higher than samples of every business.
- When was the data collected? A 2026 report usually describes 2025, so quote the data year, not the publish year.
- Who paid for the study? Vendor surveys are not wrong by default, but they deserve a second, independent source.
- Is it self-reported or measured? Felt productivity and counted output are different kinds of evidence, so keep them apart.
- Is it a forecast or an actual? Label forecasts clearly and never add them to measured spend.
Once a figure passes, the next step is a rollout plan. For that, see a generative AI adoption playbook and the wider AI trends shaping budgets in 2026.
Checklist
Generative AI Checklist
Turn the six checks above into a working plan: the data, governance, use-case and measurement questions to answer before a generative AI project gets budget.
Get the Checklist →
How Kanerika Turns Generative AI Adoption into Measured Results
Kanerika’s work starts where most generative AI statistics stop: at the gap between using generative AI and measuring what it changes. Every engagement begins with a baseline, so the result can be checked against the old process.
One example is a California-based dairy founded in 1901. Its sales team relied on IT for every data request, while reporting was spread across fragmented sources. Kanerika gave the team conversational access to sales data, such as revenue, unit sales and margins, through Microsoft Copilot.
The practical constraint was data access, because key sales metrics sat locked in technical systems. So the project integrated Copilot with Azure SQL for real-time data access.
The Copilot sales-data case study records three measured results:
- 90% fewer data query errors
- 30% faster decision-making
- 25% higher sales meeting efficiency
That is the pattern behind the high performers in the survey data: a narrow use case, a clear baseline and a number finance can check. Kanerika’s own delivery data points the same way. Across 414 measured outcomes from 161 anonymized engagements between 2015 and 2026, the median improvement was 47%, per Kanerika’s enterprise AI adoption report.
In the same delivery data, 30% of engagements reached 90% or above, and the leaders modernized the data foundation before building AI. The approach is simple to state: set a baseline, pick a narrow use case and build a governed data foundation first. To scope a similar project, explore our generative AI services or talk to our team.
Case Study
90% Fewer Data Query Errors with MS Copilot
A California-based dairy gave its sales team conversational access to revenue, unit sales and margin data through Microsoft Copilot, cutting data query errors by 90%, speeding decisions by 30% and lifting sales meeting efficiency by 25%.
Read the Case Study →
What the 2026 Generative AI Statistics Mean for Your Business
Adoption is wide, but it is not universal. The Stanford AI Index 2026 found AI of any kind in use at 88% of organizations in 2025. Among individuals, about 41% of US workers used generative AI for work in November 2025, per the Federal Reserve.
Business counts tell a slower story. Only 37% of US firms with 250 or more employees used AI in the Census Bureau data from December 2025 to May 2026. For the companies that have adopted, the real question is value.
Back at the CFO’s desk, both reports were right, and neither one settles the business case on its own. So how widely is generative AI adopted in 2026, and what is its business impact? Generative AI is widely adopted by organizations and workers, unevenly across businesses, and its measured business impact is still concentrated in a minority.
Frequently Asked Questions
What are the latest generative AI statistics?
The latest generative AI statistics show wide adoption and narrower impact. The Stanford AI Index 2026 puts organizational AI adoption at 88% for 2025. Enterprises spent $37 billion on generative AI in 2025, according to Menlo Ventures. McKinsey’s 2026 survey, as reported by FM magazine, finds 37% of respondents see some EBIT impact and about 6% are high performers.
What is the growth rate of generative AI?
Organizational AI adoption grew from 55% in 2023 to 78% in 2024 and 88% in 2025, according to the Stanford AI Index. Spending grew faster. Menlo Ventures estimates enterprise generative AI spend rose from $11.5 billion in 2024 to $37 billion in 2025, a 3.2-fold increase in one year. Both measures point the same way.
Why do generative AI adoption statistics differ so much?
They count different units. Organization surveys mark a company as an adopter if AI is used anywhere, worker surveys count individuals, and business surveys count every firm once regardless of size. Firm size, question wording and self-reporting add more spread, which is why about 18% of US firms and 88% of organizations can both be correct figures.
What are the biggest risks of generative AI adoption?
Security and governance gaps lead the list. IBM’s 2025 study found 13% of organizations had breaches of AI models or applications, and 97% of those lacked proper AI access controls. IBM’s 2026 report puts the average breach at a record $4.99 million, and organizations with high levels of shadow AI paid $670,000 more per breach on average in 2025.
How many companies are using AI agents?
Agent adoption is growing fastest in large firms. McKinsey’s 2026 survey, as reported by FM magazine, found 40% of companies with at least $1 billion in revenue scaling AI agents in at least one function, up from 27%, while smaller organizations stayed flat at 22%. Agents still fail roughly 1 in 3 structured benchmark attempts, per the Stanford AI Index.
Which countries have the highest generative AI adoption?
The Stanford AI Index 2026 reports that generative AI reached 53% population adoption within three years. Adoption correlates strongly with GDP per capita, but some countries beat what their income predicts, such as the United Arab Emirates at 64% and Singapore at 61%. The United States, by contrast, ranks 24th at 28.3%.
What is the accuracy rate of generative AI?
No single accuracy rate exists, because accuracy depends on the task. The Stanford AI Index 2026 reports that the top model reads analog clocks correctly only 50.1% of the time, while AI agents fail roughly 1 in 3 attempts on structured benchmarks. In the 2025 Stack Overflow survey, 46% of developers distrusted AI accuracy and 33% trusted it.
Will 90% of online content be AI generated by 2026?
No primary measurement supports that claim. The figure circulates widely, but none of the 2026 sources in this guide, including the Stanford AI Index, the Census Bureau and the Federal Reserve, measures the share of online content created by AI. Treat it as a prediction without evidence, and rely on dated, sourced adoption and spending figures instead.
Where are enterprises investing in generative AI in 2026?
Most enterprise money goes to applications that people use directly. Menlo Ventures found that $19 billion of the $37 billion enterprises spent on generative AI in 2025 went to applications, and 76% of AI solutions were bought rather than built. Gartner, as reported by iTWire, forecasts $2.52 trillion in total AI spending for 2026.
What percentage of companies use generative AI in 2026?
Most surveys count AI of any kind. The Stanford AI Index 2026 puts organizational AI adoption at 88% for 2025, and the US Census Bureau found 17% to 20% of US businesses used AI from December 2025 to May 2026. For generative AI specifically, the Federal Reserve reports 54% of the labor force at LLM-using firms in November 2025.
How many US businesses use AI?
About one in five. The US Census Bureau’s Business Trends and Outlook Survey put the national rate at 19.8% as of May 3, 2026, and between 20% and 23% of businesses expected to use AI within six months. Rates were highest in the Information sector at 39.7% and in Finance and Insurance at 33.9%.
What is the ROI of generative AI for enterprises?
Returns are real but concentrated. McKinsey’s 2026 State of AI survey, as reported by FM magazine, found 37% of respondents attribute at least some EBIT impact to AI, while only about 6% are high performers that attribute 5% or more of EBIT to AI. Measured ROI depends on baselines set before a project starts.
How much does generative AI improve productivity?
Controlled research shows real but uneven gains. A 2025 Quarterly Journal of Economics study of 5,179 support agents found a generative AI assistant raised issues resolved per hour by 14% on average and by 34% for novice workers. Self-reported figures run higher: 80% of respondents in McKinsey’s 2026 survey, as reported by FM magazine, said AI improved their productivity.
How much are companies spending on generative AI?
Menlo Ventures estimates enterprises spent $37 billion on generative AI in 2025, up from $11.5 billion in 2024. Investor money is larger, since US private AI investment reached $285.9 billion in 2025, according to the Stanford AI Index 2026. Gartner forecasts total AI spending of $2.52 trillion in 2026, as reported by iTWire, covering far more than generative AI.