

Crystal Reports to DevExpress Migration, Accelerated by FLIP
Crystal Reports has carried invoices, bills, and operational documents for years, but licence costs, slow performance, and dated tooling keep growing. Kanerika's FLIP accelerator converts RPT files into DevExpress reports, keeping layouts, parameters, formulas, and data bindings intact across your entire report inventory, with every output checked against the original.
Get Started with Crystal Reports to DevExpress Migration
The Price of Staying on Crystal
What Keeping Crystal Reports Is Quietly Costing You

80%
Of IT budgets go to keeping legacy systems running.

44%
Of CIOs call legacy platforms a growth barrier.

50%
Of developer time is lost to outdated tooling.

70%
Of digital transformations stall because of legacy systems.
Migrate from

with Our Accelerator
Built for Crystal Reports and DevExpress

Watch Crystal Reports Convert to DevExpress Step by Step
See how FLIP takes an uploaded RPT file, maps its layout, parameters, and formulas, and returns a DevExpress REPX report that opens and looks like the original.
What a Crystal Reports to DevExpress Migration Actually Covers
Moving to DevExpress is more than converting files. Invoices, receipts, and lab reports must stay precise, so every layout, field, and parameter is mapped and checked against the Crystal original.

Layouts and Report Design
Pixel-accurate pages, grouping, headers, footers, and subreports are rebuilt in DevExpress so printed and shared documents look the way users expect.

Data Fields and Formulas
Every field is mapped one to one, while formulas, running totals, and conditional formatting carry into DevExpress with parity checks against the source output.

Parameters and Filters
Prompts, cascading parameters, and filter behaviour are reproduced, so users get the same results from the same inputs after the move to DevExpress.

Branding and Central Themes
Logos embedded inside every report give way to a single shared theme with database-driven branding; a logo change never touches individual files.
The Crystal to DevExpress Advantage
Why Enterprises Choose DevExpress Over Crystal Reports

Interactive Reporting
- Embed reports in web and desktop applications with a built-in viewer
- Filter, sort, and drill into data inside the viewer
- Export to PDF, Excel, and Word from one report definition

Scalable Delivery
- Run reports inside your application under your own security model
- Scale report delivery alongside your application and its infrastructure
- Apply your existing sign-in and role-based access rules to every report

Easier Maintenance
- Edit layouts in a visual designer instead of legacy files
- Reuse one theme for branding across every report
- Let business users tweak reports in a browser-based designer

Lower Licensing Cost
- Trade Crystal Server and runtime fees for one DevExpress licence
- Retire a separate reporting server to patch
- Build on the .NET skills your developers already have in-house
Our Conversion Workflow
What FLIP Saves with Automated Crystal Reports to DevExpress Migration
Report Intake and Complexity Assessment
FLIP reads each uploaded RPT file, scores its complexity, and records layouts, formulas, parameters, subreports, and data sources in a single migration inventory.


Reusable Mapping and Conversion Patterns
Mapping templates translate Crystal layouts, formulas, and parameters into DevExpress equivalents, so effort from every report is reused on the next one.

Edge Cases and Branding Integration
Complex reports follow the same conversion path as simple ones, while embedded logos are swapped for centralised, database-driven branding across the library.

Validation, Handover and Sign-Off
Each REPX output is checked against its Crystal original for data, layout, and parameter parity, then delivered with full documentation and team knowledge transfer.

WHAT FLIP SAVES YOU
How FLIP Converts Effort into Savings on Every DevExpress Migration
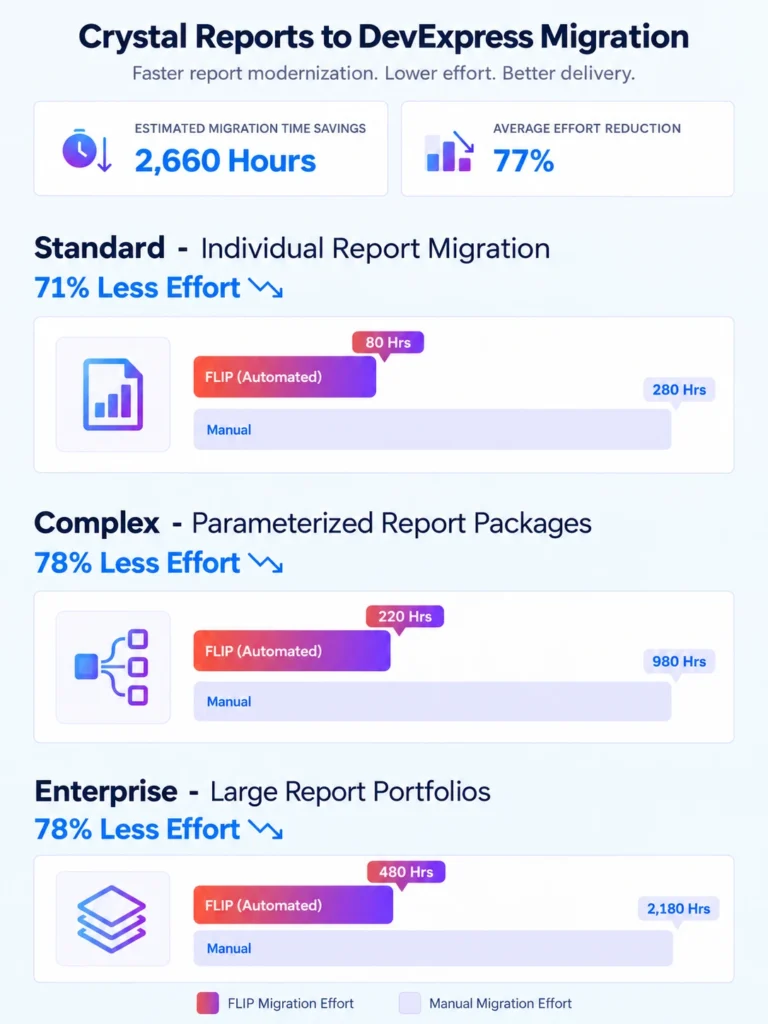
FLIP reduces effort at every scale, from a single report to a full portfolio. The figures below compare estimated hours with FLIP against a manual rebuild, so engineers spend time validating instead of recreating reports.

ESTIMATED TIME SAVINGS

Average effort reduction
Standard - Individual Report Migration with Static Tables
Less Effort

Complex - Parameterized Report Packages
Less Effort
Enterprise - Large Report Portfolios
Less Effort

Case studies
Proven Results from FLIP-Led Reporting Migrations to DevExpress
These FLIP-led reporting migrations show the consistent output, faster timelines, and reduced manual effort that accelerator-driven conversion delivers for engineering teams and report owners.
Migration
60% Faster Migration: Crystal Reports to Power BI
Impact:
- 60% Faster Migration
- 10x Data Scale
- 99.5% Refresh Success Rate
Migration
60% Faster Analytics with Informatica to Alteryx
Impact:
- 45% Faster Reporting Cycles
- 38% Reduction in Maintenance Costs
- 60% Improved Analytics Turnaround
Migration
74% Faster Retail Reporting with Microsoft Fabric
Impact:
- 74% Faster Reporting Cycles
- 65% Increase in Reporting Stability
- 72% Faster Access to Current Metrics
Frequently Asked Questions (FAQs)
What do Crystal Reports to DevExpress migration services include?
Kanerika’s migration covers four stages: intake and complexity assessment, conversion with reusable mapping patterns, edge-case and branding handling, and validation against the original output. FLIP automates the conversion and produces REPX files that open directly in DevExpress. Your team reviews each report, compares it with the Crystal version, and signs off before anything is retired. Manual work is limited to the edge cases flagged during assessment. A managed process.
How long does Crystal Reports to DevExpress migration take?
Timeline depends on report count and complexity. A standard individual report migration takes around 80 hours with FLIP versus 280 manually. Parameterized report packages take about 220 hours versus 980, and large portfolios around 480 hours versus 2,180. Kanerika assesses your inventory first, so you receive a scoped estimate and schedule before committing to the full programme of work. Waves are planned. Teams on other reporting platforms can also see our SSRS to Power BI and Cognos to Power BI migration services.
How much does it cost to migrate from Crystal Reports to DevExpress?
Cost depends on report volume, complexity, and how many layouts need manual refinement. FLIP typically reduces effort by 71% for standard reports and 78% for parameterized packages and large portfolios, which lowers labour cost directly. DevExpress licensing is a separate line item that Kanerika helps you size. Pricing follows a report inventory, and timing follows SAP’s support schedule for your Crystal Reports version, so you can plan the spend against real deadlines and budgets.
Why choose DevExpress instead of Power BI to replace Crystal Reports?
DevExpress suits document-style reporting such as invoices, receipts, and prescriptions that live inside your own application and need pixel-accurate output. Power BI suits interactive analytics dashboards. Many organisations use both, moving document reports to DevExpress and analytical reports to Power BI. Kanerika sorts each report during assessment so it lands on the platform that fits how it is actually used, printed, and shared. Both platforms can coexist for years.
Can DevExpress reproduce Crystal Reports layouts and formatting?
Yes. Bands, grouping, headers, footers, fonts, borders, and subreports all have DevExpress equivalents, so printed and exported documents keep the layout users know. FLIP maps each element, and the output is compared with the Crystal original at every stage. Anything that cannot be reproduced exactly is flagged for an engineer rather than approximated silently, so nobody discovers a difference after go-live. Kanerika documents every exception.
How are Crystal Reports formulas converted in DevExpress?
Crystal formulas, running totals, and conditional formatting are mapped to DevExpress expressions and calculated fields. FLIP converts the common patterns automatically and checks the results against the source report’s output. Unusual formulas that need a different approach are flagged during assessment, and Kanerika engineers rework them by hand, then test them again with representative data. Each formula result is signed off.
What happens to subreports and parameters during conversion?
Subreports are rebuilt as DevExpress subreports, and parameters keep their prompts, defaults, and cascading behaviour. Users supply the same inputs and receive the same results. Dynamic parameters tied to data sources are reconnected during conversion and tested with sample values before sign-off, so filtered reports behave exactly as they did in Crystal. Reviewers confirm the results for every report.
Will any data or layout be lost when we migrate from Crystal Reports?
No data is changed, because migration converts the reporting layer only and your databases stay untouched. Every converted report is checked field by field for data parity and compared visually for layout parity. Differences are logged, fixed, and retested before sign-off. Crystal Reports stays available until you approve the DevExpress version, so there is always a working fallback during the transition period. Nothing leaves your environment unreviewed.
Which data sources can DevExpress reports connect to?
DevExpress reports connect to relational databases such as SQL Server and Oracle, as well as object, JSON, and other application data sources. Existing Crystal connections are inventoried during discovery and remapped to DevExpress data sources. Because reports run inside your application, they can reuse the same connection settings and security rules, which keeps credentials and access control in one place. Tested connections are included in sign-off.
Is there a tool that automates Crystal Reports to DevExpress conversion?
Yes. FLIP includes a Crystal Reports to DevExpress pipeline: you upload an RPT file, set an optional schedule and email notification, and submit the job. When it completes, FLIP returns a zip containing the REPX report, ready to open in DevExpress. DevExpress also offers its own basic converter, but it works one report at a time and often needs manual cleanup afterwards. Kanerika engineers handle the exceptions.
Can Crystal Reports and DevExpress run in parallel during migration?
Yes. Migration runs alongside your existing Crystal Reports environment, so nothing is switched off early. Teams compare outputs side by side, and business units can move in waves at their own pace. Crystal Reports is retired only after your team signs off on the DevExpress reports, with no forced cutover. Kanerika tracks every report through the cutover.
How does the DevExpress reporting environment fit our application?
DevExpress reports are designed to be embedded in web and desktop applications, with a document viewer for users and a designer for report authors. That keeps reporting inside your own security and deployment model rather than a separate server. Kanerika configures the viewer, theme, and report storage as part of the migration, so the environment is ready for your developers.
What do we need to license for DevExpress after migrating?
DevExpress is generally licensed per developer, and reports shipped inside your application do not normally carry per-user runtime fees. The exact product tier depends on whether you need the viewer, the designer, or both. Kanerika works with your team to confirm the right subscription and compares it with your current Crystal Reports licensing, including server and runtime costs you can retire after the move. You can validate licensing before work begins and revisit it later.
What certifications does Kanerika hold for reporting migration projects?
Kanerika holds ISO 27001, ISO 27701, SOC 2, and CMMI Level 3 certifications, and migrations follow documented security and delivery processes. Report conversion runs against metadata and report definitions, so production data is not needed to migrate the layouts, and access is limited to the project team. Findings, validation results, and sign-offs are documented for audit. Every engagement follows the same controlled process.
How are scheduled and emailed Crystal Reports handled after migration?
Schedules and email distributions are inventoried during discovery. DevExpress reports are generated by your application, so schedules move to your existing job scheduler or application logic, with the same recipients, formats, and timing. Print-style documents keep their layouts, and each delivery is tested end to end before the Crystal schedule is switched off, so no invoice or statement is missed in the handover. Recipients notice no difference after migration at all.
How can I migrate Crystal Reports to DevExpress without rebuilding every report by hand?
Use an accelerator instead of recreating reports one by one. FLIP reads each RPT file, applies reusable mapping patterns, and generates a REPX report you can open directly in DevExpress. In one enterprise engagement, 73 reports spanning 36 simple, 25 medium, and 12 complex designs were migrated with about 70% of the work automated, in roughly 590 hours. Branding was centralised in a single theme, so later logo changes no longer meant editing every report, and engineers focused on edge cases and validation rather than manual rebuilding. Documentation, training, and knowledge transfer followed the handover.