
Home FLIP AP Automation ROI Calculator
AP Automation ROI Calculator
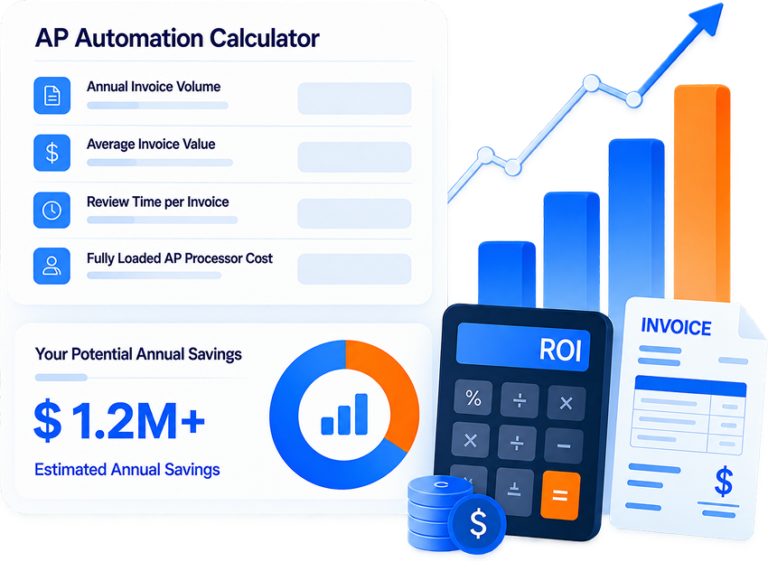
See what FLIP could save on invoice processing before you commit, based on your volume, exceptions, and current labor cost.
Calculate Your AI Strategy ROI
Quantify your return on AI investment, tailored to your industry and use case, and built on your data.
Connect the estimate to your business case
Annual AP processing cost comparison
FLIP pricing comparison
Calculation summary
| Annual invoice volume | 0 |
| Monthly page volume | 0 |
| Current annual labor cost | $0 |
| Remaining annual labor cost | $0 |
| Recommended FLIP plan | — |
| Annual FLIP plan cost | $0 |
| Net annual savings | $0 |
Confirm the AP automation estimate
Review invoice complexity, ERP integration, approval flows, and final pricing with Kanerika.
Meet an AP Automation ExpertTHE BUSINESS CASE GAP
Why AI ROI Is Difficult to Estimate Without a Strategy
Most AI conversations start with capability instead of value, and that gap is where AI pilots stall before they reach a real business case.
1
Limited ROI Visibility
Vendors quote generic percentages, and consultants often ask for a paid assessment before offering an actual estimate.
2
Weak Business Justification
Budget conversations require expected savings, a payback timeline, and a reason to prioritize one use case over another.
3
Generic Industry Benchmarks
A broad percentage ignores your actual team size, hourly cost, process volume, and expected investment.
4
Personalized ROI Estimates
This calculator uses your numbers to produce an estimate for your selected industry and use case.
What Drives AP Automation Savings
The savings figure the calculator produces comes down to four measurable factors in your current process.
Invoice and Page Volume
Your monthly invoice and page volume directly set your automation cost tier.
Exceptions and Rework
Invoices needing extra review carry hidden labor costs that compound.
Fully Loaded Labor Cost
Fully loaded hourly cost, benefits and overhead, sets your savings baseline.
Straight Through Processing
The share of invoices with zero manual touch is the biggest lever.
Who Can Benefit from AP Automation Calculator?
Built for the people who have to build and defend the business case for accounts payable automation.
AP Managers Building a Business Case
AP managers need a defensible number before pitching automation to leadership.
Finance Leaders Evaluating Vendors
Finance leaders need one consistent way to compare vendor pricing against volume
Controllers Tracking Process Efficiency
Controllers track days payable outstanding and cost per invoice as key metrics.
Proven Results From Accounts Payable Automation
Real outcomes from enterprises already running AP automation with Kanerika.
80% Less Manual Work in Travel Invoice Processing
Impact:
- 80% Less manual invoice work
- 100% Invoice lifecycle traceability
- 4x More volume, same cost
75% Less Manual Effort in Invoice Processing with FLIP
Impact:
- 75% Reduction in Manual Effort
- 90% Data Extraction Accuracy
- 55% Faster Invoice Processing
60% Faster Migration: Crystal Reports to Power BI
Impact:
- 60% Faster Migration
- 10x Data Scale
- 99.5% Refresh Success Rate
Frequently Asked Questions (FAQs)
01How is AP automation ROI calculated?
AP automation ROI is calculated by comparing your current annual labor cost for invoice processing, based on invoice volume, handling time, and hourly cost, against the cost of an automation platform plus whatever manual work remains after automation. The difference is your estimated net annual savings.
02What does AP automation typically cost per invoice?
Pricing usually scales with volume. FLIP’s published rates range from $0.23 per page at lower volumes down to $0.13 per page above 20,000 pages a month, alongside monthly ($1,500) and annual ($15,000) subscription options.
03How much time does AP automation save?
Time savings depend on your current handling time per invoice, exception rate, and volume. In one documented Kanerika deployment for a U.S. fuel distributor processing 1,000+ invoices a month from 50+ vendors, automation saved over 400 manual hours per month and cut invoice processing time by 30%.
04What is a good payback period for AP automation?
Because per page and subscription pricing is typically low relative to manual labor cost at meaningful volume, many organizations see payback in well under a year, and sometimes within the first month or two, depending on invoice volume and current labor cost.
05Does AP automation work with our existing ERP system?
FLIP connects to common ERP systems through pre-built connectors, syncing invoice and payment data in real time rather than requiring a full system replacement.
06How accurate is AI powered invoice processing?
FLIP’s document processing extracts data from PDFs, JPEGs, and scanned invoices with 95%+ accuracy, and can identify and process multiple invoices within a single file automatically. In one deployment, invoice processing accuracy increased by 35% after automation.
07What happens to invoice exceptions and mismatches?
FLIP’s reconciliation engine flags duplicates, inconsistencies, and missing fields automatically, with real time validation checks and a detailed audit trail, reducing the manual research time exceptions normally require.
08Is this calculator accurate for our specific business?
It is a planning estimate based on the inputs you provide, including invoice volume, page count, handling time, exception rate, and labor cost. It excludes setup, ERP integration work, taxes, and custom configuration, which Kanerika confirms during a scoping conversation.
09What is the difference between pay as you go, monthly, and annual pricing?
Pay as you go charges per page processed with no minimum commitment, useful for variable volume. Monthly offers unlimited processing with no annual commitment. Annual offers the lowest effective monthly cost for organizations with stable, ongoing volume.
10How do we get an exact quote instead of an estimate?
The calculator gives a planning level number. For a firm quote based on your ERP, approval workflow, and invoice complexity, Kanerika’s AP automation team scopes the engagement directly.













