TL;DR
Real-Time Intelligence in Microsoft Fabric is one workload that ingests, stores, analyzes and acts on data in motion. Eventstream brings events in, Eventhouse stores them for KQL queries, and Real-Time Dashboards show them live. Activator watches the stream and sends an email or Teams alert, or starts a flow, the moment a rule is met. Its seven benefits run from faster detection and less downtime to fewer tools to govern. It pays off wherever a late signal costs money, while a scheduled batch report stays the better choice when nobody acts within hours. Compute comes out of your Fabric capacity units and storage is billed separately, so plan Eventhouse uptime before you scale.
Key Takeaways
- Real-Time Intelligence is the Fabric workload for data in motion: it ingests, stores, analyzes, visualizes and acts on events in one place.
- Eventstream brings data in, Eventhouse stores it for KQL, Real-Time Dashboards show it, and Activator turns a condition into an alert or an action.
- Use it where a delay has a price, such as spoiled stock, a stopped line or a fraudulent payment, and keep batch reports for daily and monthly views.
- Activator evaluates stateless rules on streaming data in under a second, so the alert follows the event instead of the next refresh.
- Compute comes out of Fabric capacity units and storage is billed separately, so Eventhouse uptime is the line item to plan first.
- Prove latency and alert quality on replayed data before production, then scale to more sites and rules.
When a Cold-Chain Alert Arrives a Day Late
Picture a refrigerated trailer carrying vaccines from a distribution center to a hospital. Somewhere on the interstate, the cooling unit starts to struggle and the cargo temperature creeps past its limit. The sensor in the trailer records every reading, but nothing else happens.
The readings reach the data warehouse in the nightly load. At 7 a.m. the operations team opens its daily report and sees the spike, hours after anyone could have saved the load. By then the hospital has been told, and the team is drafting an insurance claim.
The data existed the whole time. The gap sits between the moment an event happens and the moment a person or a system acts on it.
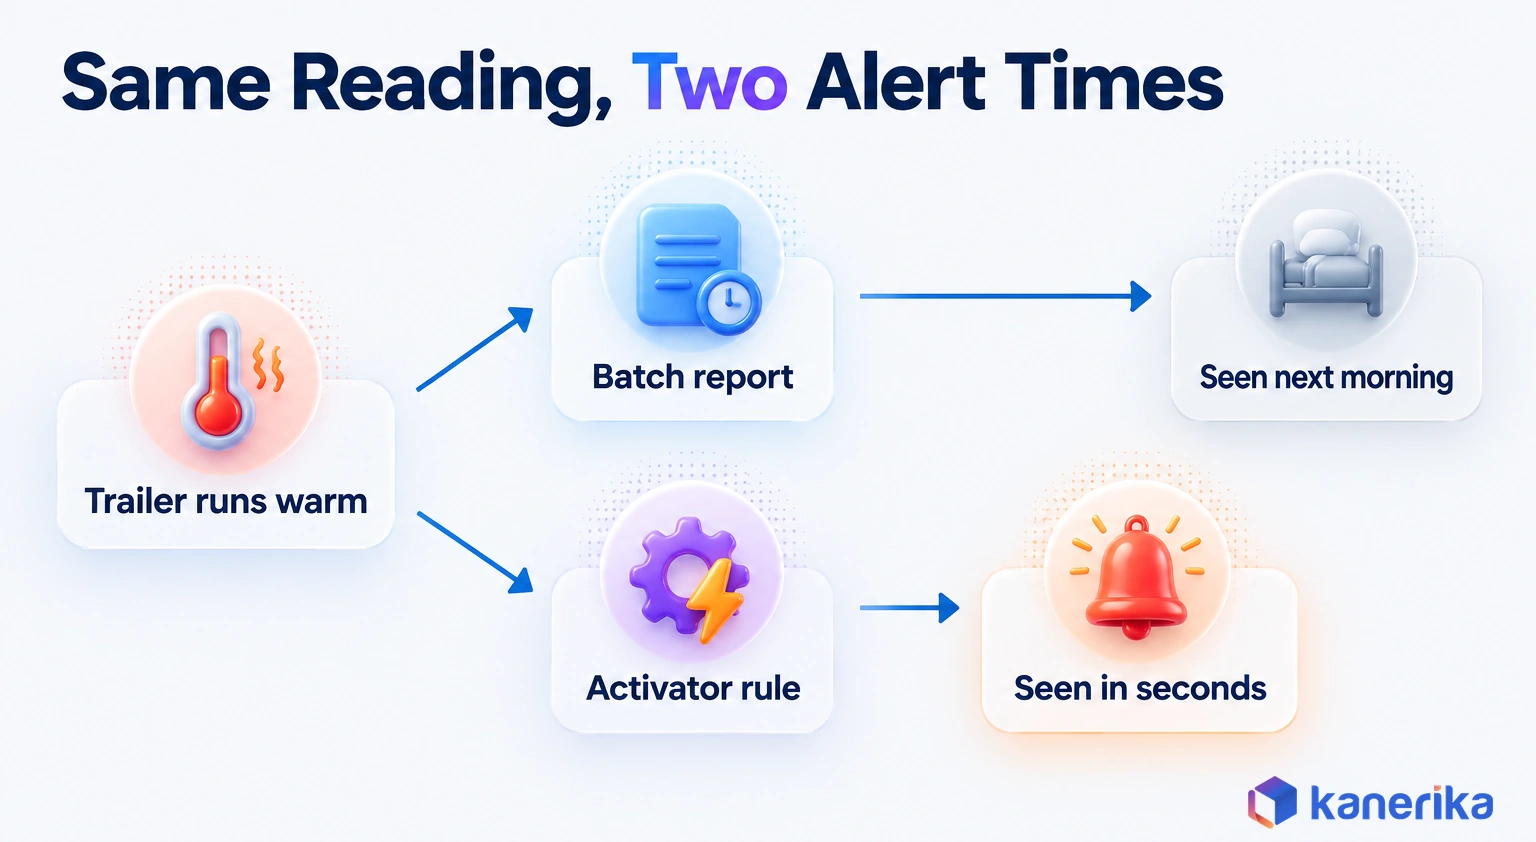
Closing that gap is the job of Real-Time Intelligence, the Microsoft Fabric workload built for data in motion. This guide explains how it works, the seven benefits it brings and where it fits. It also covers what it costs, and when a plain batch pipeline is still the smarter call.
What Is Real-Time Intelligence in Microsoft Fabric?
Real-Time Intelligence in Microsoft Fabric is an end-to-end workload for data in motion. It lets teams discover, ingest, store, analyze, visualize and act on streaming events inside one SaaS platform. Microsoft’s Real-Time Intelligence overview describes the trip as taking “seconds from data ingestion to insights.”
In plain terms, it sits beside the lakehouse, warehouse and Power BI items you may already run in Microsoft Fabric. Those items mostly answer what happened yesterday, while this workload answers what is happening now and what to do about it. It also shares OneLake, capacity and security with everything else, so live and historical data never split across two platforms.
Microsoft first showed the workload in preview at Build on May 21, 2024, in its launch announcement. It has been generally available since late 2024. Six items do the work:
| Item | Job | Who uses it |
|---|---|---|
| Real-Time hub | Catalog of every stream and event source in the tenant | Anyone looking for live data |
| Eventstream | Ingest, transform and route events without code | Data engineers, citizen developers |
| Eventhouse (KQL databases) | Store and index time-series events | Data engineers, analysts |
| KQL queryset | Write and save queries in KQL or T-SQL | Analysts, engineers |
| Real-Time Dashboard | Live tiles built on those queries | Operations teams, managers |
| Activator | Watch conditions and trigger alerts or actions | Business users, operations staff |
Fabric data agents can also reason over Eventhouse data, so a manager can ask a plain-English question about live operations. Our guide to Microsoft Fabric data agents explains how that layer works.
Real-Time Intelligence vs Real-Time Analytics vs Batch BI
These three terms get used as if they mean the same thing, but the difference decides what you build. Batch BI shows yesterday. Real-time analytics shows now, but only on a screen that someone has to watch. Real-time intelligence goes further, because it detects a condition and acts on it whether or not anyone is looking.
| Approach | Question it answers | Typical delay | What happens next |
|---|---|---|---|
| Batch BI | What happened? | Hours to a day, set by the refresh schedule | A person reads a report |
| Real-time analytics | What is happening? | Seconds | A person watches a dashboard |
| Real-time intelligence | What should happen now? | Seconds or less for the alert | A rule sends an alert or starts an action |
What Data It Handles
Anything that arrives as a stream of small, time-stamped events is a good fit. Eventstream connects to Azure and third-party sources out of the box, according to Microsoft’s list of Eventstream sources:
- IoT and device telemetry through Azure IoT Hub and Azure Event Hubs
- Change data capture (CDC) from Azure SQL Database, SQL Managed Instance, SQL Server, PostgreSQL, MySQL and Azure Cosmos DB
- Streams from Apache Kafka (self-managed, Confluent Cloud or Amazon MSK), Amazon Kinesis Data Streams and Google Cloud Pub/Sub
- Any Kafka client, through a custom endpoint
- Azure Event Grid and Service Bus messages, plus Fabric and Azure system events
Application logs and clickstreams fit too, as long as they reach one of those endpoints. On the other hand, a spreadsheet that lands once a day does not need any of this.
How Real-Time Intelligence Works in Microsoft Fabric
The workload is easiest to grasp as a short path that each event travels. A reading leaves a source, Eventstream picks it up, Eventhouse stores it, a dashboard shows it, and Activator decides whether anyone needs to act.
Take the cold-chain trailer again. Its sensor publishes to Azure IoT Hub, and Eventstream reads each message, drops malformed readings and routes the rest to an Eventhouse table. A KQL query then averages temperature per truck every five minutes. The dashboard shows the whole fleet, while Activator emails the dispatcher when any truck runs warm for ten minutes.
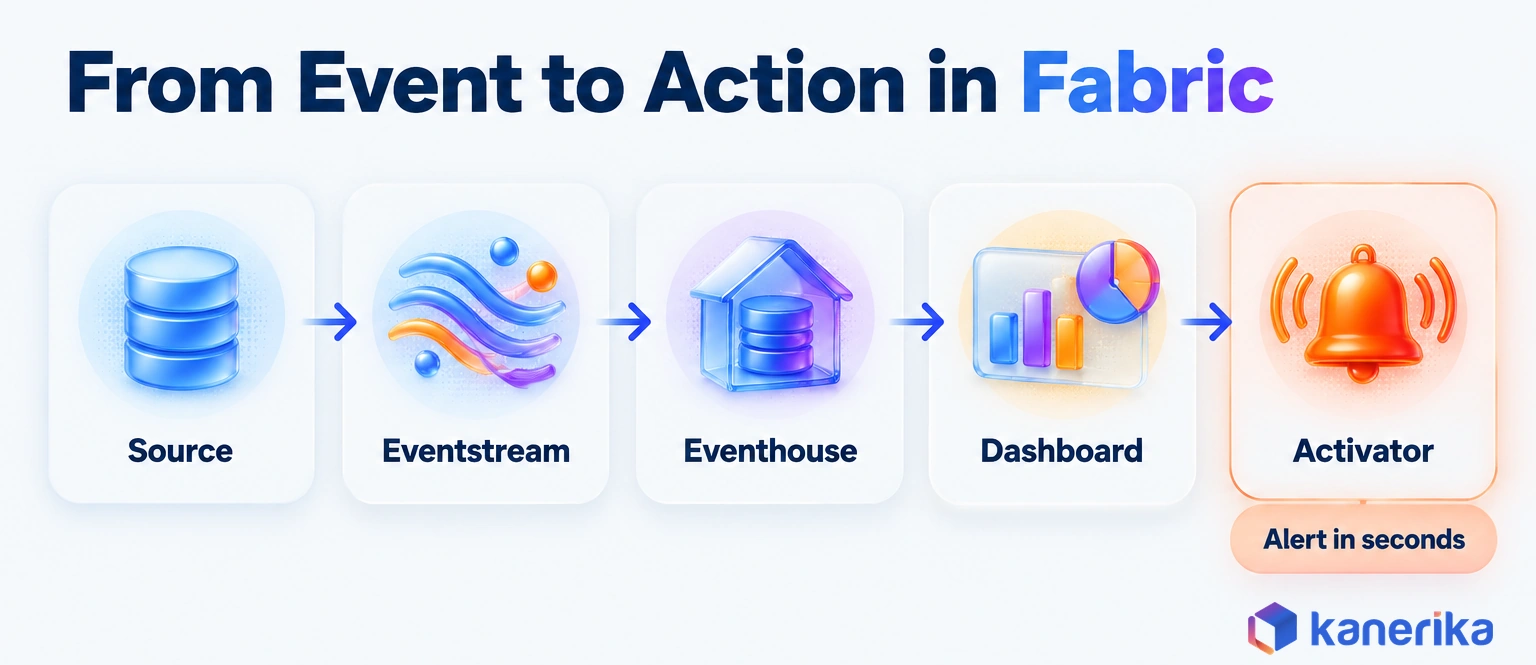
So each step is a Fabric item with one clear job. The sections below take them in the order an event meets them.
Real-Time Hub
The Real-Time hub is the catalog of every stream in your Fabric tenant. It lists the eventstreams your teams have built, the KQL tables behind them, and the Fabric and Azure events you can subscribe to. A new analyst can find the fleet telemetry stream there instead of asking around, then connect with whatever access their workspace role allows.
Eventstream
Eventstream is the no-code way to bring events in, shape them and send them on. You pick a source, add simple steps such as a filter or a field change, and choose one or more destinations.
One eventstream can feed an Eventhouse for analysis, a lakehouse for long-term storage and Activator for alerts at the same time. That fan-out matters, because the same reading often serves three teams with three different needs. It also means a source is connected once, not three times.
Eventhouse and KQL Databases
An Eventhouse is the store built for time-series events, and it holds one or more KQL databases. It indexes data as it arrives, which keeps queries over recent events responsive. Microsoft’s consumption guide says compute is available within 5 to 10 seconds, and the Eventhouse overview notes that it suspends when nobody is using it.
When you turn on OneLake availability, the same KQL data shows up in OneLake. With schema sync on, a SQL analytics endpoint can also query it in near real time. Spark notebooks, the warehouse and Power BI then read live events without a second copy. Our guide to Microsoft Fabric Eventhouse covers tables, policies and tuning in depth.
Real-Time Dashboards and KQL Querysets
A KQL queryset is where analysts write and save queries, and a Real-Time Dashboard turns those queries into live tiles. Both run on KQL, and the queryset also accepts T-SQL. Kusto Copilot drafts KQL from a plain-English question, so teams new to the language can start quickly. Our overview of Copilot in Microsoft Fabric shows how it works across items.
The query below is the cold-chain check from earlier. It averages each truck’s temperature in five-minute windows over the last hour. Then it keeps only the windows above 8°C (about 46°F), an example limit for chilled goods.
ColdChainTelemetry
| where Timestamp > ago(1h)
| summarize AvgTempC = avg(TemperatureC) by TruckId, bin(Timestamp, 5m)
| where AvgTempC > 8
| order by Timestamp desc
Pin that query to a dashboard tile and set a short refresh interval. Then the fleet view stays current without anyone running a report.
Activator
Activator is the part that acts. You point it at a stream or a dashboard tile, define a condition, and choose what happens when the condition is met.
Microsoft’s Activator introduction says stateless rules on streaming data run with subsecond latency. Actions include an email, a Teams message, a Power Automate flow or a Fabric item such as a pipeline. Rules that depend on earlier readings, such as a temperature that stays high for ten minutes, are usually the better design. One spike from an open door should not wake anyone up. The trade-off is speed, because Microsoft notes that latency for rules with aggregations depends on the lookback window. A ten-minute rule therefore fires minutes after the drift starts, not within a second.
Kanerika Service
Microsoft Fabric Consulting
Kanerika, a Microsoft Fabric Featured Partner, designs and builds Fabric workloads end to end, from Eventstream ingestion and Eventhouse design to Activator rules and capacity planning.
Explore Fabric ServicesWhat Is Still in Preview
Several newer items are still in preview, so treat them as pilots rather than production dependencies:
- Digital twin builder (preview), for modeling physical assets over live data
- Operations agent (preview), an AI agent that monitors live data and suggests actions
- Schema registry (preview), so producers and consumers agree on event fields
- Anomaly detection events (preview), which surface unusual patterns as events
Microsoft also updates this workload often. Our roundup of Fabric AI, security and Real-Time Intelligence updates tracks the latest changes.
7 Benefits of Real-Time Intelligence in Microsoft Fabric
Every benefit below comes from one change: the decision moves from the report to the event. Each one names the outcome, the Fabric item behind it and a concrete case. How large each gain is depends on your data and processes, so measure it in a pilot instead of trusting a vendor average.
1. Faster Detection and Response
An Activator rule fires when the event arrives, not when the next refresh runs. In the cold-chain case, the dispatcher hears about the warm trailer while it is still on the road. That leaves time to reroute it to the nearest depot or send a technician.
A batch report, by contrast, would have shown the same reading the next morning, after the vaccines were lost. Speed here is not a vanity metric, since it decides whether the load is saved.
2. Less Unplanned Downtime
Machines usually drift before they fail. Vibration rises, a motor draws more current, or a pressure reading starts to wobble. Streaming those signals into an Eventhouse lets a rule catch the drift early, so maintenance becomes a planned visit instead of an emergency shutdown. The Kanerika demo below applies the same idea to predictive maintenance.
3. One View of Operations Across Sites
Plants, warehouses and stores often run separate monitoring tools, so nobody can compare them. With the Real-Time hub as the catalog and one Real-Time Dashboard on top, a regional manager sees every site on the same screen. The data stays in OneLake, so the view does not depend on a nightly consolidation job.
4. Less Manual Monitoring
Many operations teams still assign people to watch screens for red numbers. Rules do that watching around the clock and never get tired. Staff then work on the exceptions an alert surfaces, which is a better use of skilled time.
The shift also changes how a team scales. Adding a new site means adding rules and a data source, not another person on the night shift.
5. Earlier Fraud and Anomaly Detection
Fraud shows up as a pattern across a sequence of events. For example, think of many card payments from new devices within a few minutes, or one account logging in from two countries an hour apart. KQL has built-in time-series functions such as series_decompose_anomalies() that run over the live table. A rule on the result can then hold a payment for review before it settles.
6. Decisions With Live and Historical Context
A live reading means more when you see it next to its history. The Eventhouse keeps past events, and OneLake availability also exposes them to Spark, SQL and Power BI. An analyst can then compare tonight’s temperature curve with the last 90 days on the same route, using one copy of the data. Nobody has to export the history into a separate tool first.
7. Fewer Tools to Run and Govern
Before Fabric, a streaming stack in Azure meant stitching together separate services for ingestion, storage, querying and alerting. Each also had its own billing and access model. Fabric runs the whole flow as one SaaS workload on one capacity, under the same OneLake security and Microsoft Purview controls as everything else. So there are fewer places for a permission or a cost to slip.
Real-Time Intelligence Use Cases by Industry
Streaming work pays off where an event has a short shelf life. If the right response an hour from now is worth much less than the right response today, the use case is a candidate. The table maps common examples to the Fabric items that handle them.
| Industry | Event source | Decision it drives | Fabric items |
|---|---|---|---|
| Manufacturing | Machine sensors through IoT Hub | Schedule maintenance before a failure | Eventstream, Eventhouse, Activator |
| Logistics and cold chain | Trailer temperature and GPS | Reroute or recover a warm load | Eventstream, Real-Time Dashboard, Activator |
| Financial services | Card and payment events through Kafka | Hold a suspicious payment for review | Eventstream, KQL anomaly functions, Activator |
| Retail | Point-of-sale and inventory CDC | Restock a store before a shelf runs empty | Eventstream (CDC), Eventhouse, Power BI |
| Healthcare | Device and bed-status feeds | Alert staff to a device or bed that needs attention | Eventstream, Real-Time Dashboard, Activator |
| Telecom | Network logs and call records | Spot an outage and open a ticket | Eventhouse, KQL queryset, Activator |
Look at the last column. Almost every row ends in Activator, because a use case with no action owner is a dashboard project, not a real-time one.
That test is worth applying before any budget is spent. If you cannot name the person who acts on the alert, start with a report and revisit streaming later.
Checklist
Microsoft Fabric Checklist
Use Kanerika’s Microsoft Fabric Checklist to plan capacity, workspaces and governance before your first real-time workload goes live.
Get the Checklist →How to Build Your First Real-Time Intelligence Workflow
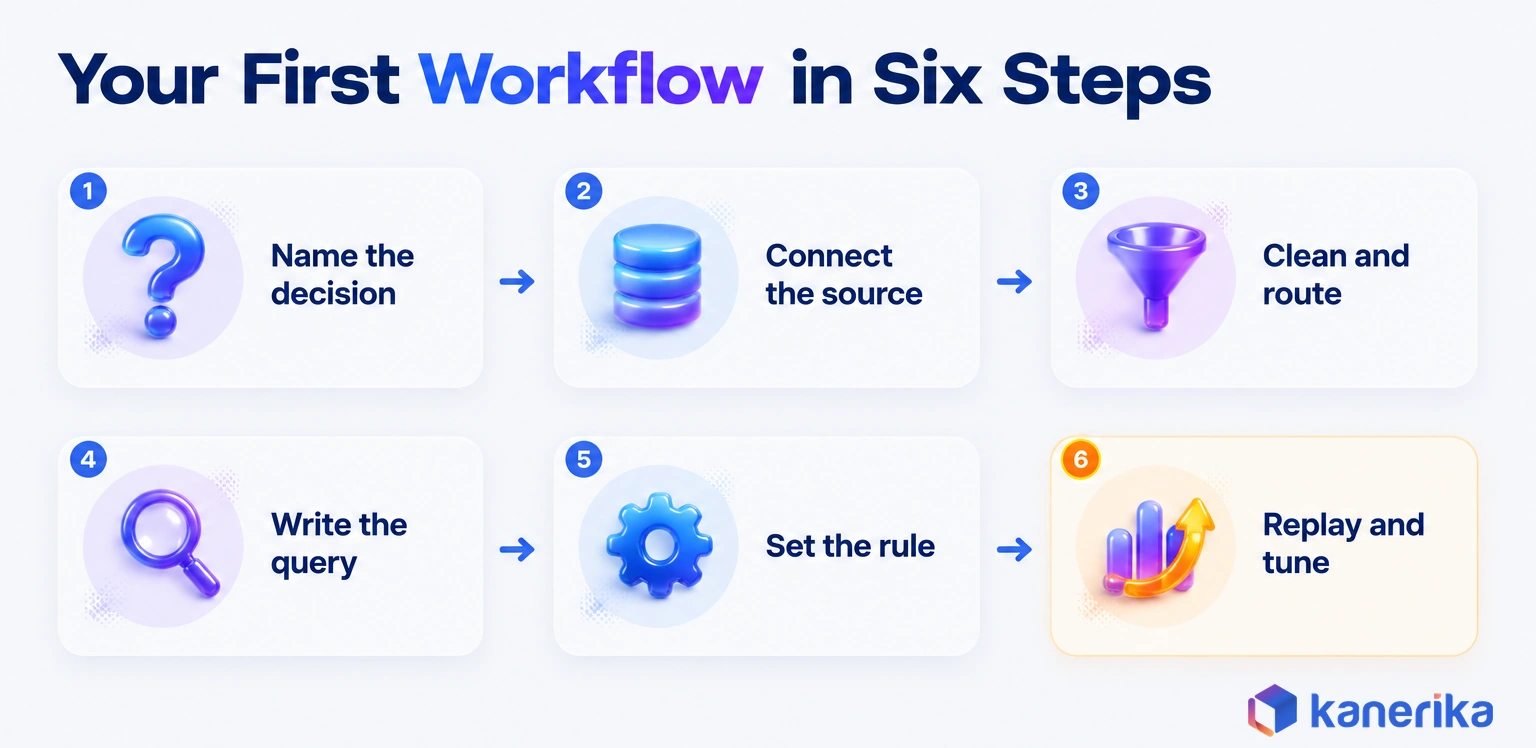
The quickest way to learn the workload is to build one narrow flow from end to end. Pick a single decision, wire it up and measure it before adding more. Here is the cold-chain example as six steps.
- Name the decision and its owner. “Alert the dispatcher when a trailer stays above 8°C for ten minutes” is specific enough to test.
- Connect the source. Create an eventstream, add Azure IoT Hub as the source, then preview a few live readings.
- Clean and route. Filter out malformed readings, keep only the fields you need and send the stream to an Eventhouse table.
- Write the query. Save the five-minute average query in a KQL queryset and pin it to a Real-Time Dashboard.
- Set the rule. Create an Activator rule with the ten-minute condition and an email or Teams action.
- Replay and tune. Run a day of recorded readings through the flow, check every alert, then switch it on for live data.
Keep the first build inside one workspace and one capacity. That keeps permissions simple and also makes the cost of the pilot easy to read on the capacity metrics.
Validate Latency and Alerts Before Production
Two numbers decide whether the pilot worked. The first is source-to-alert time, meaning how long a reading takes to reach the dispatcher’s inbox. The second is alert precision, or how many alerts pointed at a real problem.
Measure both with replayed data that includes known incidents, so you know in advance which alerts should fire. Then tune the threshold and the duration until the rule catches the real incidents without flooding the inbox. Activator also helps here: before a rule goes live, it previews how often the rule would have fired on historical data.
- Stamp each event with its source time, then compare it with the alert time
- Replay at least one day of data that contains a known incident
- Count true and false alerts per rule, and note why each false alert fired
- Agree on an acceptable source-to-alert time with the action owner
- Name who receives each alert and what they do next
If latency or the false-alert rate misses the target, fix the rule design before you add a second site.
Fabric Real-Time Intelligence vs Azure Stream Analytics, Azure Data Explorer and Custom Streaming
Teams that already stream data in Azure usually ask whether they should move. Microsoft’s own comparison of Real-Time Intelligence and Azure PaaS services says the main difference is the implementation model.
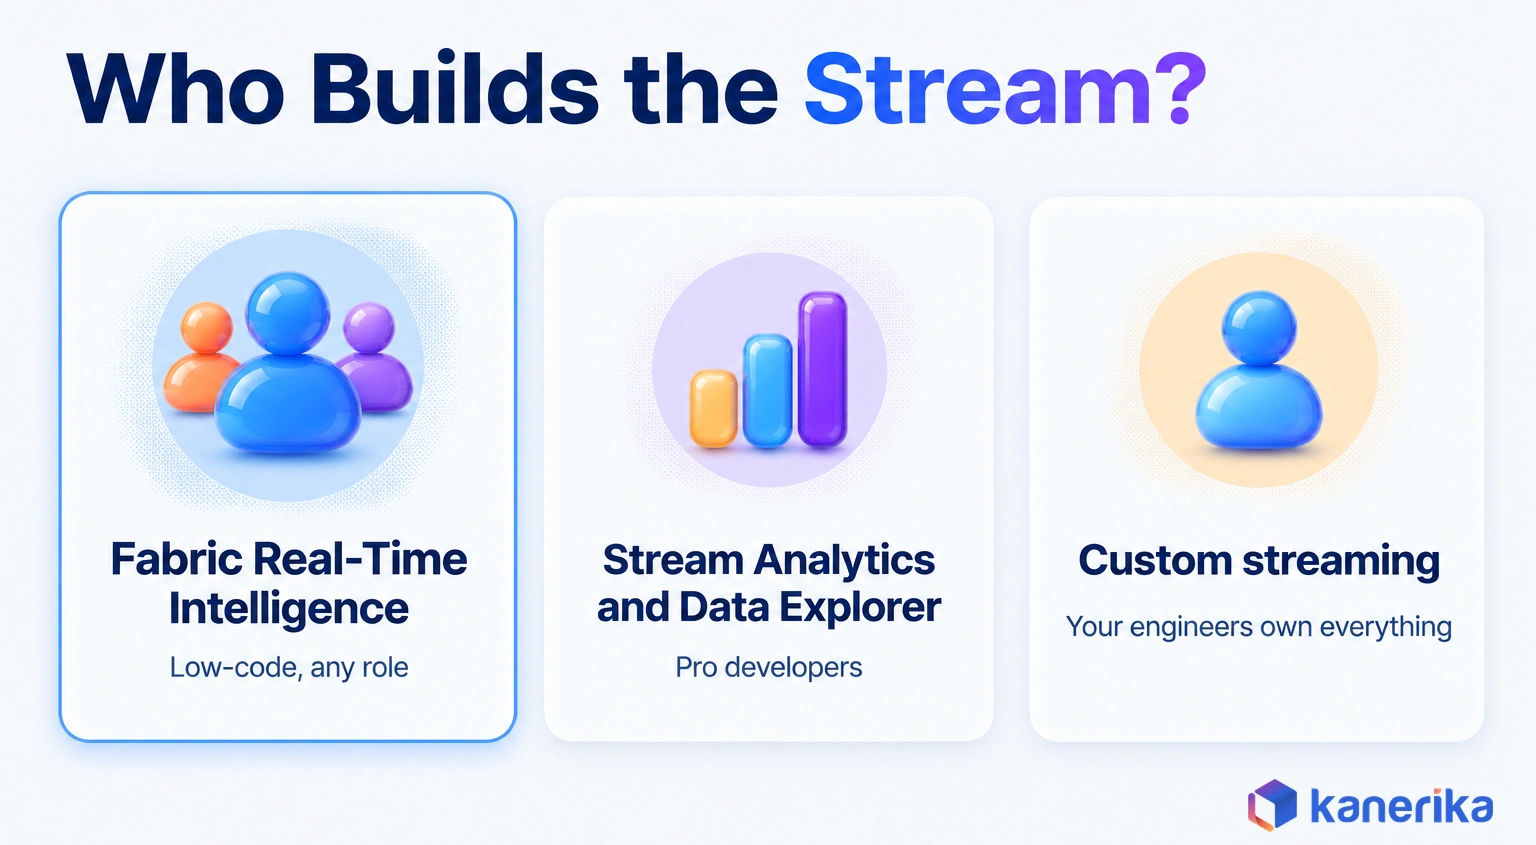
Azure Stream Analytics and Azure Data Explorer are built for professional developers. Real-Time Intelligence, in contrast, is an end-to-end, low-code experience for pro developers, citizen developers and business users alike. That framing is useful because it moves the question away from feature lists and toward who will build and run each flow.
| Option | Implementation model | Who builds it | Best fit |
|---|---|---|---|
| Fabric Real-Time Intelligence | SaaS, end to end, low-code | Pro developers, citizen developers, business users | New streaming work, teams already on Fabric |
| Azure Stream Analytics | Azure PaaS service | Pro developers | Existing jobs that already run well |
| Azure Data Explorer | Azure PaaS service | Pro developers | Existing clusters with custom tooling |
| Custom streaming (Kafka, Flink, Spark) | Self-managed code | Platform engineers | Rare protocol or latency needs a managed service cannot meet |
For an existing Stream Analytics or Data Explorer estate that works, there is no rush to move. New streaming work, or a team that wants business users writing their own rules, points toward Fabric.
Custom code still has a place at the edges. It buys full control, but your team then owns patching, scaling and on-call for every component.
When Real-Time Intelligence Is the Wrong Choice
Streaming has a cost too, in capacity, design effort and on-call attention. Skip it if the honest answer to any of these questions is no:
- Does anyone act on the data within minutes or hours, rather than at the next meeting?
- Is there a named owner for each alert?
- Does a late signal cost real money, safety or customers?
- Is the event volume too high for people to watch by hand?
When those answers come back no, a scheduled pipeline or Fabric mirroring into OneLake will serve you better and cost less. Mirroring keeps a near real-time copy of an operational database in Fabric without building a streaming flow at all.
Cost and Capacity Planning
Real-Time Intelligence has no separate license. It draws on your Fabric capacity, measured in capacity units (CUs), alongside every other workload on that capacity. Storage is the exception, however: data in OneLake cache and standard storage is billed separately from CUs.
The Eventhouse is usually the first cost to plan. Microsoft’s consumption guide explains that it is billed on Eventhouse UpTime in CUs. So an Eventhouse that stays awake around the clock costs more than one that suspends. Suspending when idle suits ad hoc use, although it adds a few seconds of delay when it wakes.
A dashboard that must answer instantly needs the opposite setting. The Eventhouse documentation describes a Capacity Planner that keeps it always active, at 100% uptime with no extra premium storage cost. You can also set a seven-day schedule in 60-minute blocks, each with a minimum capacity or none. As a result, the Eventhouse keeps a guaranteed baseline during shifts and stays elastic overnight.
Talk to Kanerika
Plan Your First Real-Time Use Case
Talk to Kanerika’s Fabric team about one decision that a late signal is costing you, and get a pilot plan with latency targets and a capacity estimate.
Talk to Our Fabric Team →Fabric capacity comes in F SKUs, and each step doubles the CUs, per Microsoft’s Fabric licensing page:
| SKU | Capacity units (CUs) |
|---|---|
| F2 | 2 |
| F4 | 4 |
| F8 | 8 |
| F16 | 16 |
| F32 | 32 |
| F64 (same CUs as Power BI Premium P1) | 64 |
| Fabric Trial | 64 |
A few controls keep the bill predictable. Run the pilot on a small F SKU, let test Eventhouses suspend overnight, and set retention so you keep only the history you query. Caching policies can also hold only recent data in the hot tier. Our guide to Microsoft Fabric capacity covers sizing and smoothing in more detail.
Governance, Security and Common Mistakes
Streams carry the same sensitive data as your tables, only faster and in larger volume. A governance gap in a real-time flow spreads in seconds, so set the rules before the first production alert goes out.
First, settle access. Workspace roles decide who can see and change eventstreams and Eventhouses. OneLake security then controls who can read the data downstream, as our guide to OneLake security in Microsoft Fabric explains. The wider policy layer sits under Microsoft Fabric governance, and warehouse-level controls are covered in our post on data warehouse security in Microsoft Fabric.
Five Mistakes in Early Real-Time Projects
With access settled, five mistakes cause most of the trouble in early real-time projects:
- Streaming personal data nobody needs. Drop or mask fields such as names and card numbers in Eventstream before they land.
- Keeping every event forever. Set retention per table to match the questions you actually ask.
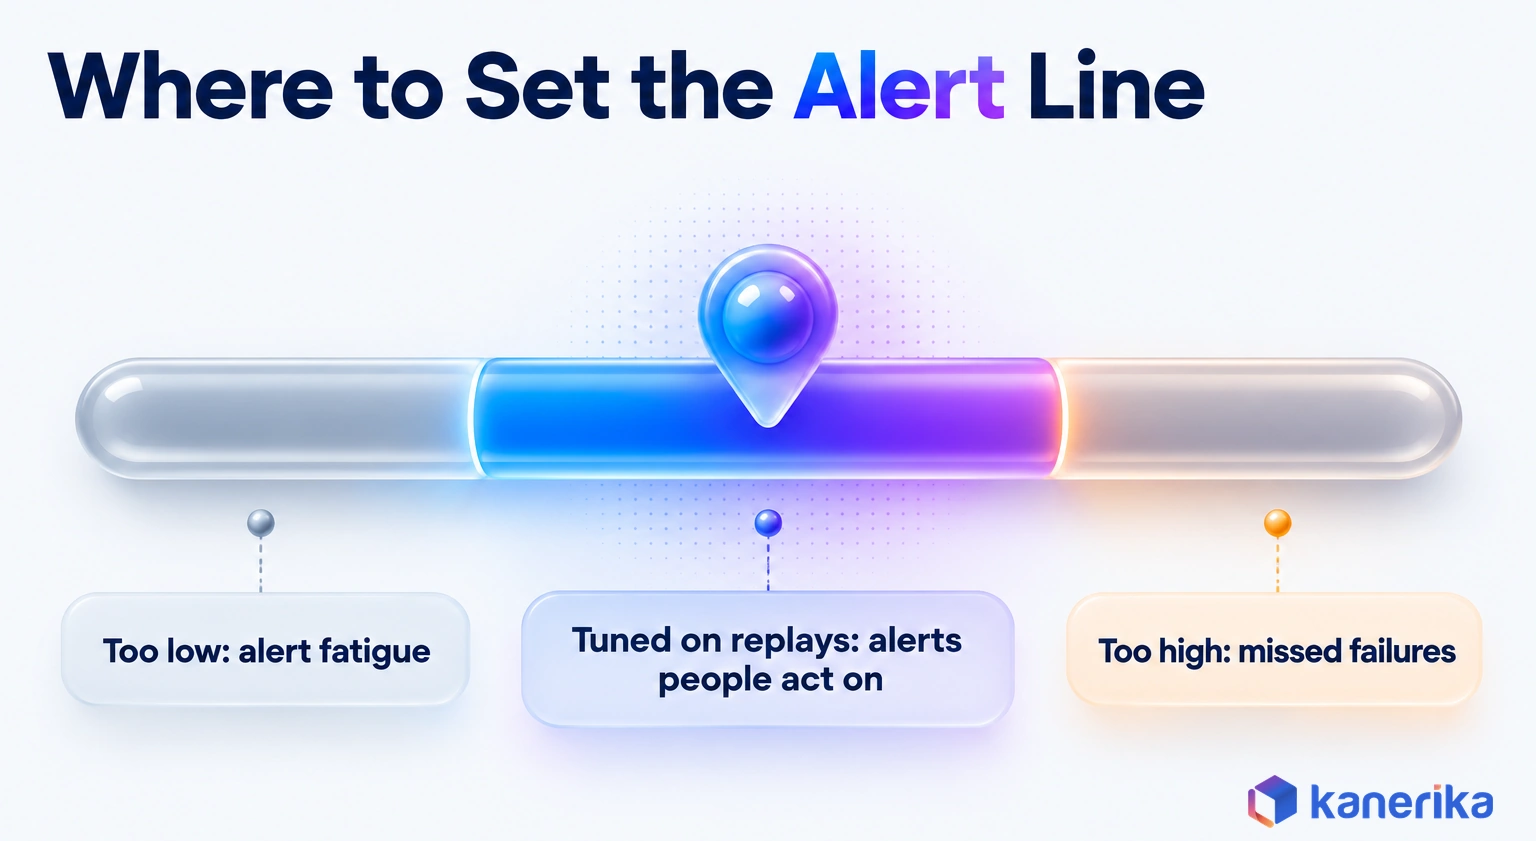
- Alert fatigue. A rule that fires dozens of times a day trains people to ignore it, so tune it on replayed data.
- Schema drift. A firmware update renames a field and the rule quietly stops firing, so watch null rates on critical fields.
- No owner. Every rule needs a named person and a written next step.
Alert fatigue deserves the most attention, because it fails silently. A threshold set too low floods the inbox until people stop reading it. One set too high, by contrast, misses the failure it was built for, and only replayed incidents show where the right line sits.
Each of these mistakes is cheap to prevent during the pilot and costly to fix after an incident.
How Kanerika Implements Real-Time Intelligence in Microsoft Fabric
Kanerika is a Microsoft Fabric Featured Partner. It is also an official delivery partner for Microsoft’s Fabric Analyst in a Day (FAIAD) and Real-Time Intelligence in a Day (RTIAD) programs. Our Microsoft Fabric consulting team runs real-time projects in four stages: Our Fabric Analyst in a Day datasheet summarizes the program.
- Use case and cost-of-delay check. We confirm that a late signal costs real money and that someone owns the action.
- Architecture. We design sources, Eventstream routing, Eventhouse tables, retention and the capacity plan.
- Pilot with measured latency. One flow, replayed data, and agreed targets for source-to-alert time and false alerts.
- Production and governance. Access, retention, monitoring and runbooks, built with our data engineering services team and handed to yours.
Real-time work also depends on operational data that is already current in Fabric. A global manufacturer running QAD ERP across several sites needed exactly that. Kanerika built an Open Mirroring connection that sends new, changed and deleted records into Fabric continuously. Each site got its own space, and every run is logged with error alerts.
The team connected 200+ QAD tables, saw 0 duplicate records on reload and resolved 7 data issues before rollout. That project kept ERP data live in Fabric. It was not an Eventstream build, but it is the foundation an alerting layer needs.
Case Study
Bringing Live QAD ERP Data into Microsoft Fabric with Open Mirroring
A global manufacturer on QAD ERP got continuous Open Mirroring into Fabric across sites: 200+ QAD tables connected, 0 duplicate records on reload and 7 data issues resolved before rollout.
Read the Case Study →Teams that want AI help on top of Fabric data can also use Kanerika’s Karl, available as a workload in Microsoft Fabric (preview). Read more in AI-powered insights with Karl on Microsoft Fabric. To scope a first use case, talk to our Fabric team.
The Bottom Line
Real-Time Intelligence in Microsoft Fabric earns its place wherever a delay has a price. Its seven benefits, from faster detection to fewer tools, all come from one design. Eventstream brings the event in, Eventhouse keeps it, and Activator then acts on it in seconds.
Start with one decision, measure source-to-alert time on replayed data, and keep batch reports for the questions that can wait. If that first rule saves one load, line or payment, the seven benefits become your business case for the next site.
Frequently Asked Questions
What is Real-Time Intelligence in Microsoft Fabric?
Real-Time Intelligence in Microsoft Fabric is an end-to-end workload for data in motion. It lets teams discover, ingest, store, analyze, visualize and act on streaming events inside one SaaS platform. Eventstream brings data in, Eventhouse stores it, Real-Time Dashboards show it and Activator triggers alerts or actions when a condition is met.
How does Real-Time Intelligence work in Microsoft Fabric?
An event moves through a short path. Eventstream ingests it from a source such as IoT Hub or Kafka, cleans it and routes it to an Eventhouse. KQL querysets and Real-Time Dashboards analyze and display it, and Activator watches for conditions and sends an email, a Teams message or a Power Automate flow.
Can Microsoft Fabric replace Azure Stream Analytics?
For new streaming work, often yes. Microsoft says the main difference is the implementation model: Stream Analytics targets professional developers, while Real-Time Intelligence is end to end and low-code for business users too. Existing Stream Analytics jobs that run well do not need an urgent move, so plan migration only when Fabric adds clear value.
When should a business use streaming instead of batch processing?
Use streaming when a late signal costs money, safety or customers, when someone will act within minutes or hours, and when volume is too high to watch by hand. Spoiled cargo, machine failure and payment fraud fit that test. Monthly reporting and low-volume data are better served by scheduled pipelines or Fabric mirroring.
How do you reduce false alerts in real-time monitoring?
Tune rules on replayed data that contains known incidents, so you know which alerts should fire. Use duration conditions, such as a temperature that stays high for ten minutes, instead of single readings. Count true and false alerts per rule, record why each false alert fired, and give every rule a named owner who reviews it.
How do you build a real-time dashboard in Microsoft Fabric?
Create an eventstream from your source and route it to an Eventhouse table. Write a KQL query in a queryset, such as a five-minute average per device, then pin it to a Real-Time Dashboard tile and set a refresh interval. Add an Activator rule on the same data so important changes trigger alerts automatically.
What types of data can Real-Time Intelligence process?
It handles any stream of small, time-stamped events. Typical sources are IoT telemetry through IoT Hub or Event Hubs, change data capture from Azure SQL, PostgreSQL, MySQL and Cosmos DB, Kafka, Amazon Kinesis and Google Pub/Sub streams, application logs, and Fabric or Azure system events. Daily file drops are better served by batch pipelines.
How is Real-Time Intelligence different from traditional analytics?
Traditional batch analytics shows what happened after a scheduled refresh, often hours later, and a person reads the report. Real-Time Intelligence works on events within seconds of arrival and can act on them through Activator rules without anyone watching. It answers what should happen now, while batch BI answers what happened yesterday.
Can non-technical teams use Real-Time Intelligence?
Yes. Microsoft positions it as a low-code experience for pro developers, citizen developers and business users. Eventstream builds ingestion without code, Copilot can draft KQL from plain-English questions, and business users can create Activator rules from a dashboard tile. Engineers still design the sources, tables and retention behind those self-service tools.
Is Real-Time Intelligence in Microsoft Fabric suitable for large-scale use?
Yes, it scales with your Fabric capacity. Eventhouse indexes high-volume time-series data as it arrives, and one eventstream can feed several destinations at once. Larger workloads need a larger F SKU and a planned Eventhouse uptime schedule, so size capacity during the pilot and watch the capacity metrics before adding more sites.
How does Real-Time Intelligence improve decision-making?
It moves decisions from the next report to the moment an event happens. A dispatcher learns about a warm trailer while it is still on the road, and a maintenance planner sees sensor drift before a machine fails. Because Eventhouse keeps history too, each live reading can be judged against weeks of past data.
How do Eventstream and Eventhouse work together?
Eventstream is the ingestion and routing layer, and Eventhouse is the storage and query layer. Eventstream reads events from a source, filters or reshapes them and sends them to an Eventhouse table. Eventhouse indexes those events for fast KQL queries, and with OneLake availability turned on, Spark, SQL and Power BI can read them too.
What does Activator do in Microsoft Fabric?
Activator watches streams and dashboard data for conditions you define, then acts. Microsoft says stateless rules on streaming data run with subsecond latency. Actions include sending an email or a Teams message, starting a Power Automate flow or running a Fabric item such as a pipeline. It turns a live reading into a response.
How much does Real-Time Intelligence in Microsoft Fabric cost?
There is no separate license. Compute comes out of your Fabric capacity units, which come in F SKUs from F2 upward, and OneLake storage is billed separately. Eventhouse is billed on uptime, so letting it suspend when idle lowers cost, while Capacity Planner keeps dashboards instant. Start a pilot on a small SKU.