TL;DR
QAD ERP reporting comes in three layers, and a manufacturer can use more than one at the same time. Native QAD tools cover operational lookups, formatted documents and financial statements inside the ERP. Power BI adds interactive analysis, and the simplest connection imports QAD data over OpenEdge ODBC on a schedule.
A data warehouse or Microsoft Fabric adds a separate reporting layer that keeps report queries off the ERP and joins QAD with other systems. Each step up brings more freshness and scope, along with more ownership work. The right route depends on how current the data must be, how many systems a report spans and who will maintain it.
Key Takeaways
- QAD includes browses, the Reporting Framework and the Financial Report Writer, and QAD Adaptive ERP adds Action Centers and embedded analytics.
- The Financial Report Writer handles cross-domain financial statements in a presentation currency, which covers standard statement work for finance.
- Power BI can connect to QAD through the Progress OpenEdge ODBC driver, though the generic ODBC connector imports data on a schedule.
- A data warehouse or Microsoft Fabric moves report queries off the ERP database and lets QAD data sit next to MES, CRM and quality data.
- External reports only match QAD when domain context, currency, periods and access rules are rebuilt and reconciled.
- Kanerika delivers QAD reporting on Microsoft Fabric as a service. It has already connected more than 200 QAD tables to Fabric for a global manufacturer.
Watch on YouTube
How Microsoft Fabric Improved Sales & Financial KPIs for a Leading Pharma Manufacturer
How Kanerika used Microsoft Fabric to improve sales and financial KPI reporting for a pharma manufacturer.
Built-In Analytics Meet the Month-End Export
QAD describes the analytics in QAD Adaptive ERP as “built into the application so decision-makers benefit from the first day.” For questions that live inside the ERP, that promise holds up well.
Month-end asks harder questions of an ERP system. A margin review needs QAD costs next to plant data, a consolidated view across sites and a trend line that runs back several years.
That is where QAD ERP reporting choices start to matter. Native tools, Power BI and Microsoft Fabric, can each answer part of that review, and each brings a different level of cost and ownership.
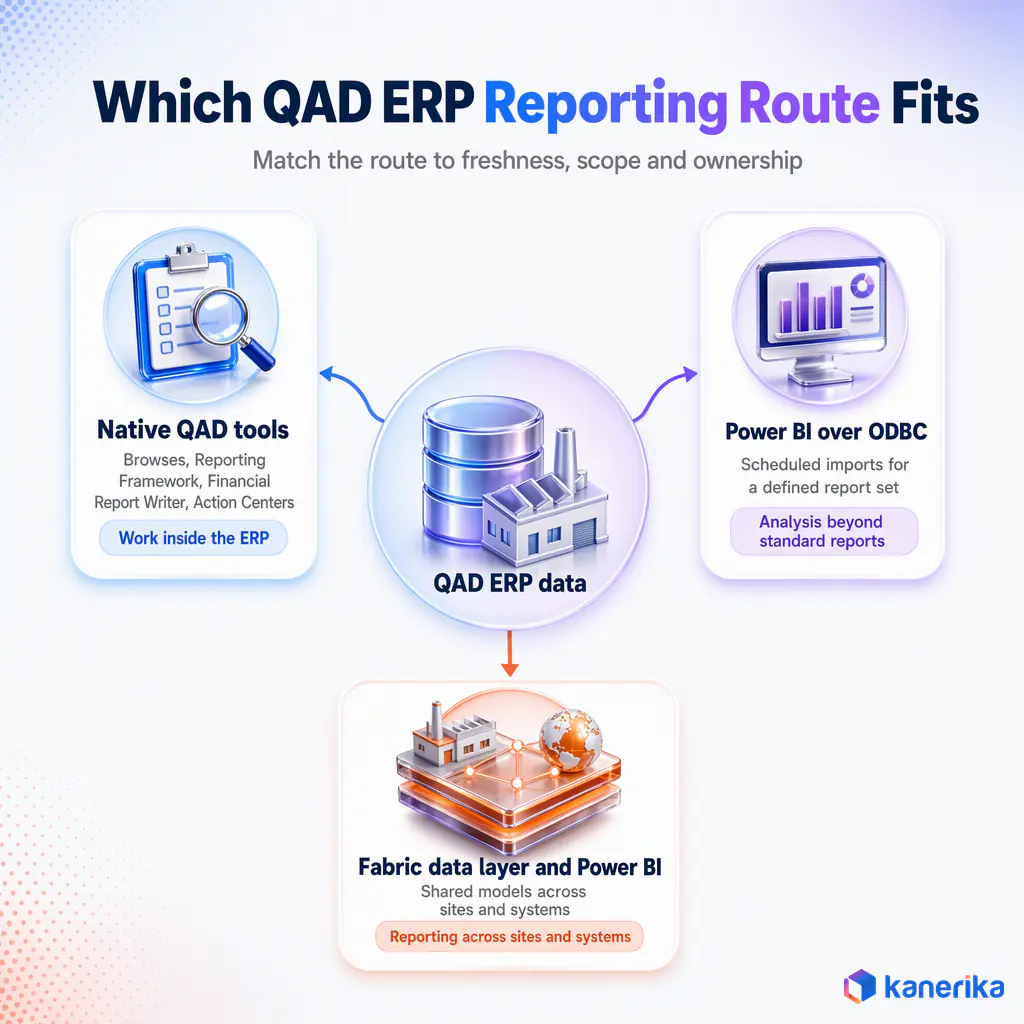
QAD reporting needs tend to fall into three groups. Each group maps to a different route, and a company can run all three side by side.
Keep Native QAD Tools for Work Inside the ERP
Operational lookups, customer documents and standard financial statements already have homes in QAD. Browses, the Reporting Framework and the Financial Report Writer serve them, so no other platform needs licensing or support.
Before adding a tool, check whether the current one already answers the question. For example, a report that only needs QAD data from one domain rarely justifies a new data platform.
Add Power BI When Analysis Goes Beyond Standard Reports
Power BI fits when users want interactive dashboards, shared measures and drill paths that cut across departments. A small team can start by importing a defined set of QAD tables.
That route works best when scheduled freshness is acceptable and the report scope stays narrow.
It also needs an owner for the gateway, the queries and the data model.
Consider Microsoft Fabric When Reporting Spans Sites and Systems
Fabric fits when reports combine many QAD domains with MES, CRM, quality or planning data, and several teams share the same models. It also gives Power BI a governed data layer to sit on.
The tradeoff is scope. A shared platform brings capacity costs, data engineering work and a team accountable for keeping it current.
What Reporting Tools Does QAD ERP Include?
QAD’s native reporting has grown over several product generations, so the exact tools depend on the edition, release and modules a company runs. The five below are the ones QAD and its partners document most often.
Browses for Operational Queries
Browses show rows of QAD data that users can filter, sort and group, with sums and counts on grouped columns. Users can also drill into fields, save criteria to favorites and set a browse to refresh every few seconds.
A browse can run within one domain or across several, and results export to Excel, PDF or CSV, according to QAD partner Logan Consulting. That makes browses the fastest way to answer a question about current transactions.
A browse is still a query, not a reusable analytical model. As a result, each export becomes a snapshot that someone has to refresh and reconcile by hand.
QAD Reporting Framework for Formatted Documents
The QAD Reporting Framework formats customer-facing documents such as invoices and sales order acknowledgments. It needs less Progress programming than older QAD releases did, as Logan Consulting describes.
The framework can also email those documents to the right customer contacts automatically. It is the natural home for output with a fixed layout.
Financial Report Writer for Financial Statements
The Financial Report Writer is the core financial reporting tool in QAD. It builds reports on report cubes that can draw from one or more domains, with dimensions such as entity, division, product line and customer group.
A background process refreshes its data as transactions post to the general ledger, which supports hourly or daily views. Budgets can load at the statement or account level for budget-to-actual reporting, per Logan Consulting’s overview of QAD financial reporting.
Action Centers and Embedded Analytics
QAD Adaptive ERP ships with predefined Action Centers, which are role-based dashboards built from data read directly from the QAD database. Teams can use the built-in KPIs or create their own with browses or the Financial Report Writer, according to QAD’s Action Centers overview.
QAD’s analytics and reporting page adds no-code updates to role-based metrics and drill-down from visual anomalies to cause. Because these features run inside the application, they work best on data that QAD holds. Kanerika’s article on AI in ERP covers where this embedded intelligence is heading.
Excel Exports and Specialist Third-Party Tools
Exporting browses to Excel remains the quickest workaround. It also creates version control and reconciliation work as files multiply across teams, which is the problem self-service analytics software sets out to solve.
Specialist tools fill part of that space. Cyberscience sells Cyberquery for QAD with a data dictionary that it says includes more than 1,500 pre-built table joins. Tools like this help with QAD’s table structure but add another product to license and learn.
Do QAD Users Need Power BI If the ERP Has Built-In Analytics?
QAD business intelligence features and Power BI answer different questions. QAD’s Action Centers and browses read QAD data in place, so they suit KPIs and exceptions that live inside the ERP. A buyer tracking late purchase orders is a typical case.
Power BI makes sense when a report combines QAD with other systems, needs years of history or serves users outside QAD. It also brings a shared semantic model, so finance and operations read the same measure definitions. A margin review that joins QAD costs with CRM pricing and plant scrap data is one example.
The two also work well together. Keep role-based KPIs in QAD where users already work, and send cross-system analysis to Power BI. Kanerika’s comparison of Microsoft Fabric and Power BI explains where each one sits.
When Is the QAD Financial Report Writer Enough for Finance?
Finance teams sometimes ask for a new dashboard tool when a better-configured Financial Report Writer would do the job. Check what FRW already covers before planning a replacement.
Cross-Domain and Multi-Currency Statements
FRW can report across domains in a presentation currency. Where domains run different account structures, it uses a chart of accounts cross-reference, as Logan’s overview of QAD financial reporting describes. Supplementary analysis codes add dimensions beyond the standard account string, per Logan Consulting.
That covers standard statements across entities. A consolidated reporting view is still different from the full consolidation process, so confirm how eliminations and adjustments are handled.
Requirements to Test Before Replacing FRW
A few finance needs push past what FRW handles well, according to Logan Consulting’s review of FRW limitations. Test each one in the installed release before deciding.
- Wide or mixed-format reports. FRW supports up to 60 columns, but reports past 16 columns typically need a developer. One column cannot show both percentages and currency amounts.
- Budget drill-down. Drilling down to cost centers or analysis codes works on actuals but stops once budget figures are added. FRW also ignores Budget Groups defined on the GL account master.
- Balancing checks. FRW has no built-in control that confirms a report balances, so finance has to build its own checks.
- Operational measures. Financial amounts next to units shipped or machine hours need data from outside the ledger.
Power BI dashboards and paginated reports cover different output needs. However, neither one removes the need for finance sign-off.
How QAD Power BI Reporting Works Through OpenEdge ODBC
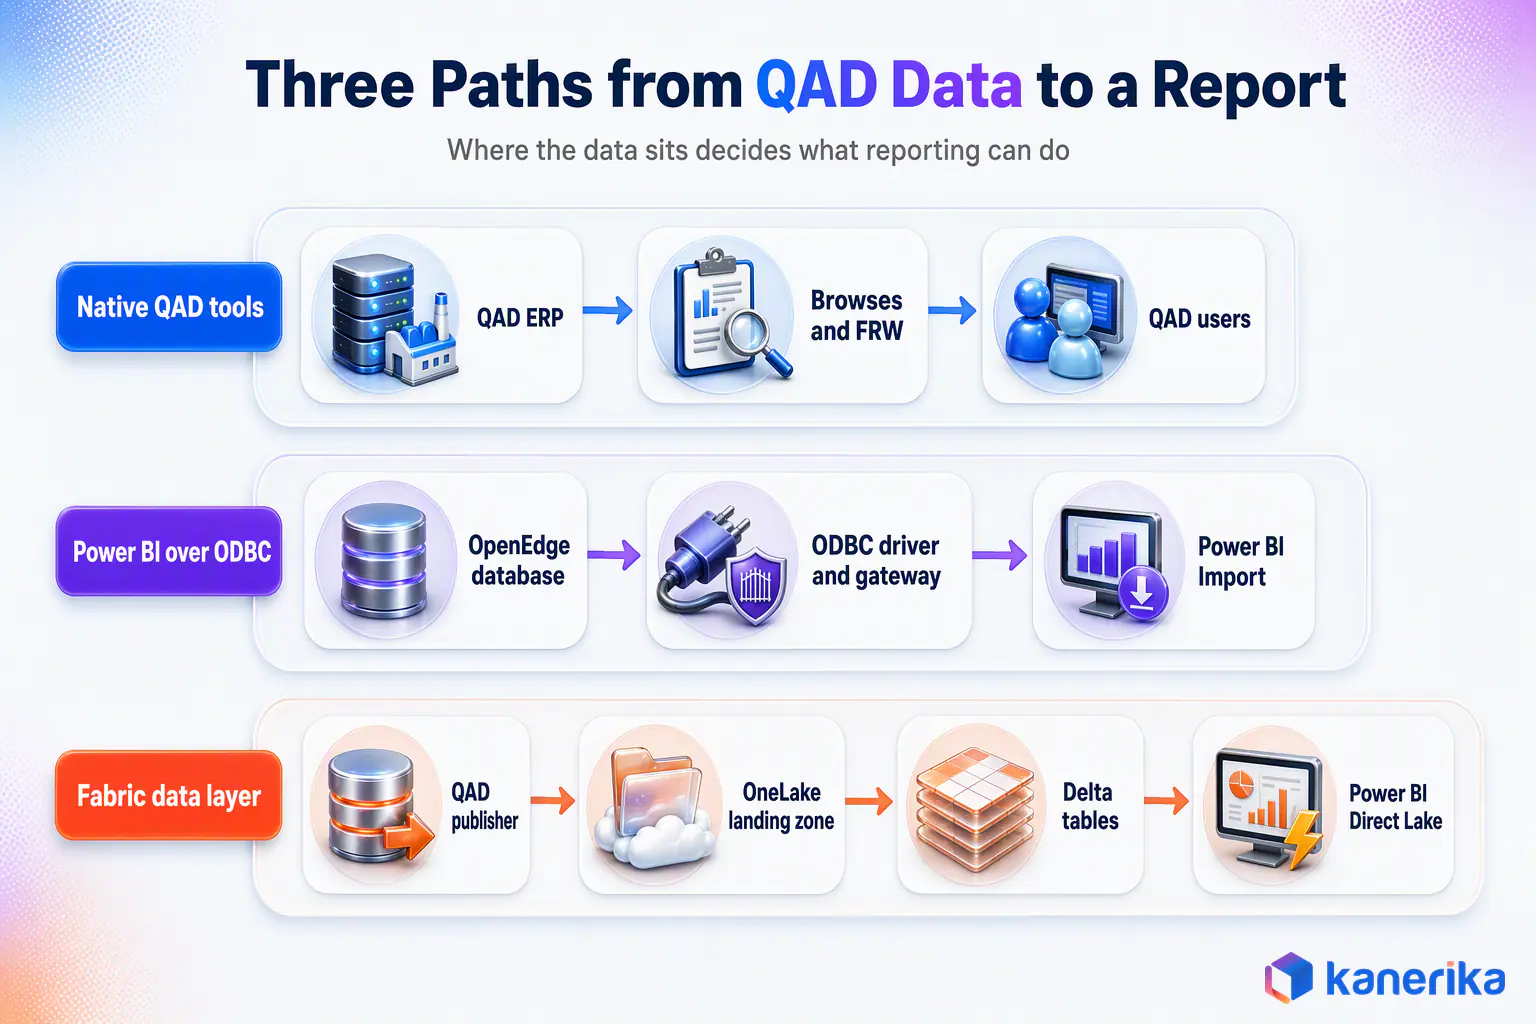
QAD runs on the Progress OpenEdge database, so the direct route to Power BI is an ODBC connection. It is quick to prove on a desktop but takes more work to run in production.
What the ODBC Connection Provides
Progress sells a DataDirect ODBC driver for OpenEdge. Its Power BI walkthrough covers installing the driver, creating a DSN that matches Power BI’s bitness and loading tables.
The driver is not a standard part of a QAD install, as Logan Consulting notes. The connection exposes whatever the database account can read, so it calls for a read-only account and an agreed set of tables.
Companies on a hosted QAD cloud should confirm whether database-level access is offered at all. That answer decides whether this route exists for them.
Import Mode, Scheduled Refresh and the Gateway
Microsoft’s ODBC connector documentation lists Import as its connectivity mode. Power BI copies QAD data into the model at each refresh rather than querying the database live.
Scheduled refresh in the Power BI service reaches an on-premises ODBC source through an on-premises data gateway. The gateway machine also needs the same driver and DSN, plus monitoring of its own.
Model QAD Data Before Building Visuals
QAD tables are built for transactions, so a report built straight on them gets slow and hard to maintain. Instead, a star schema with fact tables for orders, shipments and ledger lines, plus dimensions for item, customer, site and date, keeps measures simple.
Kanerika’s guide to Power BI data modeling best practices covers the design. Licensing also shapes the model, and the comparison of Power BI Premium and Pro covers refresh limits and sharing.
Checklist
Power BI Best Practices Checklist
Kanerika’s enterprise Power BI checklist covers performance, governance, security, licensing and Microsoft Fabric readiness. Run through it before QAD reports move from a pilot to the wider business.
Get the Checklist →
What Breaks as Reporting Grows
Small imports work well. Problems tend to appear as extracts widen, refresh windows overlap and more reports hit the production database during working hours.
A 2018 Fabric Community thread describes a QAD 2010SE source that worked in Power BI Desktop but timed out through the gateway. The user suspected the gateway was trying to read all 769 tables while setting up the source.
Field width is another known snag. OpenEdge can hold text longer than a field’s declared SQL width. SQL reads then fail until DBTOOL corrects it, as the Progress knowledge base explains.
Kanerika saw a related pattern on live QAD systems for a global manufacturer. Standard data pulls missed records deleted in QAD and slowed down on the largest tables, so reports risked drifting away from QAD totals.
Treat these as items to test rather than proof that every installation hits them. The ODBC route makes sense as a starting point for a defined report set and an internal team that can own it.
When QAD Reporting Needs a Data Warehouse or Microsoft Fabric
A separate reporting layer earns its cost when reports outgrow one database. It moves analytical queries off QAD and gives every report the same cleaned, joined data.
Keep Report Queries Off the ERP Database
With a warehouse or lakehouse in place, Power BI queries the reporting copy instead of QAD.
Extraction still reads from the source, so the load moves to a controlled schedule rather than disappearing.
The layers involved are set out in this overview of data warehouse architecture, and a review of data warehouse tools compares the platforms.
Combine QAD with MES, CRM and Quality Data
Many manufacturing questions reach beyond the ERP. For example, plant performance needs MES data, customer profitability needs CRM data, and cost of quality needs inspection records.
A shared layer lets those sources meet on common definitions for customer, item, site and period. A manufacturing data lakehouse is built around that idea.
Scheduled Loads or Managed Open Mirroring
A traditional data warehouse loads QAD tables on a schedule through ETL pipelines. Microsoft Fabric adds Open Mirroring, which applies changes written by an upstream publisher and keeps Delta tables current in OneLake.
Fabric has no native mirroring connector for QAD, so the publisher has to be built or bought. Kanerika’s guide on how to mirror QAD ERP data into Microsoft Fabric covers the landing zone, keys and monitoring in detail.
Power BI on the Fabric Data Layer
Once QAD tables are mirrored, Power BI semantic models can read them in Direct Lake mode, as Microsoft’s Open Mirroring FAQ confirms. Report freshness then follows replication, with no import schedule to manage. Kanerika’s walkthrough of Direct Lake semantic models covers the setup.
Curated views and a semantic model are still required on top, often in a Fabric lakehouse layer. End-to-end freshness includes extraction, Fabric ingestion and model refresh, so measure it from the QAD commit to the report.
QAD ERP Reporting Options Compared
The table compares the main routes on the criteria that decide fit. However, edition, access rights, data volume and team skills can shift any row.
Table 1: QAD ERP Reporting Options Compared
| Option |
Best fit |
Data freshness |
Sites and sources |
Report logic |
Effort and ownership |
| Browses |
Operational lookups |
Current QAD data |
One or more domains, QAD only |
Uses QAD logic |
Low |
| Reporting Framework |
Invoices and formatted documents |
Current QAD data |
QAD only |
Uses QAD logic |
Medium, for layout work |
| Financial Report Writer |
Financial statements and budgets |
Refreshed as the ledger posts |
Cross-domain, QAD only |
Uses QAD finance setup |
Medium |
| Action Centers |
Role-based KPIs |
Near real time, on an interval or on demand |
QAD only |
Uses QAD logic |
Low to medium |
| Excel exports |
Ad hoc analysis |
Snapshot at export |
Manual joins |
Rebuilt by hand |
Low at first, high over time |
| Specialist QAD reporting tools |
Ad hoc and production reports |
Depends on the tool |
Some combine sources |
Prebuilt joins help |
License plus training |
| Power BI over ODBC |
Departmental dashboards |
Scheduled import |
QAD plus other imports |
Rebuilt in the model |
Medium, with a gateway and model owner |
| Power BI over a data warehouse |
Enterprise dashboards |
Scheduled loads |
Many sources |
Rebuilt in the warehouse and model |
High build, ongoing support |
| Power BI over Fabric with Open Mirroring |
Shared analytics across sites |
Near real time once files land |
Many sources in OneLake |
Rebuilt in views and the model |
Highest build, lower to run with a partner |
The routes can coexist. Keeping FRW for statements and the Reporting Framework for documents, while Power BI or Fabric handles cross-functional analysis, is a sound pattern.
Why External QAD Reports Show Different Numbers
Connecting to QAD is the easy part. Matching the numbers QAD itself shows takes deliberate work on logic, context and controls.
Rebuild the Report Logic Too
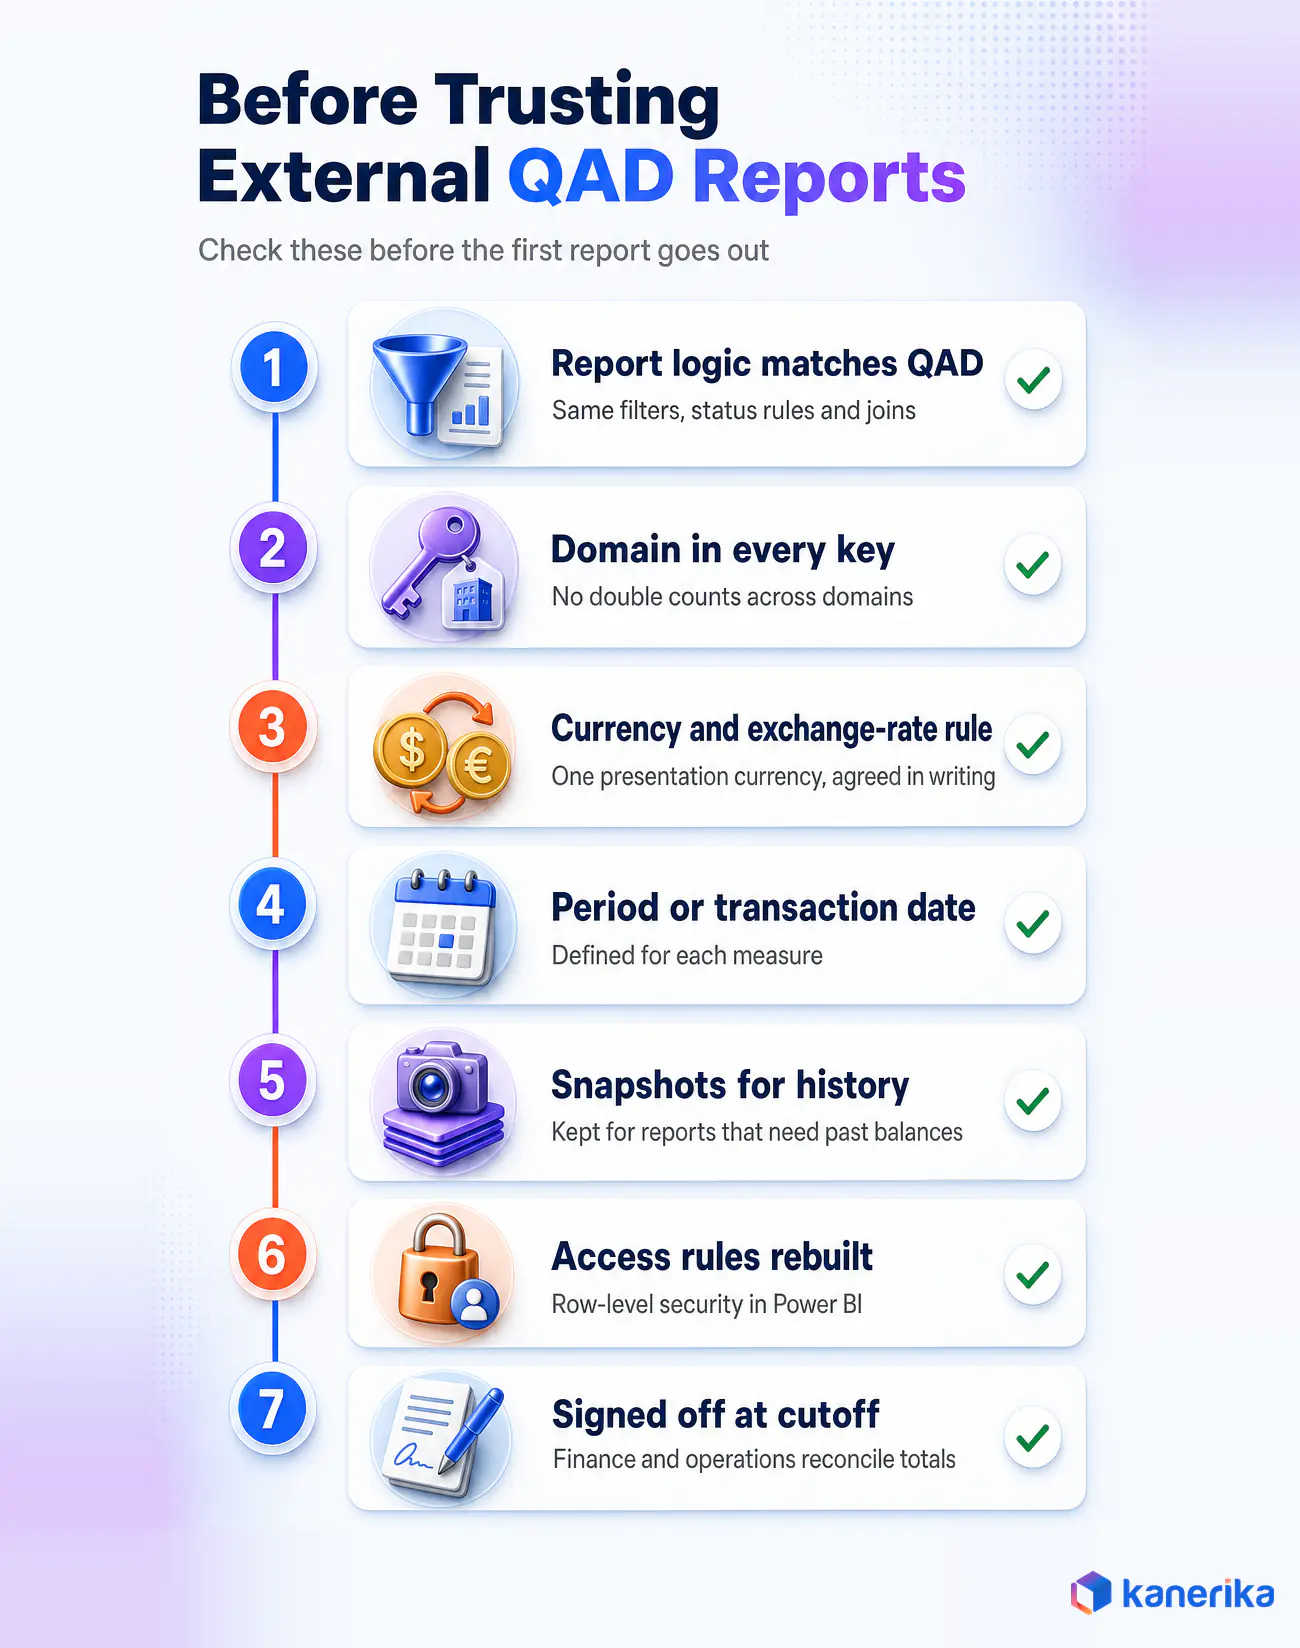
QAD reports apply filters, status rules and joins that a raw table copy does not carry. An open-orders measure has to exclude the same closed and cancelled lines that the QAD report excludes.
Compare each external report against the approved QAD output for a sample period before release.
Keep Domain, Site and Entity Context
When the same item or customer code can exist in more than one domain, keys and joins need the domain field. Without it, totals double count and lines go missing.
The same care also applies to sites and legal entities. Test every join at the business level the report claims to show.
Agree on Currency, Periods and History
Settle four definitions in writing before the first report goes out.
- Accounting period or transaction date for each measure
- Presentation currency and the exchange-rate rule
- Unit conversions and business-day cutoffs
- Current balances or historical snapshots
Current stock levels say nothing about last quarter’s stock unless snapshots were kept. Decide which reports need history before the first load.
Rebuild Access Rules and Reconcile
QAD’s menu and domain security does not travel with exported data. So row-level security in Power BI has to rebuild it, and Kanerika’s guide to Power BI row-level security covers the setup.
A scheduled reconciliation of balances and totals at an agreed cutoff keeps trust in the external reports. Finance and operations owners should then sign it off. Kanerika’s guide to data reconciliation and its data quality framework cover the methods.
Which Manufacturing Reports to Build First
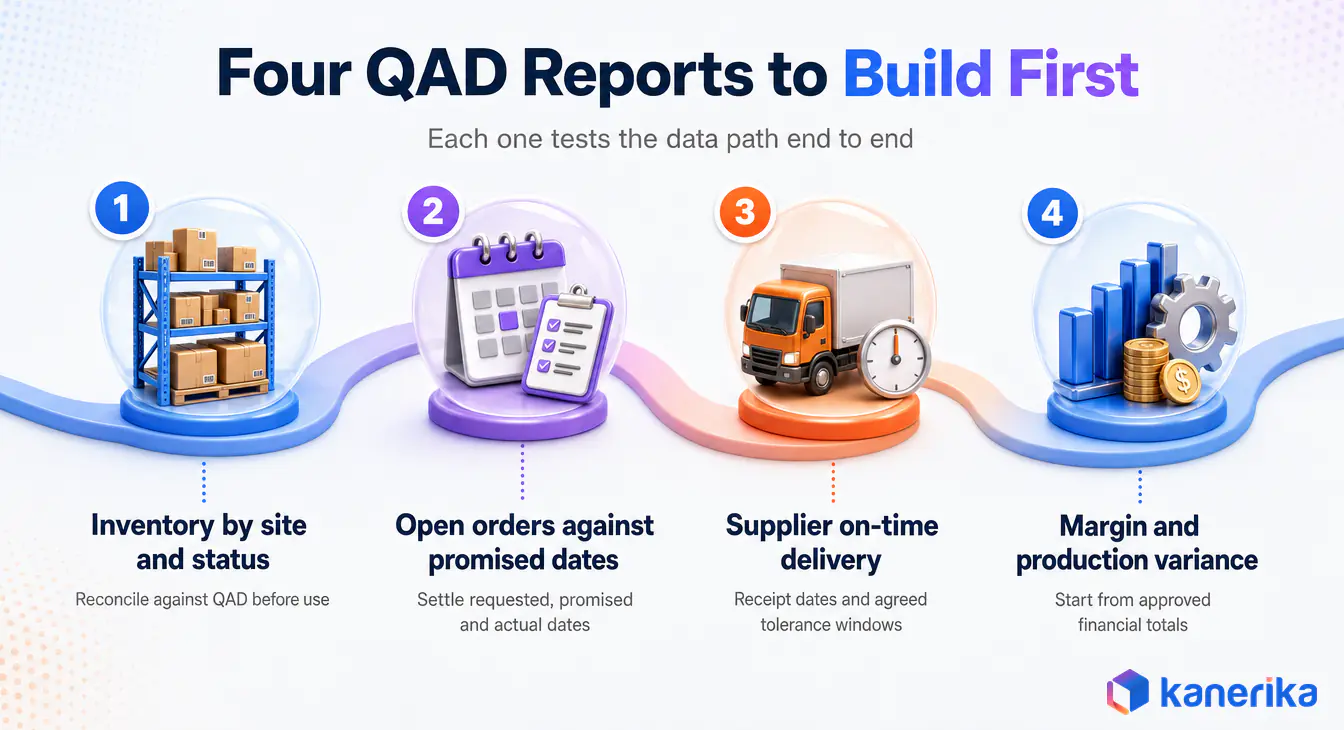
Start with one question that a day-old export answers badly. These four reports test the data path end to end and give the business something it uses daily.
- Inventory by site and status. Agree on definitions and reconcile against QAD before anyone uses it for decisions.
- Open orders against promised dates. Settle requested, promised and actual dates, and how partial shipments count.
- Supplier on-time delivery. Use receipt dates and agreed tolerance windows so suppliers and buyers see the same score.
- Margin and production variance. Start from approved financial totals, then add production or quality data where it explains the variance.
Once these reports hold up, forecasting is a natural next step, and Kanerika’s guide to predictive analytics in supply chain covers the use cases.
Kanerika’s article on business intelligence for manufacturing covers the wider KPI set, and its guide to manufacturing data analytics explains where these reports lead next.
What Each QAD Reporting Route Costs to Run
License prices change and vary by agreement, so compare routes by the work they create. The table lists the main cost items for each route.
Table 2: Cost and Ownership by QAD Reporting Route
| Route |
Licenses and platform |
Build work |
Ongoing work |
| Native QAD tools |
Existing QAD entitlements and modules |
Report setup and FRW configuration |
Report changes after QAD upgrades |
| Power BI over ODBC |
ODBC driver, Power BI licenses and a gateway server |
Data model, measures and reconciliation |
Gateway care, refresh failures and query tuning |
| Data warehouse |
Database or cloud platform, ETL tooling and Power BI |
Pipelines, dimensional model and history |
Pipeline monitoring and schema changes |
| Fabric with Open Mirroring |
Fabric capacity, Power BI and publisher hosting |
Publisher, keys and semantic model |
Replication monitoring, upgrade testing and reconciliation |
For Fabric, replication compute is free and mirroring storage is free up to one terabyte per capacity unit, according to Microsoft’s mirroring overview. Queries and Power BI refreshes still use capacity. Kanerika’s guides to Fabric pricing and capacity sizing cover the rest.
Internal delivery costs less when the skills and support processes already exist. A delivery partner fits when the company needs agreed support levels and lacks the staff to run the connection.
Datasheet
Bring QAD ERP Data into Microsoft Fabric with Open Mirroring
How Kanerika brings QAD ERP data into Microsoft Fabric with Open Mirroring, so reporting, analytics and AI work from current, connected data.
View the Datasheet →
How Kanerika Delivers QAD ERP Reporting
Kanerika delivers QAD reporting on Microsoft Fabric as a service, with no software license to buy. The work runs on Kanerika’s own QAD integration layer, which publishes QAD tables into Fabric through Open Mirroring.
- Assess. Review the QAD version, hosting, data access and the reports the business argues about most.
- Pilot. Mirror the tables behind one business question, reconcile them against QAD and build the first Power BI model.
- Scale. Add domains, sources and reports in waves, with access rules rebuilt in Fabric and Power BI.
- Operate. Monitor the publisher and replication, test QAD upgrades and run reconciliation as an ongoing service.
For a global manufacturer running QAD across several sites and regions, Kanerika connected more than 200 QAD tables to Fabric. Testing on the live systems surfaced seven QAD-specific issues, all fixed before rollout. Reloads produced no duplicate records, according to the QAD Open Mirroring case study.
Case Study
Bringing Live QAD ERP Data into Microsoft Fabric with Open Mirroring
Kanerika connected more than 200 QAD tables to Microsoft Fabric for a global manufacturer, with each site in its own Fabric space and no duplicate records on reload.
Read the Case Study →
Kanerika is a Microsoft Solutions Partner for Data and AI with the Analytics specialization. Its Power BI and Microsoft Fabric teams also deliver Power BI over ODBC or a warehouse where that route fits better. Report suites on older tools can move with FLIP, Kanerika’s migration accelerator for Crystal Reports to Power BI and SSRS to Power BI.
Manufacturers running QAD can start with a short assessment of their reporting needs, data access and freshness targets. Kanerika’s data integration services cover the pipelines on either route.
Choosing a QAD Reporting Path That Lasts
QAD ERP reporting works best in layers. Native tools keep handling documents, lookups and statements, while Power BI and a shared data layer take on analysis that spans sites and systems.
Pick the route by freshness, scope and ownership, then prove it on one report the business already debates. Then reconcile it against QAD, and the next reports get easier. A QAD reporting setup built that way can grow from one plant’s dashboard to a shared view of the whole business without starting over.
Talk to Kanerika
Planning Your QAD ERP Reporting?
Kanerika reviews your QAD setup, current reports and the numbers teams argue about, then maps a pilot around one business question.
Talk to Kanerika →
Frequently Asked Questions
What reporting tools are available in QAD ERP?
QAD ERP includes browses for operational queries, the QAD Reporting Framework for formatted documents such as invoices, and the Financial Report Writer for financial statements. QAD Adaptive ERP adds Action Centers and embedded analytics with role-based KPIs. Teams also export browses to Excel or connect Power BI, a data warehouse or Microsoft Fabric for wider analysis.
What is the difference between QAD browses and Reporting Framework reports?
Browses are interactive queries over current QAD data. Users filter, sort, group and export rows to Excel, PDF or CSV. The QAD Reporting Framework produces formatted output such as invoices and sales order acknowledgments, and it can email documents to customer contacts. Browses answer questions, while the Reporting Framework produces documents with a fixed layout.
What is the QAD Financial Report Writer used for?
The Financial Report Writer is QAD’s main tool for financial statements and management reporting. It builds reports on report cubes that can draw from one or more domains, with dimensions such as entity, division and product line. A background process refreshes its data as transactions post, and budgets can load for budget-to-actual comparisons.
Can the QAD Financial Report Writer report across domains and currencies?
Yes. The Financial Report Writer can report across domains in a presentation currency, using a chart of accounts cross-reference where domains use different account structures. Supplementary analysis codes add extra reporting dimensions. A consolidated reporting view is still different from the full consolidation process, so confirm how eliminations and adjustments are handled before relying on it.
Can QAD browse results be exported to Excel or PDF?
Yes. Browse results can be exported to Excel, PDF or CSV from the Actions menu, and browses can be saved with their criteria or emailed as links. Exports are snapshots, so each file goes stale as QAD changes. Recurring reports built on exports end up reconciled by hand.
Can Power BI connect to QAD ERP?
Yes. The direct route uses the Progress DataDirect ODBC driver for OpenEdge, a DSN that matches Power BI’s bitness and the Power BI ODBC connector. Scheduled refresh in the Power BI service goes through an on-premises data gateway. Larger setups load QAD data into a data warehouse or Microsoft Fabric first and point Power BI there.
Does Power BI support DirectQuery to QAD over ODBC?
Microsoft’s generic ODBC connector documentation lists Import as its connectivity mode, so Power BI copies QAD data into the model on each refresh rather than querying the database live. Teams that need fresher reports can move QAD data into Microsoft Fabric, where Power BI can read mirrored tables in Direct Lake mode without scheduled imports.
Why does a QAD ODBC source work in Power BI Desktop but time out in the service?
Desktop runs the driver on the analyst’s machine, while scheduled refresh runs through the on-premises data gateway. The gateway machine needs the same ODBC driver, DSN and bitness. A Fabric Community thread describes a QAD source timing out through the gateway, with the user suspecting it was enumerating all 769 tables during setup.
What causes SQL width errors when reporting on QAD data?
Progress OpenEdge can store text longer than a field’s declared SQL width. When a report reads that field over SQL or ODBC, the query fails with an error about a value exceeding its maximum length. The Progress knowledge base describes using the DBTOOL utility to correct the SQL width so the field can be read.
How is a data warehouse different from QAD ERP reporting?
QAD reporting tools run against the live ERP and work with QAD data. A data warehouse holds a separate copy, loaded on a schedule, that combines QAD with other systems and keeps history. Reports then query the warehouse instead of the ERP. The tradeoff is pipeline, modeling and support work that native tools avoid.
Which QAD reporting option gives the freshest data?
Browses and Action Centers read QAD data in place, and Action Centers KPIs can update in near real time. The Financial Report Writer refreshes as transactions post to the general ledger. Power BI over ODBC is only as current as its last scheduled import. Fabric with Open Mirroring keeps reporting tables close to current, and Power BI can read them in Direct Lake mode.
Is QAD business intelligence enough without Power BI?
QAD’s built-in business intelligence, including Action Centers, browses and the Financial Report Writer, covers KPIs, lookups and statements built on QAD data. It is often enough when reports stay inside QAD. Power BI is worth adding when reports combine QAD with MES, CRM or quality data, need years of history or serve people who do not use QAD.
What are QAD Action Centers?
Action Centers are role-based dashboards in QAD Adaptive ERP built from data read directly from the QAD database. They ship with predefined metrics, and teams can add KPIs built with browses or the Financial Report Writer. KPIs can update in near real time, on an interval or on demand, and access follows the security on the underlying browse.