TL;DR
Automated data validation is software that checks data against set rules without a person reviewing each record. It compares source and target data, tests structure and values, and flags every record that breaks a rule. Teams run it after migrations and on a schedule for live pipelines. The hard parts are mapping tables across platforms, writing business rules and keeping audit evidence. A good tool turns those rules into queries and produces a report that supports sign-off. Klarity360 by Kanerika does this for platforms such as Oracle, SQL Server, Snowflake and Microsoft Fabric.
Key Takeaways
- Software tests data against rules, so every row gets checked and not only a sample.
- Four layers do the work, which are schema checks, row-level comparison, business rules and tolerance checks.
- Gartner research puts the average cost of poor data quality at $12.9 million a year per organization.
- The main challenges are cross-platform mapping, business rule capture, data volume, false alarms and audit evidence.
- Klarity360 turns plain-language rules into validation queries and reports results in a dashboard and an Excel Recon Report.
- The Klarity360 page reports 60% faster data reconciliation, 5X faster migration sign-off and 50% fewer engineering hours.
793 Hours a Month Go to Fixing Bad Data
A 2022 survey of 300 data professionals by Monte Carlo and Wakefield Research found that the average organization handles about 61 data incidents a month. Each incident takes around 13 hours to find and fix. That adds up to roughly 793 hours every month, according to TDWI’s report on the survey.
Many of those hours start when someone ran a check by hand, or when nobody ran a check at all. Automation moves that work into software, so the same tests run on every table, every release and every schedule.
A short demo of Klarity360 shows what this looks like for an Oracle to Microsoft Fabric move, from the first comparison to the final report.
What Is Automated Data Validation?
Automated data validation is the use of software to test data against defined rules, with no manual record-by-record review. The rules also cover structure, values, relationships and business logic. The software runs on demand or on a schedule, then lists every record that fails.
Teams usually judge data on six quality dimensions named by IBM, which are accuracy, completeness, validity, consistency, uniqueness and timeliness. Validation rules then map directly onto those dimensions. A null check tests completeness, and a duplicate check tests uniqueness.
Three terms get mixed up in planning meetings. Data validation tests whether data meets rules. Data reconciliation compares two datasets to prove they match. And data quality management during migration covers the wider program of profiling, cleansing and sign-off. Still, most real projects need all three.
Validation also differs from pipeline testing in code-first stacks. Tools such as dbt data quality tests check models inside the transformation layer. Source-to-target validation checks the finished result against the system it came from.
Why Manual Validation Cannot Keep Up With Migration Programs
Manual validation usually means a spot check, since nobody can read every row. An analyst pulls row counts, compares a few totals and then samples a handful of records. Sampling misses missing rows and values that drift slowly, and nobody finds them until a report looks wrong.
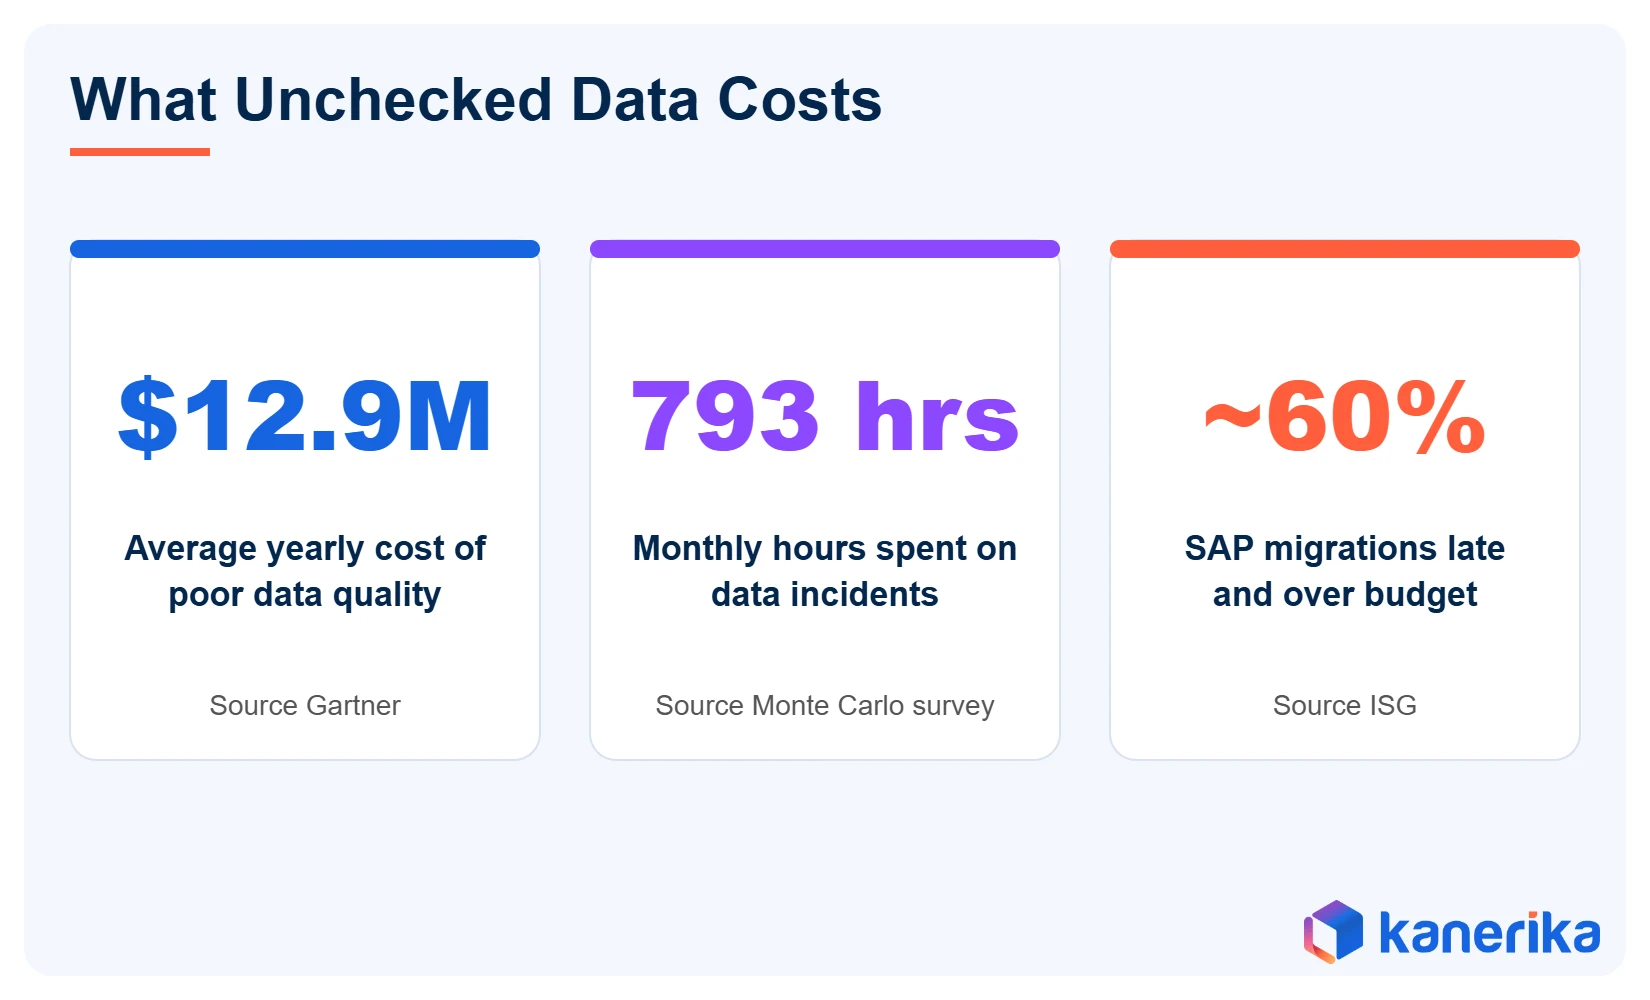
Overall, the cost of that gap is large. Gartner research from 2020 puts the average annual cost of poor data quality at $12.9 million per organization. The same Monte Carlo survey found that data professionals spend about 40% of their time evaluating or checking data quality.
Migration programs also raise the stakes. ISG research reported by The Register found that nearly 60% of SAP migration projects run late and over budget. Kanerika’s State of Enterprise Data Platform Migration 2026 report, covered in this enterprise data migration analysis, finds that 73% of projects miss their stated objectives.
Sign-off is where many of these delays pile up, because rework surfaces late. Teams cannot approve a cutover until someone proves the target matches the source. When that proof depends on manual checks, the schedule slips. A guide to legacy data migration shows how often this late-stage rework appears.
The Four Layers of Automated Data Validation
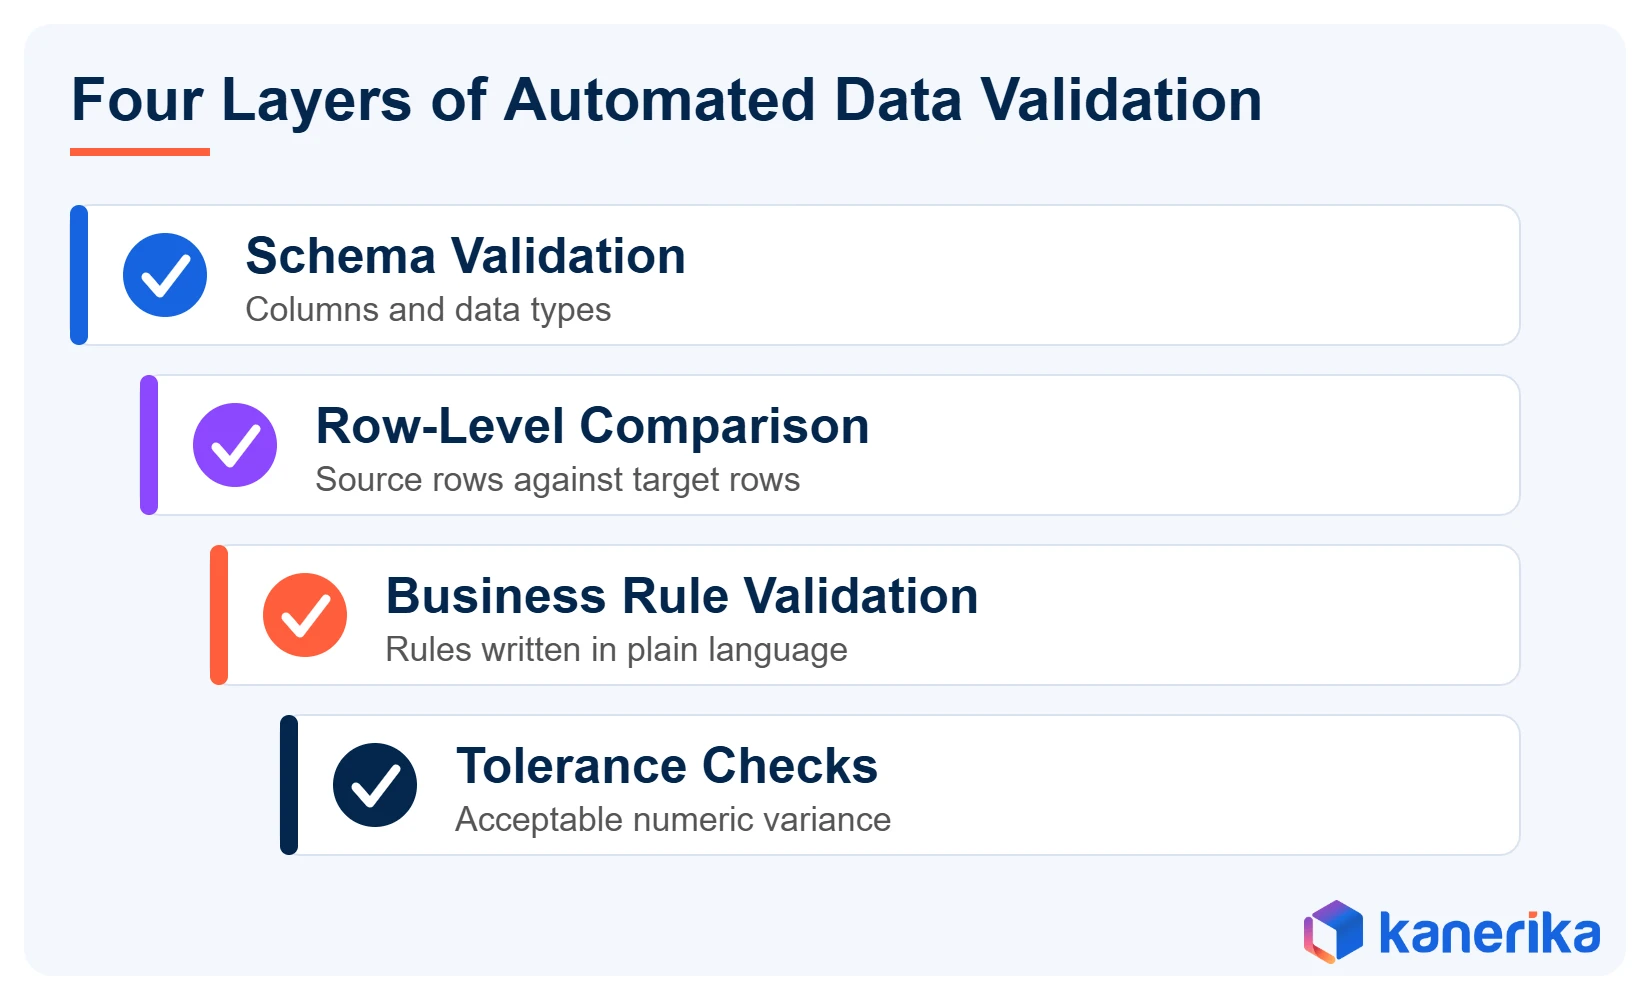
A solid validation process stacks four layers of checks. Each layer catches a different kind of defect, so skipping one leaves a gap. The table below shows what each layer tests.
| Layer | What It Checks | Defect It Catches |
|---|---|---|
| Schema validation | Columns, data types and lengths | A date column that arrived as text |
| Row-level comparison | Each source row against its target row | Missing rows, duplicates and changed values |
| Business rule validation | Rules set by data owners | An order total that no longer equals its line items |
| Tolerance checks | Numeric variance within a set limit | Rounding differences that exceed policy |
1. Schema Validation
Schema checks confirm that the target holds the same columns, data types and lengths as the source, or the mapped equivalents. They run first because a structural mismatch makes every later comparison unreliable. Moves between platforms such as Oracle and Microsoft Fabric often change how dates and decimals are stored.
2. Row-Level Comparison
Row-level comparison matches each source row to its target row and reports the differences. It also finds missing rows, extra rows, duplicates and value mismatches. As a result, this layer replaces sampling with full coverage.
3. Business Rule Validation
Business rules capture what the data must mean, such as “every active customer has a billing country.” These rules live in the heads of data owners, while others sit in old report logic. Writing them down as testable checks is often the most useful part of the project. It also ties closely to data stewardship roles.
4. Tolerance Checks
Still, some differences are acceptable. A currency amount may differ by a cent after a rounding change, and a policy can allow that. Tolerance checks let teams set the allowed variance so that harmless noise does not bury real defects.
Many teams also add checks beyond these four. Null and duplicate checks, referential integrity tests, freshness checks and anomaly detection are common. Open-source options such as Great Expectations let engineers write these expectations as code.
Kanerika Service
Data Migration Services
Kanerika plans and runs enterprise migrations to Microsoft Fabric, Databricks and Snowflake, with validation built into every wave.
Explore Migration ServicesHow Automated Data Validation Works Step by Step
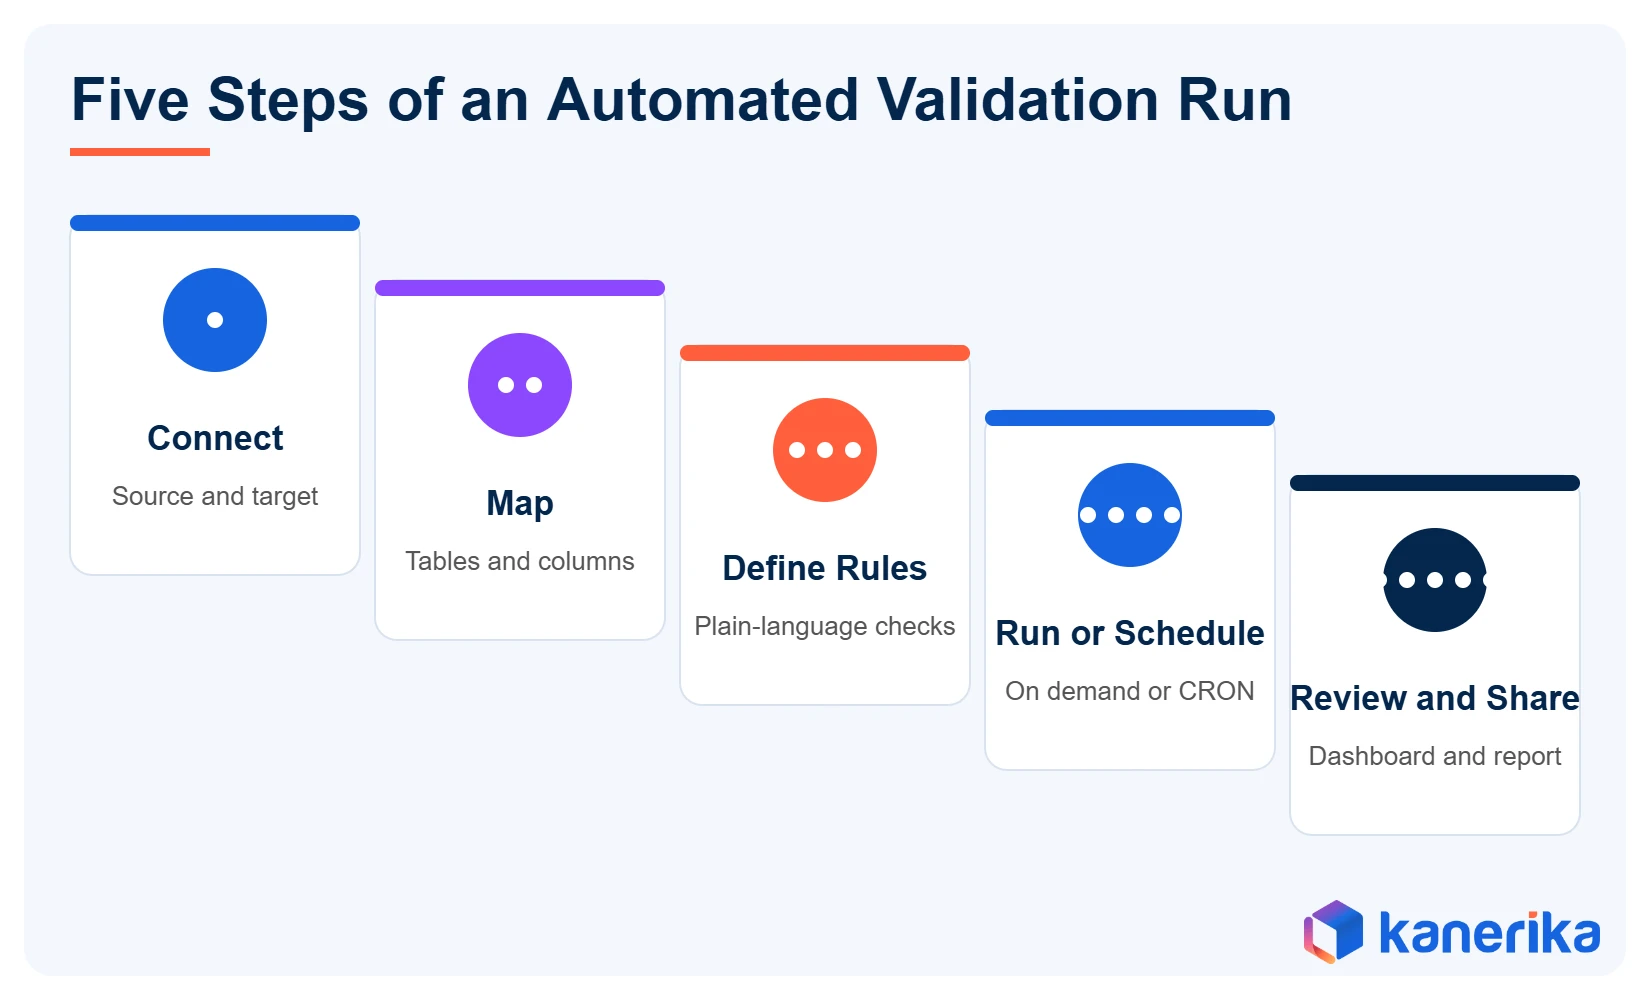
The workflow is the same whether a team scripts it or buys a tool. What changes is how much of it a person still has to do. The five steps below follow the order most projects use.
Step 1: Connect Source and Target Systems
The process starts when the team links both systems. Sources can be databases, cloud platforms or files. Read-only access is enough, so the risk stays low.
Step 2: Map Source Tables to Target Tables
Next, the team pairs each source table with its target table and each column with its counterpart. Names often change during a move, and one source table sometimes splits into several targets. This mapping is slow by hand, so ETL exports and AI-assisted suggestions save a lot of time.
Step 3: Define Validation Rules
Then the team writes the rules. Plain-language rules are easier for business owners to review than raw SQL. A preview of the generated query lets an engineer confirm the logic before a full run.
Step 4: Run or Schedule the Validation
A one-time migration needs a run on demand, while a live pipeline needs a schedule, such as hourly, daily or weekly. Saved validation processes run the same way each time, which keeps results comparable.
Step 5: Review Results and Share Evidence
The last step turns results into decisions. A dashboard shows which rules passed and failed, and a detailed report then lists the mismatched rows. That report becomes the sign-off record that auditors and executives ask for.
Main Challenges in Automating Data Validation
Automation removes manual effort, but it brings its own hurdles. Eight challenges come up most often in enterprise programs.
1. Mapping Tables Across Different Platforms
Source and target rarely line up one to one, since each platform models data differently. Table names change, columns merge and keys get redefined. Without a mapping method, teams spend weeks on spreadsheets before a single check runs.
2. Capturing Business Rules
Many rules exist only as habits, so nobody has written them down. A report developer knows that returns are excluded from revenue, but no document says so. Interviews with data owners and a review of legacy reports bring those rules out.
3. Handling Type and Format Differences
Platforms also store dates, decimals and strings differently. As a result, a naive comparison flags thousands of false differences. Validation logic needs controls for null handling, string comparison and numeric precision.
4. Running Checks at Volume
Full coverage across billions of rows still takes real compute. Teams need filters, partitioned runs and pushdown queries that execute inside the database. Otherwise a validation run takes longer than the migration wave it protects.
5. Avoiding False Alarms
When every rounding difference raises a failure, engineers stop trusting the report. Tolerance settings therefore fix this. They keep the failure list short enough to act on.
6. Producing Audit Evidence
Sign-off needs proof rather than a verbal assurance. Each run should record which rules ran, what passed and which rows failed. A short guide to data migration testing covers the test types auditors expect to see.
7. Protecting Sensitive Data During Validation
Validation tools read production data, so access control matters. Read-only connections, masked test data where possible and stored audit logs keep the risk low. Security teams should review the connection design before the first run.
8. Keeping Validation Running After Go-Live
Validation does not end at cutover. Pipelines change, sources drift and new tables arrive, so yesterday’s rules go stale. Teams that only validate once find the next defect in a dashboard instead of a test report.
Checklist
Data Migration Readiness Checklist
A practical checklist for enterprise teams that covers planning, validation and sign-off steps before a cutover.
Get the Checklist →Manual vs Automated Data Validation
The difference then shows up in coverage, speed and evidence. Manual checks still help for one-off investigations. They also do not scale to a program with hundreds of table pairs.
| Factor | Manual Validation | Automated Validation |
|---|---|---|
| Coverage | Samples and totals | Every row in scope |
| Speed | Days per table set | Minutes to hours per run |
| Consistency | Varies by analyst | Same rules every run |
| Evidence | Scattered files and screenshots | Stored report for every run |
| Repeat runs | Rework from scratch | Saved and scheduled |
The speed row deserves a caveat. Speed depends on data volume, network and compute, so treat the figures as typical ranges and not guarantees. A pilot on real tables gives the only reliable number.
Manual review still has a place. That includes exploratory checks on a new source, one-time fixes for a single table and review of rows that failed a rule. The goal is to reserve people for those cases and let software handle the routine comparison work.
What to Look for in an Automated Data Validation Tool
Tool choice also affects how fast a team reaches sign-off. A short checklist keeps the evaluation honest. The criteria below separate tools built for migration from tools built for pipeline monitoring.
- Source-to-target comparison across different platforms, not only inside one warehouse.
- Rule creation without custom code, so business owners can review the logic.
- Table mapping help, ideally from an ETL export file.
- Previews of generated queries before a full run.
- Scheduling for recurring checks.
- Reports that auditors accept as evidence.
Ask each vendor for a demo on your own data. A review of data migration tools helps frame the wider range of tools. Teams that plan AI-assisted migration should also check how a validation tool reads mappings produced by migration accelerators.
Cost also matters. A validation tool that saves engineering hours pays back faster on large programs, so model the effort before you buy. The role of automation in migration explains which stages give the best return.
Klarity360 by Kanerika for Automated Data Validation
Klarity360 is Kanerika’s data validation software for reconciling source and target systems. It compares data row by row and then reports where the datasets differ. The Klarity360 product page positions it as automated data validation for faster migration sign-off.
What Klarity360 Does
Klarity360 converts natural-language business rules into validation queries, so users do not write SQL or code. It includes AI-assisted table mapping and many-to-many mapping for complex moves. Users can preview the generated query and sample results before a full run.
Each validation process runs four stages in order. These are schema validation, row-level comparison, business rule validation and tolerance checks for acceptable numeric variance. The output lists missing rows, duplicates and value mismatches.
Datasheet
Automated Data Validation with Klarity360
Specifications for Klarity360, including validation stages, supported sources, scheduling options and report outputs.
View the Datasheet →How a Klarity360 Run Works
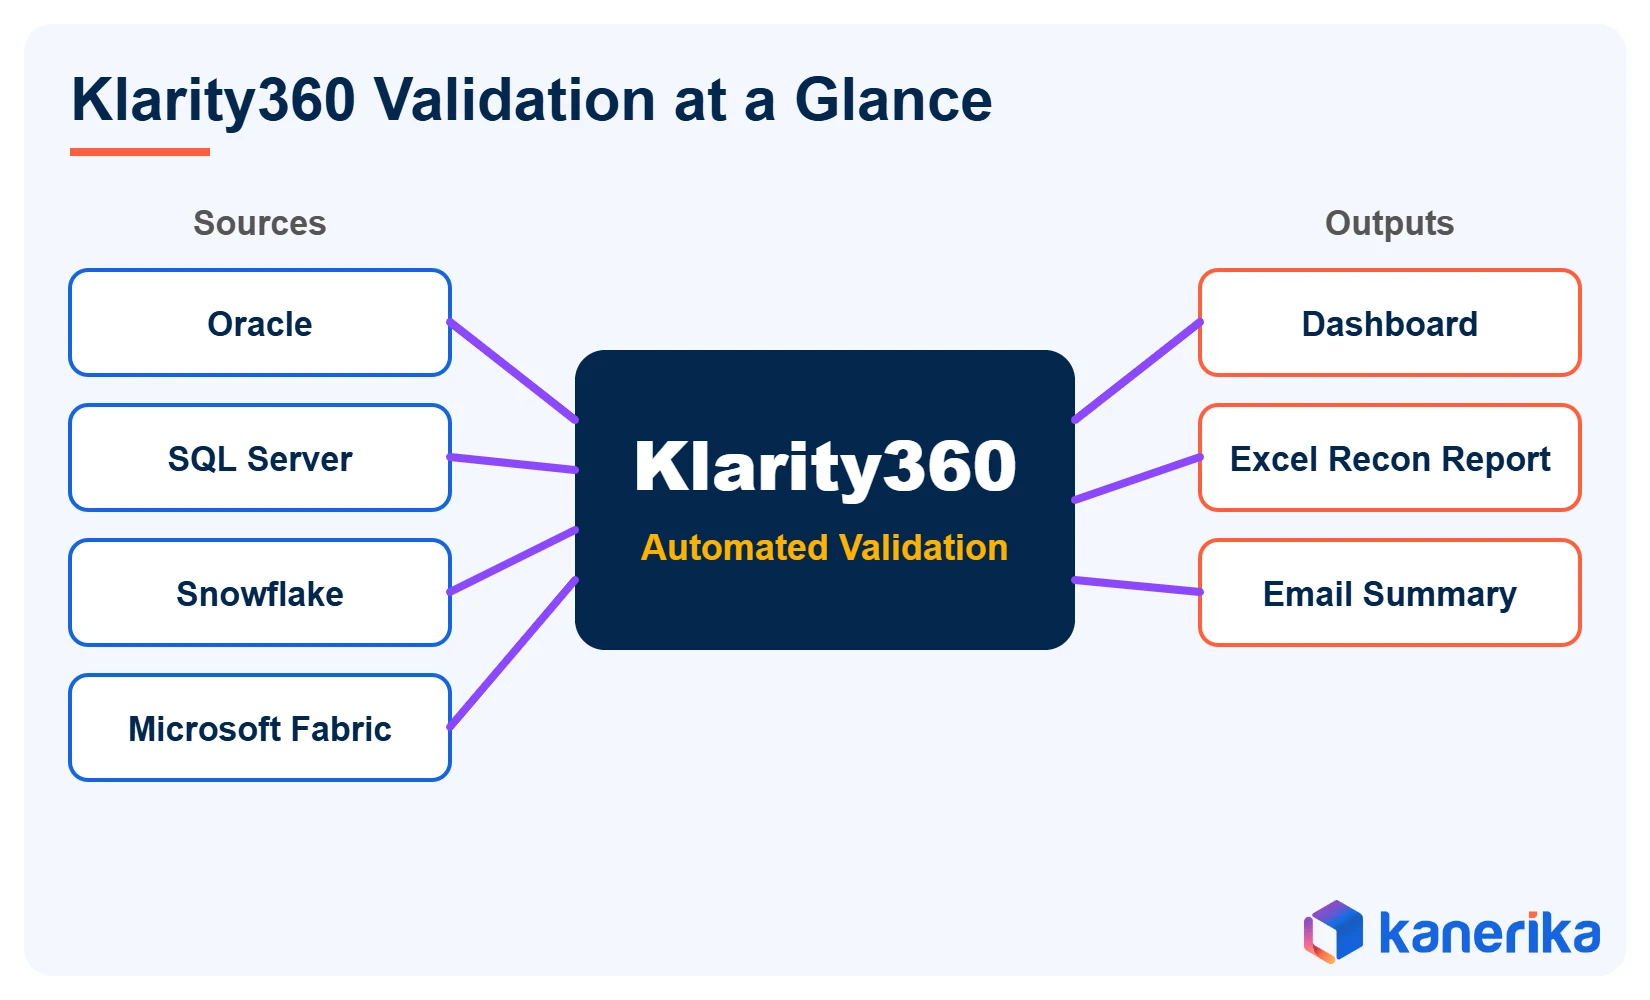
The workflow follows the five steps described earlier. Users connect source and target systems, then map data by accepting AI suggestions, uploading an ETL export or mapping manually. They write rules in plain language and run the process immediately or on a schedule. Results appear in a dashboard, and teams can download an Excel Recon Report or email a summary.
Supported Sources and Platforms
Klarity360 connects to Oracle, Microsoft SQL Server, Azure SQL, PostgreSQL and IBM Db2. It also supports Microsoft Fabric and Snowflake as cloud data platforms, plus CSV, Excel, Microsoft Access, Alteryx data files and OneDrive files.
ETL export mapping pre-fills table and column mappings from Informatica PowerCenter XML, Microsoft Fabric JSON and Alteryx .yxmd and .yxzp files. That helps teams moving from Informatica to Microsoft Fabric or from Alteryx to Microsoft Fabric.
Reports and Audit Evidence
The in-app dashboard also shows rules passed, rules failed and rows compared. The Excel Recon Report carries summary, missing source, missing target and duplicate tabs. Each run produces a record of rule outcomes and mismatched rows, which works as audit and sign-off evidence.
Results Kanerika Reports for Klarity360
The Klarity360 page lists three headline figures. These are 60% faster data reconciliation, 5X faster migration sign-off and 50% fewer engineering hours. They are Kanerika-reported figures and not an independent benchmark, so test them against your own volumes in a pilot.
Where Automated Data Validation Fits in Real Programs
Four use cases cover most demand. Each one maps to a different point in the data lifecycle.
1. Post-Migration Data Validation
After a move, teams reconcile legacy ETL output against the migrated pipelines. This is the sign-off gate for programs such as SSIS to Microsoft Fabric and Azure Data Factory to Microsoft Fabric. The data migration checklist places this step in the wider plan.
Case Study
40% Lower Costs: SSIS to Microsoft Fabric Migration
A large enterprise moved complex SSIS pipelines to Microsoft Fabric, cutting operational costs by 40% and manual maintenance effort by 25%.
Read the Case Study →2. Ongoing ETL Validation
Production pipelines also need recurring checks on their outputs. Scheduled validation catches drift before a dashboard shows it. This protects the work done in data engineering until the pipeline retires.
3. Platform Modernization Programs
Large programs validate table by table across waves, such as Oracle to Fabric or SQL Server to Snowflake. Saved processes therefore keep every wave on the same standard. Planning guides for SQL Server data migration and the data migration decision framework help set the wave order.
4. Cross-System Data Reconciliation
Sometimes a team must compare a file against a database table, or two operational systems against each other. The same row-level engine also handles both. Teams running multi-cloud data migration meet this need often.
How to Measure the Return on Automated Data Validation
Return is easiest to see in four numbers. These are the engineering hours spent per validation wave, the defects found before cutover, the days between final load and sign-off, and the rework needed after go-live. Record each number for a manual wave first, then for an automated pilot.
The comparison then gives leaders a fair view of the effort saved. It also shows where checks still miss defects, which tells the team which rules to add next. Modeling the cost and time of a migration first helps frame the wider business case.
Talk to Kanerika
See Klarity360 Run on Your Own Data
Book a live demo to watch Klarity360 map tables, apply plain-language rules and produce a reconciliation report for your source and target platforms.
Book a Klarity360 Demo →Best Practices for Rolling Out Automated Data Validation
Good rollouts follow a few habits that save time later. Start small and expand once the first results are trusted.
- Pick the tables that feed regulated reports and executive dashboards first.
- Write business rules with data owners and keep them in version control, since rules change.
- Set tolerances before the first full run so results stay readable.
- Then run a pilot on one wave and compare effort against manual checks.
- Schedule recurring runs for pipelines while they stay in production.
- Finally, store every report as evidence for audit and governance reviews.
Validation results also feed governance. Failed rules point to ownership gaps that a data governance program can close. Teams on Databricks can apply the same approach, and the guide to Informatica to Databricks migration shows where validation fits in that path.
Conclusion
Automated data validation replaces sampling with full coverage and turns sign-off into a repeatable, documented step. Overall, the strongest programs combine four layers of checks, clear business rules and reports that auditors accept. For migration teams, Klarity360 by Kanerika gives teams a way to apply that approach without writing comparison code. Review the Klarity360 datasheet or book a demo to see a run on your own platforms.
Frequently Asked Questions
What is automated data validation?
Automated data validation is the use of software to check data against defined rules without manual record-by-record review. The rules test structure, values, relationships and business logic. The software runs on demand or on a schedule and reports every record that fails, which gives teams full coverage instead of a sample.
What is the difference between data validation and data reconciliation?
Data validation tests whether data meets rules, such as correct types, no nulls in key fields or valid business logic. Data reconciliation compares two datasets, usually source and target, to prove they match. Migration programs need both, because a table can pass every rule and still miss rows from the source.
What types of checks does automated data validation run?
Common checks include schema validation of columns and data types, row-level comparison between source and target, business rule validation and tolerance checks for numeric variance. Many teams add null checks, duplicate checks, referential integrity tests, freshness checks and anomaly detection. Each check type catches a different kind of defect.
Why is manual data validation not enough for migrations?
Manual validation relies on samples and totals, so it can miss missing rows and values that drift slowly. It also depends on the analyst, leaves scattered evidence and has to be repeated for every wave. Automated validation covers every row in scope and stores a report for each run.
How does automated data validation work step by step?
The process connects source and target systems, maps tables and columns, defines validation rules, runs or schedules the checks and reviews the results. Good tools preview the generated queries before a full run. The final report becomes the sign-off record for the migration or the pipeline.
What are the main challenges of automating data validation?
The main challenges are mapping tables across platforms, capturing business rules that exist only as habits, handling type and format differences, running checks at volume, avoiding false alarms and producing audit evidence. Tolerance settings, query previews and saved processes reduce most of these problems in practice.
How do you choose an automated data validation tool?
Look for source-to-target comparison across different platforms, rule creation without custom code, table mapping help, query previews, scheduling and reports that auditors accept. Ask each vendor to run a demo on your own data. A pilot on one migration wave gives a reliable measure of the effort saved.
What is Klarity360?
Klarity360 is Kanerika’s data validation software for reconciling source and target systems. It compares data row by row, converts natural-language business rules into validation queries and reports missing rows, duplicates and value mismatches. Results appear in a dashboard, an Excel Recon Report and an emailed summary.
Which platforms does Klarity360 support?
Klarity360 supports Oracle, Microsoft SQL Server, Azure SQL, PostgreSQL and IBM Db2, along with Microsoft Fabric and Snowflake. It also reads CSV, Excel, Microsoft Access, Alteryx data files and OneDrive files. ETL export mapping works with Informatica PowerCenter XML, Microsoft Fabric JSON and Alteryx files.
Can Klarity360 run validation on a schedule?
Yes. Klarity360 runs validation on demand or on a recurring schedule, including hourly, daily, weekly, monthly or custom CRON options. Saved processes run the same way each time, so teams can use the same checks for one-time migrations and for ongoing ETL validation on production pipelines.
Do users need SQL to write rules in Klarity360?
No. Users describe business rules in natural language and Klarity360 converts them into validation queries. A preview of the generated query and sample results lets an engineer confirm the logic before a full run. This keeps business owners involved in rule review without requiring code.
What is the difference between data validation and data verification?
Data validation checks whether data meets rules for format, range and meaning when it is entered or moved. Data verification confirms that data copied from one place matches the original. Migration programs use both, since a value can be valid in format yet differ from the source system.
How often should automated data validation run?
Run it after every migration wave and then on a schedule that matches how often the pipeline changes. Hourly, daily or weekly runs suit most production feeds. Critical reporting tables may need a check after every load, while stable reference tables can run weekly or monthly.
What are the limitations of automated data validation?
Automated checks only test what the rules describe, so a missing business rule means a missed defect. They also need careful mapping and tolerance settings to avoid false alarms. Human review remains important for exploratory analysis, new sources and judgment calls on rows that fail a rule.