TL;DR
What works in machine learning in predictive analytics is matching the model type to the business question. Start with gradient-boosted trees for everyday business data in rows and columns. Save deep learning for images, text and sensor streams. Before launch, each model must beat a simple rule on past data it has never seen. After launch, its scores must reach the people who act on them in time. Retrain when accuracy drops, because a model that changes no decision is worth nothing.
Key Takeaways
- Machine learning learns patterns from history and returns a number, a class or a probability for each new case, which predictive analytics turns into a decision.
- Choose the model by task: regression for amounts, classification for categories, forecasting for time series, anomaly detection for rare events and survival models for timing.
- Gradient-boosted trees such as XGBoost and LightGBM are the default for tabular business data, while deep learning earns its cost on images, text and long sequences.
- Validate on time-ordered splits and beat a simple baseline first, since random splits leak future data and flatter the model.
- Judge a model in business terms such as lift, calibration and net value, not on accuracy alone.
- Production is where value is won or lost: scores must reach a decision in time, and drift monitoring decides when to retrain.
Watch on YouTube
Revolutionizing Fraud Detection in Insurance with AI/ML-Powered RPA
See how Kanerika pairs machine learning fraud detection with automation in insurance, so model scores trigger action in the claims workflow instead of sitting in a report.
Why an Accurate Model Can Still Change Nothing
Picture a subscription business that builds a churn model. It ranks customers well in testing, and the data science team is proud of its scores.
Six months later, however, retention has not moved. The scores land in a weekly report that the call team opens on Fridays, and by then many flagged customers have already cancelled. The model was right, yet the process around it was wrong. Sound AI decision making depends on that process as much as on the model.
That gap is the real subject of machine learning in predictive analytics. A useful model has to pass three tests. Can we predict this outcome, can we act before it happens, and does acting pay for the effort?
This guide works through each test in turn. First, it matches model families to prediction tasks. Then it covers honest validation, business value and what keeps a model working once it is live.
What Machine Learning Adds to Predictive Analytics
Predictive analytics uses past data to estimate what happens next. A finance team that projects next quarter’s claim costs from the prior year’s average is already doing it.
A model that learns how claim cost varies with policy type, region, vehicle age and repair history does the same job with far more signals. The business question stays the same, so the method only decides how much of the real pattern you capture. The table below compares the three broad approaches.
| Approach | Data needed | Strengths | Typical use |
|---|
| Rules and statistics (moving averages, linear regression, business rules) | Small, clean history | Transparent, cheap and fast to build | Stable trends, policy rules, baselines |
| Classical machine learning (regularized regression, random forests, gradient boosting) | Thousands of labeled rows with many columns | Captures non-linear patterns and interactions across many signals | Churn, credit risk, fraud scores, demand by item |
| Deep learning (neural networks) | Large volumes, often unstructured | Learns directly from images, text, audio and long sequences | Document triage, image inspection, sensor streams |
Predictive Analytics Is the Process, Machine Learning Is the Engine
People often use the two terms as if they meant the same thing. Predictive analytics is the whole process: framing the question, preparing data, building a model, testing it and putting the result in front of decision makers. Machine learning is one engine inside that process, the part that learns the pattern from history.
You can run predictive analytics with a spreadsheet regression, and you can train machine learning models that never feed a business decision. The value appears only when the two work together. Our comparison of business intelligence vs predictive analytics shows where reporting ends and prediction begins. For the wider analytics uses, see the guide to machine learning for business analytics.
Where Prediction Sits Among the Four Types of Analytics
Analytics work is usually split into four types, and each one answers a different question. IBM’s overview ties descriptive analytics to what happened and diagnostic analytics to why it happened. Predictive analytics asks what might happen next, while prescriptive analytics asks what we should do next.
Machine learning does most of its work in the predictive step, and that is where teams tend to blur the line. A predictive model returns a score, such as the chance that a customer cancels this quarter. Prescriptive analytics adds a recommendation layer on top of that score. It picks the action, such as which customers get an offer within a fixed budget.
The four types build on each other rather than compete. Descriptive analytics supplies the clean record of what already happened, which every model learns from. The churn example later in this guide shows the hand-off, where a score becomes a call list once cost and capacity apply.
What Machine Learning Improves Over Rules and Statistics
Each improvement comes from a specific mechanism rather than from the label “AI”. Take a hand-written churn rule such as “flag the account if usage drops 30%.”
A model trained on the same history might learn that the drop matters mainly near renewal and for monthly plans. The rule, by contrast, also flags every quiet annual customer, so callers spend time on people who were never leaving. The list below names the mechanisms behind that difference.
- Non-linear patterns. A tree model can learn that churn risk jumps when usage falls and a renewal date is near, without anyone writing that rule.
- Many signals at once. Hundreds of columns, such as payment history and support tickets, can feed one score without hand-picked weights.
- Interactions between signals. The effect of a discount can depend on tenure and region, and a model captures that without a separate rule per segment.
- Re-learning on new data. Retraining on fresh history updates the pattern when behavior shifts, instead of waiting for someone to rewrite the logic.
- Probability scores. Classification models return a likelihood for every case, so teams can rank their work and set thresholds by cost.
When You Do Not Need Machine Learning
Not every prediction needs a trained model. A three-month moving average forecasts stable demand well, and a linear regression explains a steady cost trend. Likewise, a business rule such as “flag accounts 60 days past due” is often good enough on its own.
Treat these simple methods as the baseline. Every machine learning model has to beat them on the same test data, by enough to pay for building and maintaining it. If it cannot, then ship the simple method and move on.
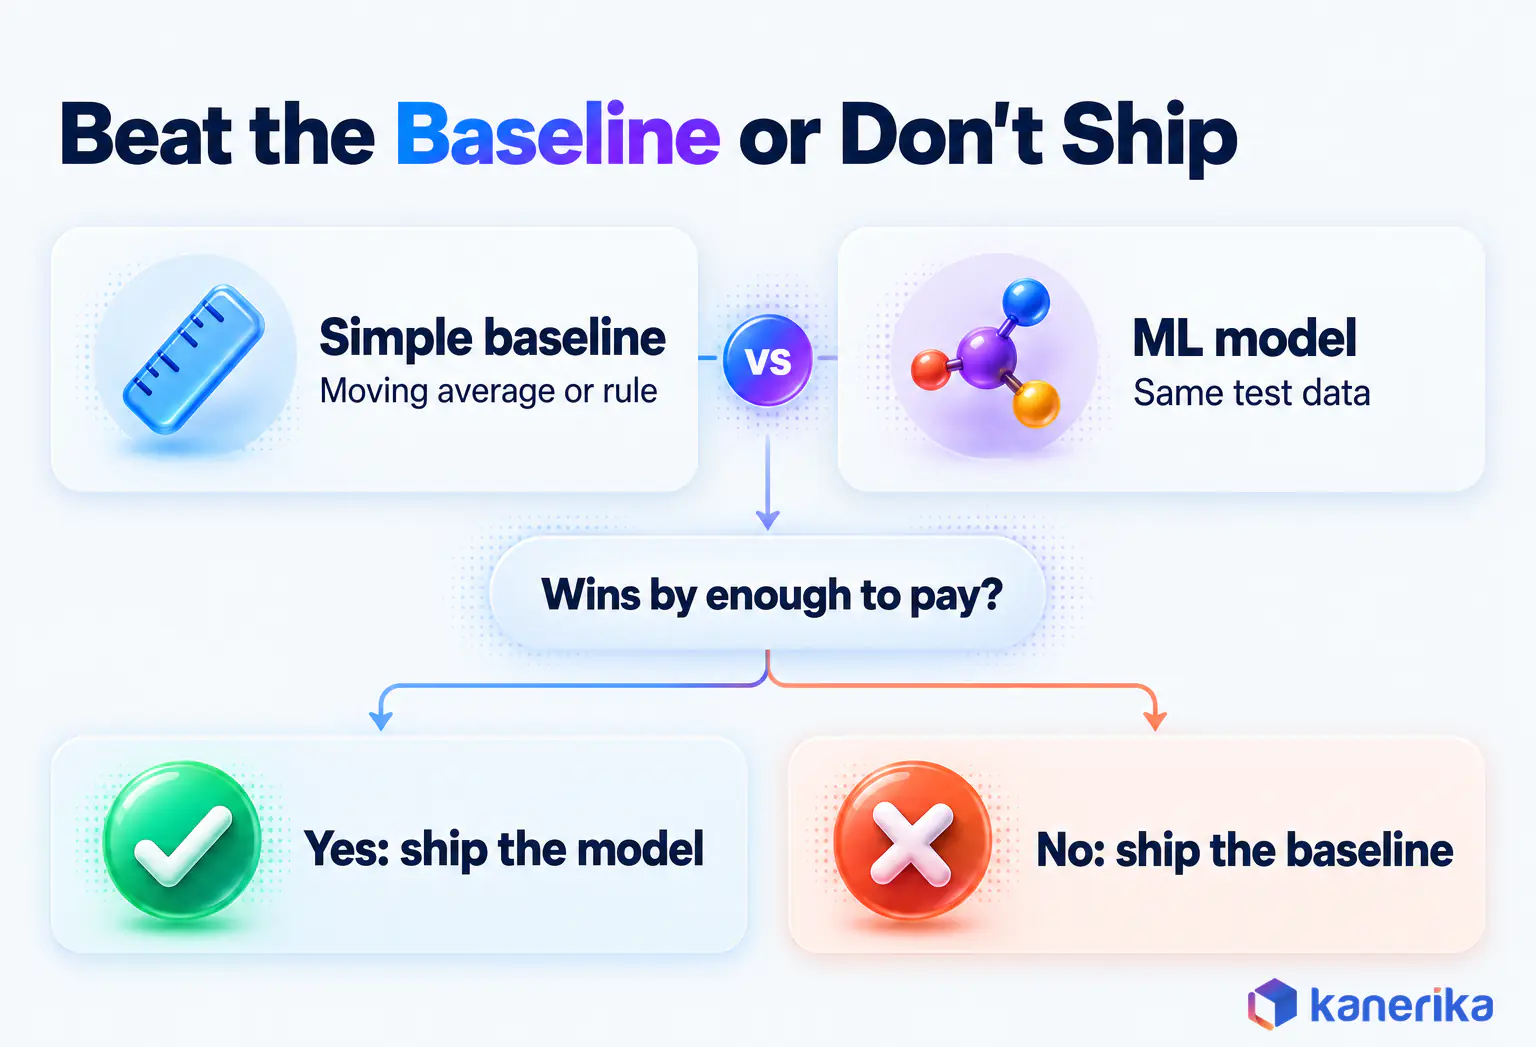
Write the baseline’s score into the project brief before training starts. It keeps the team honest when a complex model looks impressive in a demo but adds little on the numbers that matter.
Where Generative AI Fits
Large language models such as ChatGPT generate text, so they are not built to return calibrated numeric predictions from tables. Still, they help predictive work in two places.
First, an LLM can turn unstructured text such as call notes, emails or claim descriptions into inputs a model can use. Second, it can explain a score in plain language for the person who has to act on it. The prediction itself still comes from a task-specific model trained on your labeled history.
Five Prediction Tasks and the Model Families That Fit Them
The fastest way to choose a model is to name the prediction task first, because the task narrows the model family before anyone compares algorithms. A team that asks “how much will this claim cost?” needs a different tool from a team that asks “which claims look odd?”.
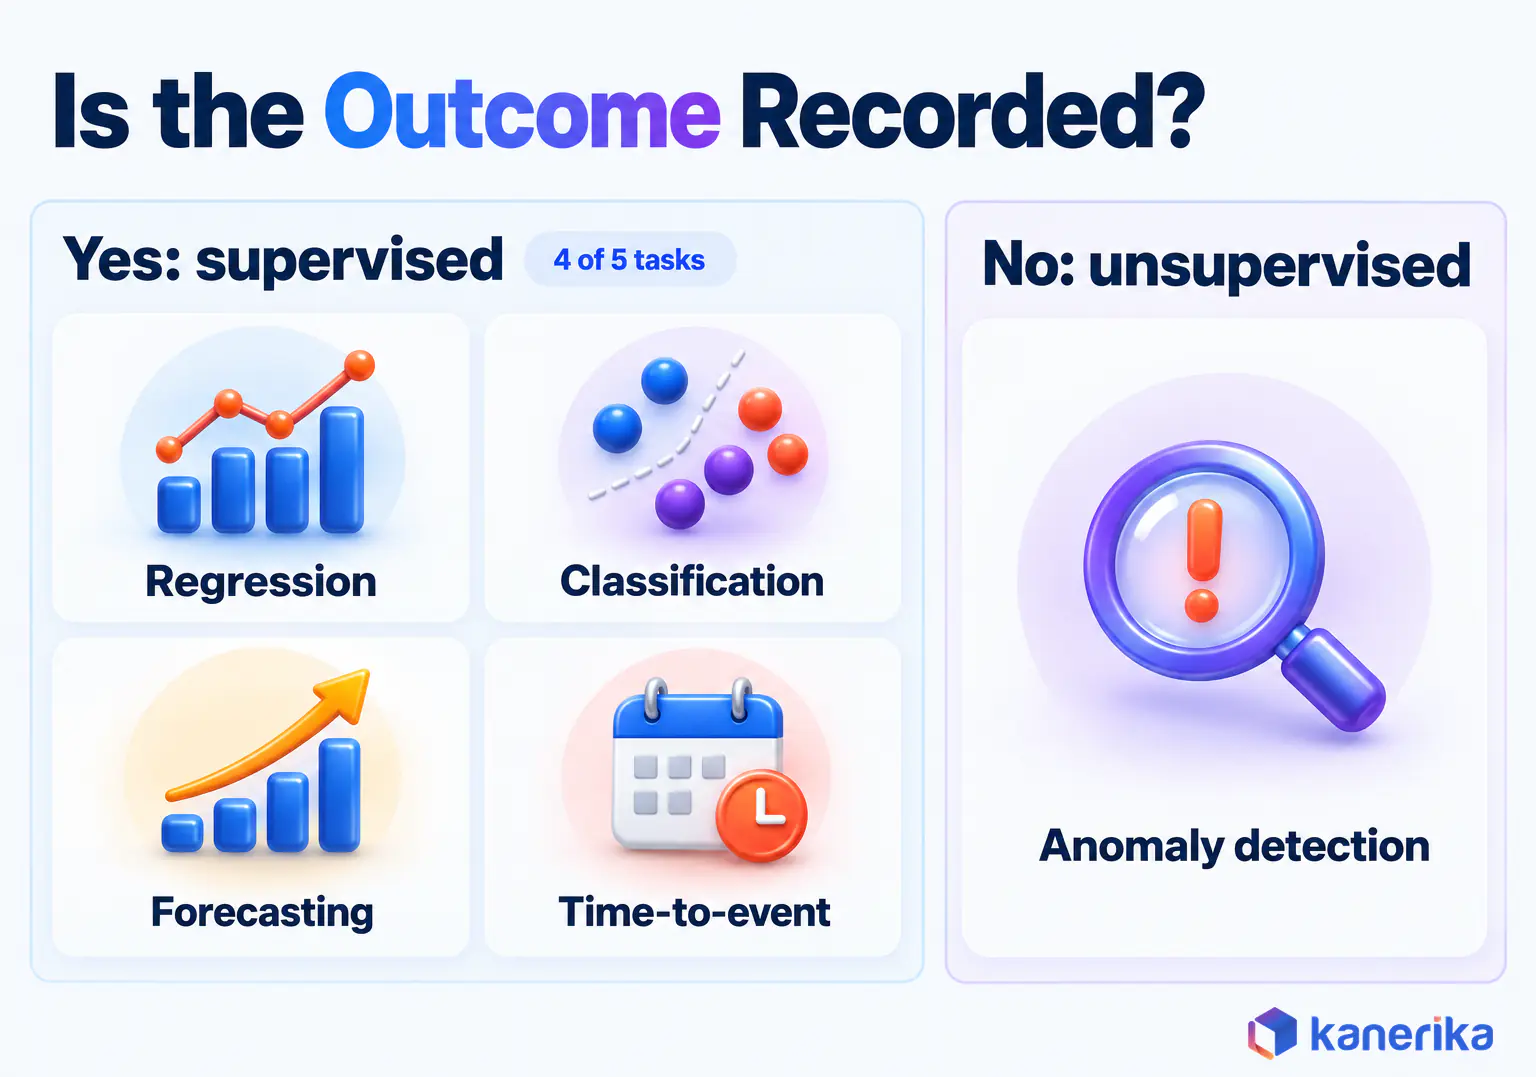
Four of the five tasks below are supervised learning. In other words, the history already records the outcome you want to predict, such as whether a customer left. Anomaly detection is usually unsupervised, because fraud and faults are rare and often unlabeled.
| Task | Business question | Model families | Output | Example |
|---|
| Regression | How much? | Linear and regularized regression, gradient-boosted trees | A number | Claim cost, customer lifetime value |
| Classification | Which one, or how likely? | Logistic regression, random forest, XGBoost, LightGBM | A class or probability | Churn, loan default, fraud flag |
| Time-series forecasting | What will the level be next week or month? | Exponential smoothing, ARIMA, gradient boosting on lagged values | A value per future period | Demand, call volume, cash |
| Anomaly detection | What looks unusual? | Isolation Forest, autoencoders, clustering | An anomaly score | Suspicious claims, sensor faults |
| Time-to-event | When will it happen? | Survival models such as Cox regression and survival forests | A risk curve over time | Time to churn, time to part failure |
Regression: Predicting a Number
Regression predicts a continuous amount. An insurer might estimate the final cost of a claim at first notice, so adjusters can set reserves early instead of waiting for invoices. A reserve set too low hides cost that surfaces later, while one set too high ties up capital the business could use elsewhere.
Linear and regularized regression give a transparent starting point, since each coefficient shows how much one input moves the estimate. Gradient-boosted trees, however, usually capture more of the pattern when costs depend on many interacting inputs.
Classification: Predicting a Category or Probability
Classification predicts a category, and most models also return the probability behind it. Churn, loan default and fraud are the classic examples. Logistic regression is the honest first model because its weights are easy to read. Random forests, XGBoost and LightGBM, however, often rank cases better on messy business data.
The probability usually matters more than the label. For example, a retention team with budget for 500 calls wants the 500 customers most likely to leave. That is a ranking problem rather than a yes or no.
Time-Series Forecasting
Forecasting predicts a value for each future period, so the order of the data carries meaning. Seasonality, holidays, recent lags and the forecast horizon all shape the model. For instance, a store-level demand forecast for next week behaves very differently from a twelve-month budget forecast.
Exponential smoothing remains a strong baseline, and gradient boosting with lag features often wins when many related series share patterns. Method choice deserves its own guide, so see our overview of AI forecasting methods for the full comparison.
Anomaly Detection
Anomaly detection looks for cases that do not fit the normal pattern, such as an odd claim. It suits problems where the target is rare or labels are thin. Think of a new fraud scheme, or a machine that starts to vibrate differently.
Isolation Forest isolates outliers with random splits, and autoencoders learn to rebuild normal records, then flag the ones they rebuild badly. Clustering groups similar cases so analysts can spot the odd group out. Our guide to AI in fraud detection covers these methods in more depth.
Scores from these models usually feed a human review queue rather than an automatic block. An investigator checks the highest-scoring claims first. Then each confirmed case becomes a label that can train a supervised model later. Kanerika used this pairing of Isolation Forest and autoencoders in an insurer’s fraud program, described in the Kanerika section below.
Case Study
33% Fewer Financial Fraud Losses with AI Modeling & Forecasting
A US mid-sized insurer used Isolation Forest and autoencoder models from Kanerika to cut financial losses by 33% and overall risk exposure by 25%.
Read the Case Study →
Time-to-Event Prediction
Some questions are about timing rather than yes or no. Survival models, borrowed from medical research, estimate how the risk of an event changes over time, so timing becomes the output. They also handle customers or machines that have not reached the event yet, which a plain classifier ignores.
For example, a subscription business can estimate when each customer is likely to leave. Plant teams also use the same idea to estimate remaining useful life. In predictive maintenance in robotic systems, for instance, the goal is to service a part before it fails.
Why Gradient-Boosted Trees Are the Default for Tabular Data
In practice, most business prediction runs on tables, with one row per customer, claim or order and columns for history and attributes. On that kind of data, tree ensembles are still the strongest starting point.
A NeurIPS 2022 benchmark by Grinsztajn, Oyallon and Varoquaux tested 45 datasets. It found that tree-based models such as XGBoost and random forests remained state of the art on medium-sized data of around 10,000 samples.
Deep learning, by contrast, earns its extra cost when the input is not a neat table. Images, free text, audio and long sensor sequences carry structure that neural networks learn directly, while trees need hand-made inputs. Very large datasets can also tip the balance, so test both approaches when you have millions of rows and the budget to tune.
| Start with gradient-boosted trees when | Consider deep learning when |
|---|
| Data is rows and columns from ERP, CRM or claims systems | Inputs are images, documents, audio or free text |
| You have thousands to hundreds of thousands of labeled rows | You have millions of examples or long sequences per case |
| Columns mix numbers and categories | Raw signals need learned representations |
| Users need a reason behind each score | The task tolerates less direct explainability |
| You need a strong model in days | You have GPU budget and time to tune |
How Machine Learning in Predictive Analytics Gets Built: Six Steps
A predictive model is built in six steps, and the steps around the algorithm decide whether it works in production. For example, teams that start by picking an algorithm often discover late that the target was vague or the data leaked.
Working through the steps in order keeps each choice tied to the decision the model serves. Each step below also says what to do and what goes wrong when it is skipped.
1. Define the Target, the Decision and the Horizon
Before training anything, write down exactly what you predict, who acts on it and how far ahead. “Customers who cancel within 90 days of the scoring date” is a target, while “churn” on its own is not. The horizon must also leave enough time for the action, such as a retention call, to work.
- Example: A retailer may want to predict customer churn to design targeted retention efforts or a student exploring similar real-world use cases might wonder, can someone write my research paper for me to better understand these applications in depth and present them academically.
For churn, a usable spec is short. Score every active customer each Monday and predict cancellation within 90 days. Then route the top 80 or so each week, about 1,000 a quarter, to the retention team.
2. Build Point-in-Time Features
Every feature must use only data that existed when the score was produced. A field such as “cancellation reason” leaks the answer, because someone fills it in after the customer leaves. Good feature engineering turns raw events into safe inputs, such as purchases in the 30 days before the scoring date.
So build features as snapshots in time, which is where data volume and pipelines start to matter. Our guide to big data and predictive analytics covers that infrastructure side.
3. Train a Baseline First
Start with the simple method from earlier, such as a rule, a moving average or a logistic regression, and record its score. Then every later model is judged against this number, not against zero.
Record that score on the same time-ordered test window used in step 4. A baseline scored on a different or shuffled window can make a new model look better simply because its test data was easier.
4. Validate on Time-Ordered Splits
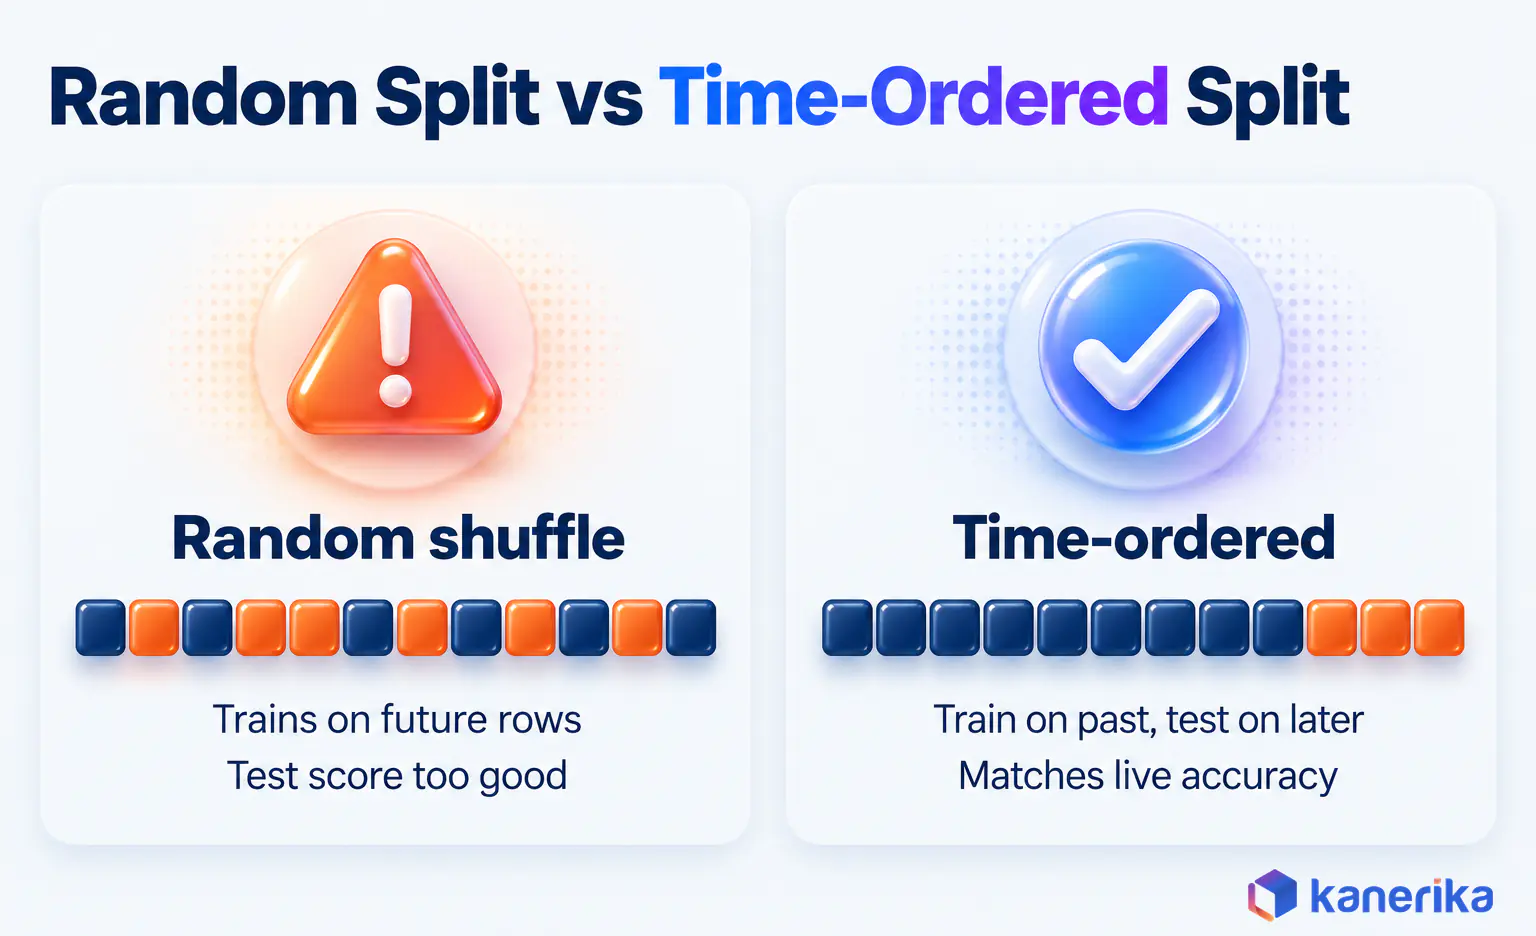
Random cross-validation shuffles rows, so a model can train on next month and test on last month. The scikit-learn documentation for TimeSeriesSplit calls standard cross-validation inappropriate for time-ordered data for exactly this reason. Train on older periods, test on later ones and repeat across several windows.
from sklearn.model_selection import TimeSeriesSplit, cross_val_score
from lightgbm import LGBMClassifier

# X and y are sorted by scoring date, oldest rows first
cv = TimeSeriesSplit(n_splits=5)
model = LGBMClassifier(n_estimators=300, learning_rate=0.05)
scores = cross_val_score(model, X, y, cv=cv, scoring="roc_auc")
print(scores.round(3))
If the time-ordered score sits far below a random-split score, the gap usually points to leakage or a pattern that does not hold over time. Fix the cause before tuning anything.
5. Deploy Into the Workflow
Choose batch or real-time scoring based on the decision. A weekly retention list needs batch scoring, while a card payment check needs a score in milliseconds.
Then put the output where people already work, such as the CRM queue or the claims screen. A separate dashboard that nobody opens is how accurate models end up changing nothing. Plan this hand-off while the model is still an AI pilot, not after it succeeds.
6. Monitor Drift and Retrain on Evidence
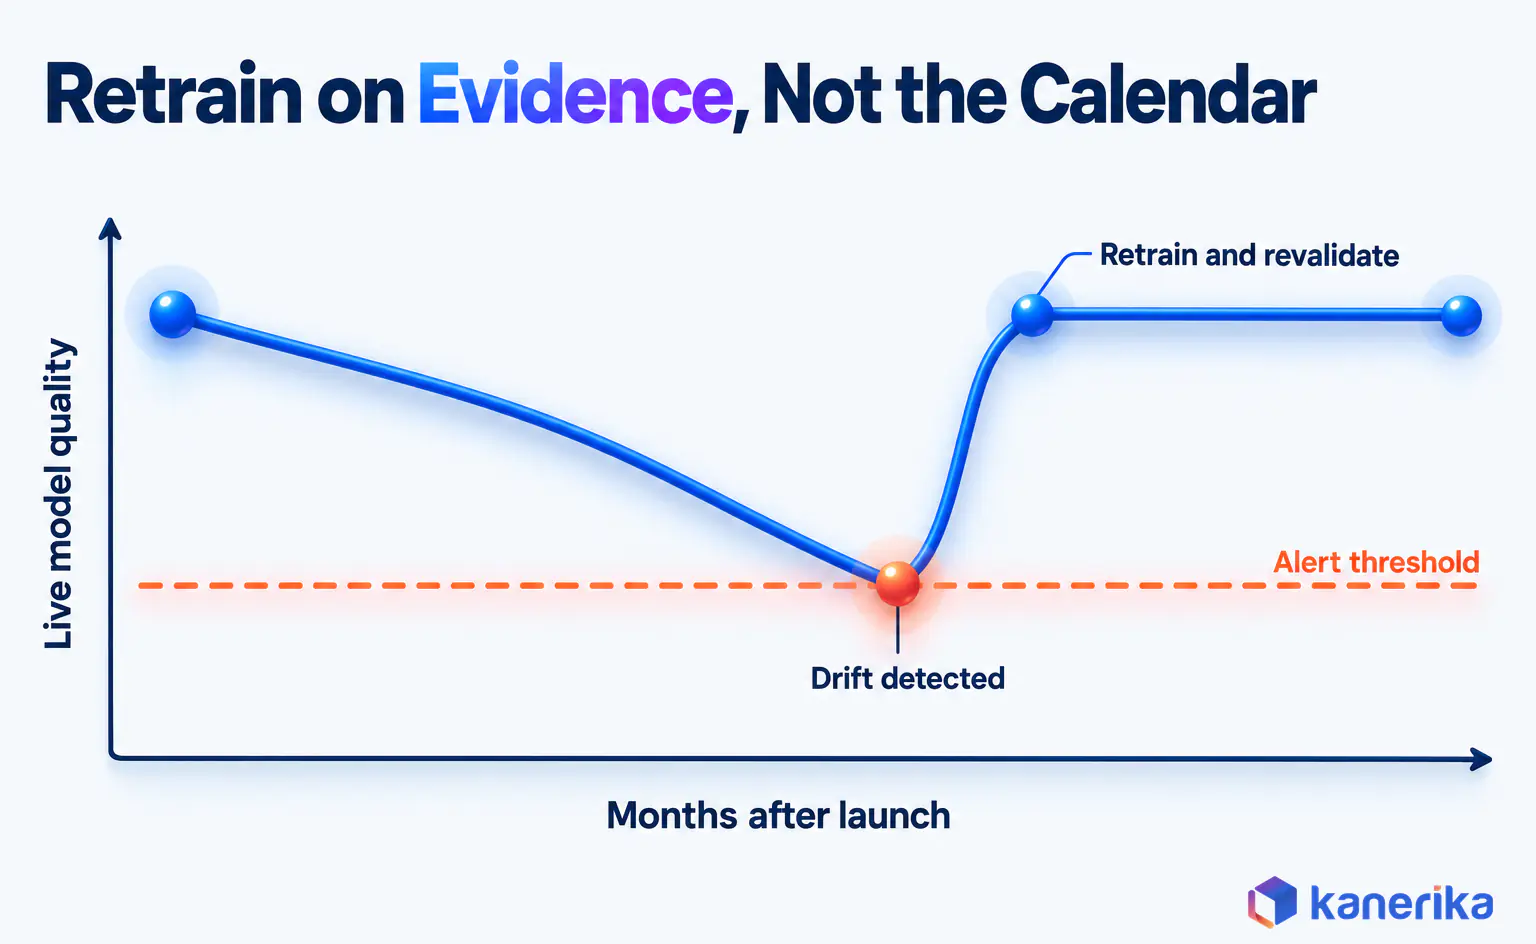
Track input distributions, prediction distributions and, once outcomes arrive, real accuracy. Set a threshold that triggers retraining, then validate the new model against the old one before you swap them.
Suppose a price change shifts which customers cancel. Real churn outcomes take 90 days to arrive, but the share of customers scored as high risk can move within weeks. That is why input and prediction drift act as the early alarm, while measured accuracy confirms the problem later.
Measuring Accuracy and Business Value
A model can score well on a technical metric and still lose money, so measure it twice. Check its statistical quality first, then check its effect on the business.
Accuracy alone misleads whenever the outcome is rare. If 1,000 of 10,000 customers churn, a model that predicts “stays” for everyone is 90% accurate and catches no churners at all.
A ranked model that puts 400 of those 1,000 churners into its top 10% is far more useful, even if its accuracy figure looks similar. That top slice holds four times the churners a random list of the same size would hold.
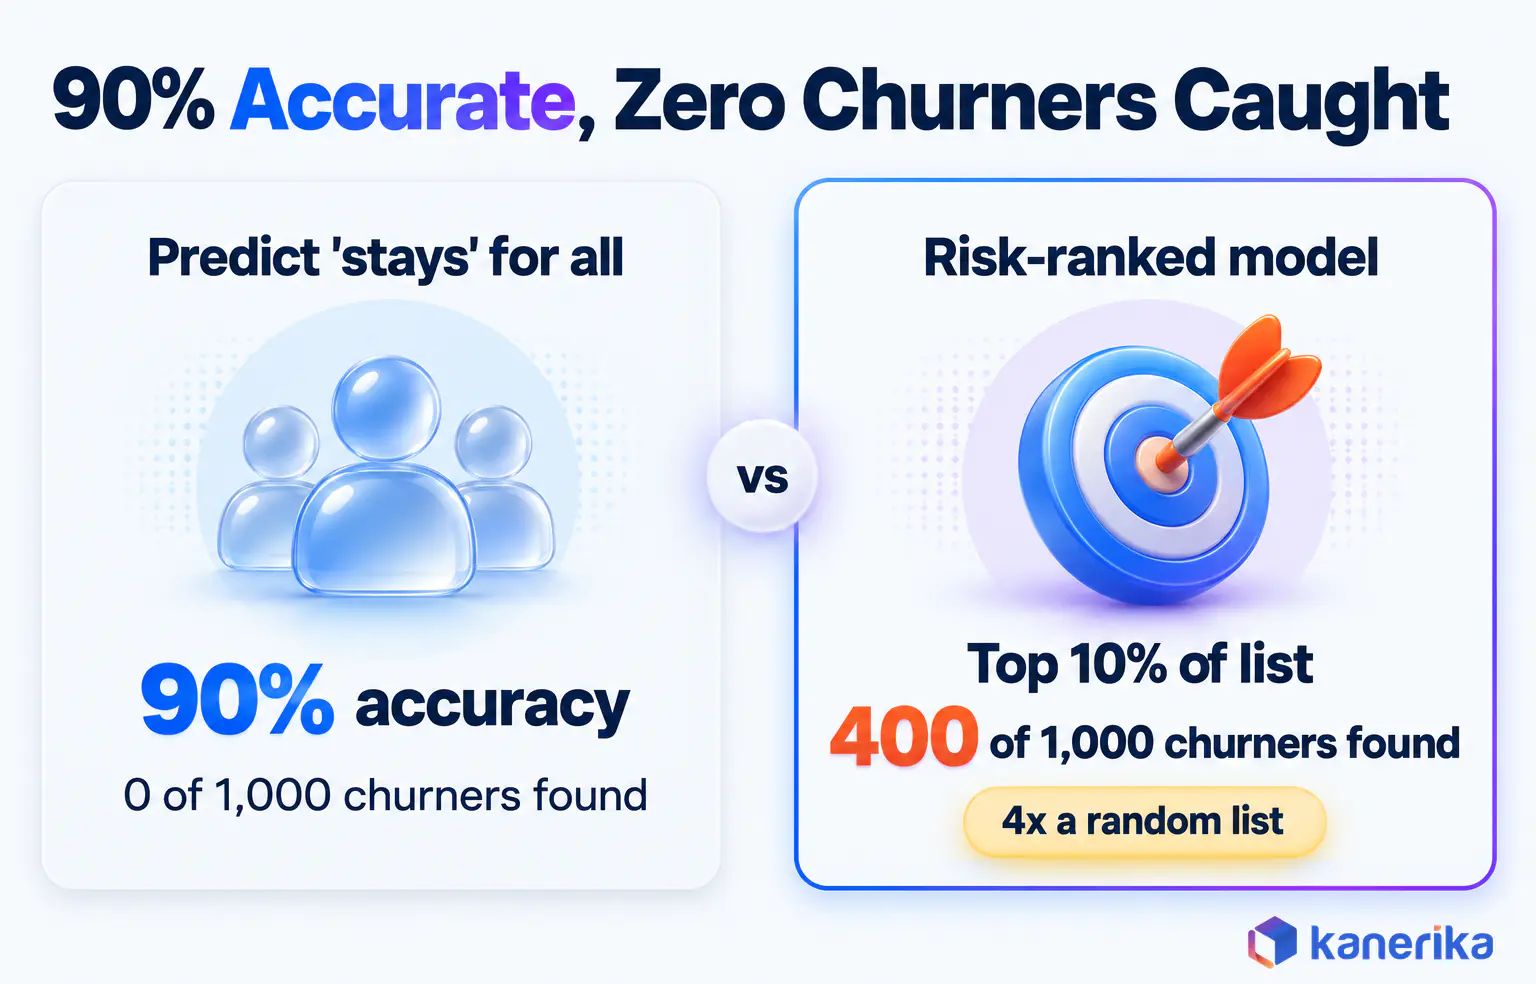
Pick metrics that match the task, then translate each one into the language of the decision it supports. The table pairs common metrics with the business question they answer.
| Task | Metric | What it means for the business |
|---|
| Regression | MAE, MAPE | Average size of the error in dollars or units, or as a percentage |
| Classification | AUC | How well the model ranks real cases above the rest |
| Classification | Precision and recall | Share of flagged cases that are real, and share of real cases you flag |
| Classification | Calibration | Whether a 30% score means about 30% of such cases happen, which matters when scores set prices or reserves |
| Any ranked list | Lift | How many more real cases the top of the list holds than a random list of the same size |
| Business case | Net value | Gains from changed decisions minus the cost of acting and of running the model |
Return on investment follows the same logic. Count only the decisions the model changed, value what those decisions produced, and subtract the cost of acting and of running the model. A churn model that flags customers who would have stayed anyway adds nothing.
Worked Example: Choosing a Model for Customer Churn
Here is how the steps and metrics come together on one decision. The numbers are illustrative assumptions, not a client result, so the arithmetic is easy to follow.
A subscription company has 10,000 active customers, and about 10% cancel within 90 days. The retention team can call 1,000 customers per quarter, and each call with an offer costs about $20. A saved customer is worth roughly $600 in margin, and the offer keeps about one in four churners who receive it.
- Define the target as cancellation within 90 days of each Monday scoring run.
- Build features from billing, product usage and support history, including ticket sentiment scored with AI sentiment analysis of support conversations.
- Set the baseline as a rule that flags customers with a recent complaint and a contract ending within 60 days.
- Train a logistic regression and a gradient-boosted model, validated on the last four quarters in time order.
- Compare all three on the 1,000 customers each one would call.
| Approach (illustrative) | Churners in the 1,000 called | Lift vs a random list | Customers saved (1 in 4) | Net value per quarter |
|---|
| Random list | 100 | 1.0x | 25 | -$5,000 |
| Baseline rule | 220 | 2.2x | 55 | $13,000 |
| Logistic regression | 340 | 3.4x | 85 | $31,000 |
| Gradient boosting | 400 | 4.0x | 100 | $40,000 |
What the Comparison Shows
Net value is customers saved times $600, minus $20,000 for the 1,000 calls. Gradient boosting wins on this data, but look at where the money comes from.
Moving from the rule to logistic regression adds $18,000 a quarter, and moving on to boosting adds $9,000 more. If the boosted model needs a new platform or extra staff to maintain, that $9,000 gap is the number to weigh against the cost.
In short, the example shows what works in miniature: a clear target, a baseline, honest validation and a decision with a price attached.
AI Assessment
Is Your Data Ready for Predictive Models?
Take Kanerika’s AI maturity assessment to see where your data, governance and teams stand before you commit to a predictive analytics build.
Take the Assessment →
Where ML Prediction Pays Off by Industry
The same five tasks appear in every industry. What changes, however, is the decision the score feeds and the KPI that proves it worked.
Read the table from right to left. Start with the KPI you need to move, then check whether a prediction would change the decision behind it.
| Industry | Prediction | Decision it feeds | KPI |
|---|
| Retail | Which customers will lapse; demand per store and item (see predictive analytics in retail) | Targeted offers, replenishment | Repeat purchase rate, stockouts |
| Healthcare | Readmission risk after discharge (see predictive analytics in healthcare) | Follow-up calls and care plans | 30-day readmission rate |
| Supply chain | Supplier delays and demand shifts (see predictive analytics in supply chain) | Safety stock and reorder timing | Fill rate, expedite cost |
| Banking and lending | Probability of default (see AI in finance use cases) | Credit limits and pricing | Default rate, approval rate |
| Insurance | Suspicious claims | Routing to investigators | Fraud losses, claim cycle time |
| Manufacturing | Time to part failure | Planned maintenance windows | Unplanned downtime |
Each row also pairs one prediction with one owner who acts on it. A project that scores everything for everyone has nobody accountable for the output, which is the churn story from the opening in another form.
Platforms for Building and Running Predictive Models
The best platform is usually the one where your data and your team already live. Moving data to fit a tool adds cost before any model trains. Each option below can train, track and deploy the model families covered earlier.
The differences lie in where data sits, how scoring runs and how models are governed once live. The capabilities listed come from each vendor’s own documentation. If the choice is between a visual ML tool and a lakehouse, our Dataiku vs Databricks comparison covers it.
| Platform | Best fit | Documented capability |
|---|
| Microsoft Fabric | Teams already on OneLake and Power BI | Built-in MLflow experiment tracking; the PREDICT function scores MLflow models in batch, including LightGBM, XGBoost, scikit-learn and Prophet flavors |
| Azure Machine Learning | Enterprises that want managed MLOps on Azure | Tools to monitor, retrain and redeploy models; accepts PyTorch, TensorFlow and scikit-learn models |
| Databricks | Lakehouse teams with large data and Spark skills | MLflow 3 on Databricks for experiment tracking, evaluation, a production model registry and deployment, governed by Unity Catalog |
| Snowflake ML | SQL-first teams with data in Snowflake | Feature Store with incremental refresh, Model Registry for inference at scale, ML Observability and Explainability |
| Open-source Python | Small teams and proofs of concept | scikit-learn, XGBoost and LightGBM run anywhere; tracking and deployment must be added separately |
Pick on fit, then confirm one detail early: how batch or real-time scores will reach the system where the decision is made. That integration path decides delivery time more often than the modeling work does.
Datasheet
Snowflake vs Databricks vs Microsoft Fabric
A side-by-side datasheet from Kanerika comparing the three platforms where most predictive models are trained, tracked and scored.
View the Datasheet →
Challenges of Machine Learning in Predictive Analytics
Algorithms are rarely the weak link in predictive ML. The hard problems sit around the model: the data it learns from, the world it predicts and the people who must trust it.
Gartner predicted in February 2025 that through 2026, organizations will abandon 60% of AI projects unsupported by AI-ready data. Predictive models are exposed to that risk because they learn whatever sits in the history, gaps and errors included.
- Data leakage. A feature carries information from after the scoring date, so test scores look excellent and live scores collapse.
- Drift. Customer behavior, prices or processes change, and yesterday’s pattern stops holding.
- Bias. Historical decisions encode past practice, so a model can repeat unfair outcomes for some groups unless you test each subgroup.
- Explainability. Users and regulators may need the reason behind a score, not only the score. Our guide to explainable AI techniques covers the main methods.
- Data readiness. Missing history, inconsistent definitions and siloed sources cap the quality of any model, which is why data preprocessing comes before training.
For governance, the NIST AI Risk Management Framework gives teams a shared structure for mapping, measuring and managing these risks. NIST released it on January 26, 2023, for voluntary use. Versioning, approvals and monitoring tools are covered in our guide to managing models in production.
Drift deserves special attention because it is silent. Teams that already track data reliability on their pipelines can extend the same checks to model inputs. Nothing breaks, no error appears, and the scores simply grow less useful each month until someone measures them against real outcomes.
Common Mistakes to Avoid
The six steps above already guard against the classic errors, such as random splits and a missing baseline. Three further mistakes slip past them, and each is cheap to prevent early but expensive to discover after launch.
- No subgroup bias test. A model that looks fair overall can still score one region or age group far worse, so test each subgroup before launch.
- Uncalibrated scores used for prices or reserves. A model can rank cases well while its 30% score means 15% in practice. Any price or reserve set from that score is then wrong.
- No owner for the output. When nobody is accountable for acting on the scores, they end up in a report that nobody reads.
How Kanerika Takes Predictive ML From Pilot to Production
Kanerika builds predictive models as decision tools, so each engagement starts with the decision and ends with monitoring in production. Our predictive analytics services run the six steps above as one engagement, starting with a data-readiness check and a baseline.
A US mid-sized insurer that was expanding its operations needed stronger fraud detection, risk evaluation and credit scoring. Kanerika implemented Isolation Forest and autoencoder models to flag suspicious activity, along with risk assessment models.
The data foundation mattered as much as the algorithms. The insurer was expanding with limited resources, and weak credit assessment was raising its default risk. Its data was stored on Azure Data Lake behind multi-factor authentication, and the Microsoft pay-as-you-go model kept storage costs in check. Microsoft tools also took over data transfer and report generation, which cut manual effort for the team. This is the data-readiness step from the six steps, applied on a real program.
The program delivered a 33% decrease in financial losses, a 25% reduction in overall risk exposure and a 37% increase in the customer base. The full story is in the fraud detection case study.
Kanerika Service
Predictive Analytics Services
Kanerika defines the decision, checks data readiness, builds a baseline first and deploys scores into the systems your teams already use, with drift monitoring after launch.
Explore Predictive Analytics
What Works in 2026: The Short Answer
Machine learning pays off in prediction when the method follows the decision. Name the task, start with gradient-boosted trees on tabular data, and keep deep learning for images, text and long sequences.
Prove each model against a simple baseline on time-ordered tests, then measure it in lift and net value. Deliver the score where someone can act in time, and retrain when drift says so.
Before anyone trains a model, write down the decision, the baseline score and who receives the scores. Doing that this week is what makes machine learning in predictive analytics work in 2026: every model starts tied to a decision.
Frequently Asked Questions
What is machine learning in predictive analytics?
It is the use of trained models to estimate future outcomes from historical data. The model learns patterns linking past inputs to known results, such as which customers cancelled. It then scores new cases with a number, a class or a probability. Teams use those scores to decide where to act first, from retention calls to fraud reviews.
How is machine learning used in predictive analytics?
Machine learning powers the prediction step. Teams define a target such as churn within 90 days, build features from history, and train a model that scores each new case. The scores then feed a decision, such as which claims to review or which customers to call. Monitoring and retraining keep the model accurate as behavior changes.
What are the steps in predictive analytics?
A typical project runs six steps. Define the target, the decision and the horizon. Build point-in-time features that use no future data. Train a simple baseline first. Validate candidate models on time-ordered splits. Deploy the scores into the workflow where people act. Monitor drift and retrain when performance drops below an agreed threshold.
What data is needed for machine learning predictive analytics?
You need historical records that include the outcome you want to predict, plus the inputs known before it happened. For churn, that means past cancellations alongside billing, usage and support history. Each feature must reflect what was known on the scoring date. Consistent definitions and enough examples of the outcome matter more than sheer volume.
How much historical data do you need for a predictive model?
There is no fixed minimum, because it depends on how rare the outcome is and how many inputs you use. A useful rule is to have hundreds of examples of the outcome itself, not just many rows. Time-ordered data should also cover full seasonal cycles, so a yearly pattern needs more than one year.
How accurate are machine learning predictive models?
Accuracy varies by problem, data quality and horizon, so no general figure is meaningful. Judge a model on time-ordered tests against a simple baseline. Use metrics that fit the task, such as MAE for amounts or AUC, recall and lift for rankings. Plain accuracy misleads on rare outcomes like fraud, where predicting none looks accurate.
How do you measure the ROI of predictive analytics?
Count only the decisions the model changed, then value the outcomes those decisions produced. Subtract the cost of acting, such as retention offers or investigator time, and the cost of building and running the model. Compare against what the baseline method would have achieved. A controlled test with a holdout group gives the cleanest answer.
How often should predictive models be retrained?
Retrain on evidence rather than a fixed calendar. Monitor input distributions, prediction distributions and real accuracy once outcomes arrive. When a metric crosses an agreed threshold, retrain on fresh data and validate the new model against the current one before swapping. Fast-changing domains such as fraud may need frequent updates, while stable processes need fewer.
What are the main risks of machine learning in predictive analytics?
The biggest risks are data leakage, drift, bias, weak explainability and poor data readiness. Leakage makes test results look better than live results. Drift erodes accuracy as behavior changes. Bias can repeat unfair past decisions. Frameworks such as the NIST AI Risk Management Framework help teams map, measure and manage these risks consistently.
Can LLMs like ChatGPT do predictive analytics?
ChatGPT is a generative AI model built on machine learning, and it is designed to produce text rather than calibrated numeric forecasts. It can help predictive work by extracting features from notes or emails and by explaining scores in plain language. The prediction itself should still come from a model trained on your own labeled history.
How is machine learning used in predictive maintenance?
Models learn from sensor readings, maintenance logs and failure history to estimate when a part is likely to fail. Survival models estimate remaining useful life, while anomaly detection flags unusual vibration or temperature patterns. Maintenance teams then schedule repairs before breakdowns occur. Success is measured in reduced unplanned downtime and fewer emergency repairs.
Which industries use machine learning for predictive analytics?
Nearly every industry with good historical data uses it. Retailers predict demand and lapsing customers. Hospitals estimate readmission risk. Banks score default probability, and insurers flag suspicious claims. Manufacturers predict part failures, and supply chain teams anticipate supplier delays. The common thread is a repeated decision that improves when it is made earlier.
What is the difference between machine learning and predictive analytics?
Predictive analytics is the full process of forecasting outcomes. It covers framing the question, preparing data, building a model, testing it and acting on the result. Machine learning is one engine inside that process, the part that learns patterns from data. You can do predictive analytics with simple statistics, and machine learning also has many non-predictive uses.
How does machine learning predict customer churn?
A classification model learns from past customers who stayed or left, using billing, usage, support and contract data. It scores each active customer with a probability of leaving within a set horizon, such as 90 days. Retention teams then contact the highest-risk customers first. Lift and saved revenue show whether the model works.
How long does it take to implement machine learning predictive analytics?
There is no universal timeline. Effort depends on how clear the decision is and how ready the historical data is. It also depends on how scores reach the workflow and what governance reviews apply. Data preparation and integration usually take longer than model training. A narrow pilot on one decision is the fastest way to prove value.
Can predictive analytics work without machine learning?
Yes. Moving averages, linear regression and business rules all produce useful predictions, especially for stable trends and small datasets. They are cheap, transparent and fast to build. Treat them as the baseline every machine learning model must beat. If a trained model cannot clearly outperform the simple method on the same test data, keep the simple method.
What are the main types of machine learning used for prediction?
Supervised learning does most prediction work, because the history records the outcome to predict. It covers regression for amounts, classification for categories, forecasting for time series and survival models for timing. Unsupervised learning, such as Isolation Forest or clustering, finds anomalies when labels are scarce. Deep learning adds neural networks for images, text and long sequences.
What are the four types of analytics?
The four types are descriptive, diagnostic, predictive and prescriptive analytics. Descriptive analytics reports what happened. Diagnostic analytics explains why it happened. Predictive analytics estimates what will happen next, usually with machine learning or statistical models. Prescriptive analytics recommends what to do about it, often by combining predictions with business rules, costs and optimization.
What is the difference between predictive and prescriptive analytics?
Predictive analytics estimates what is likely to happen, such as which customers may cancel next quarter. Prescriptive analytics goes one step further and recommends an action, such as which offer to make and to whom. Prescriptive systems usually take predictions as an input and add costs, constraints and business rules to choose the best response.
Which machine learning algorithm is best for predictive analytics?
No single algorithm wins everywhere, so choose by task and data. For tabular business data, gradient-boosted trees such as XGBoost or LightGBM are the usual first choice. Logistic and linear regression make strong, readable baselines. Deep learning suits images, text and long sensor sequences. Always compare candidates against a baseline on time-ordered validation.
What is the difference between regression and classification in predictive analytics?
Regression predicts a continuous number, such as the final cost of a claim or next month’s revenue per customer. Classification predicts a category, such as churn or no churn, and usually returns a probability too. Both are supervised learning. The right choice depends on whether the decision needs an amount or a ranked likelihood.
What are the main types of predictive models?
The main types follow the prediction task. Regression models estimate amounts, and classification models estimate categories or probabilities. Time-series models forecast values for future periods, and anomaly detection models flag unusual cases. Survival models estimate when an event is likely to happen. Each type includes simple and advanced versions, from linear regression to gradient-boosted trees.