Data is not just a resource for businesses anymore. It’s driving force behind innovation and success. The global datasphere is projected to reach a staggering 175 zettabytes by 2025, as per a report by IDC. That’s 175 trillion gigabytes of data – an amount so vast it’s mind-boggling. But here’s the real challenge: how do we unlock the value hidden within this ocean of information? This is where data analytics comes into picture. It’s a powerful field that’s transforming how businesses operate and make decisions.
We are currently living in an era where every decision we make, from marketing strategies to healthcare treatments, is powered by data-driven insights. Consider a scenario where your favorite online retailer can predict exactly what you’ll buy before you even know you need it, or a healthcare provider who can identify potential health risks years before symptoms appear. It’s the power of data analytics at work.
In 2024, data analytics continues to play an increasingly critical role in business decision-making processes. As the volume and complexity of data continue to grow, companies are leveraging advanced technologies like artificial intelligence and machine learning to extract valuable insights, drive innovation, and gain a competitive edge.
Table of Contents
- What is Data Analytics?
- What Are the Different Types of Data Analytics?
- Impact of Effective Data Analytics on Businesses
- Top Data Analytics Tools and Technologies
- Steps for Improving Your Data Analytics Strategy
- Top Trends Shaping Data Analytics in 2024 and Beyond
- FLIP: Data Analytics Made Easy for Businesses
- How Data Analytics Transforms Businesses Across Sectors
- Case Studies: Revolutionizing Businesses with Cutting-edge Data Analytics Solutions
- Kanerika: Your #1 Choice for Top-notch Data Analytics Solutions
- FAQs
What is Data Analytics?
Data analytics is the process of examining raw data to uncover meaningful insights, trends, and patterns that can be used to inform decision-making and drive business strategies. It involves applying various techniques, statistical algorithms, and tools to extract valuable information from datasets, both structured and unstructured.
What Are the Different Types of Data Analytics?
Data analytics can be broadly categorized into four main types, each serving a distinct purpose in the journey of understanding and utilizing data. Here’s a breakdown of the four main types:
1. Descriptive Analytics
Descriptive analytics involves the analysis of historical data to understand what happened in the past. The goal is to gain insights into past performance and trends. Descriptive analytics is often used to generate reports and visualizations that summarize data. Common techniques include calculating averages, creating basic reports, and visualizing data through charts and graphs.
2. Diagnostic Analytics
Diagnostic analytics involves the analysis of data to understand why something happened in the past. The goal is to identify the root cause of a problem or issue. Diagnostic analytics is often used to investigate specific incidents or issues that occurred in the past. Techniques include data mining, correlation analysis, and drill-down analysis.
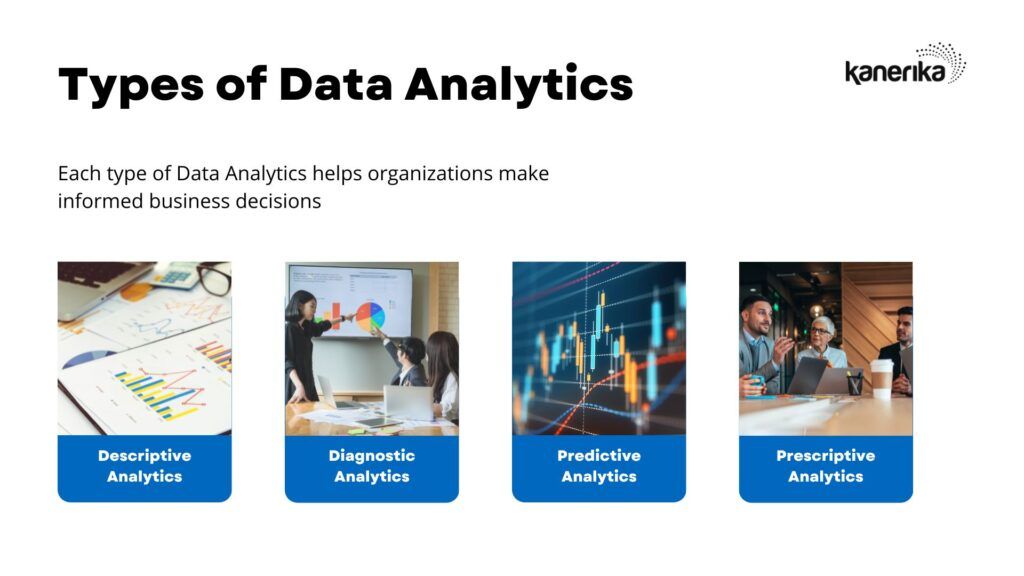
3. Predictive Analytics
Predictive analytics involves the use of data and statistical algorithms to make predictions about future events or outcomes. The goal is to identify patterns and trends in data that can be used to make predictions about what will happen in the future. Predictive analytics is often used for forecasting and trend analysis. Some commonly used techniques include regression analysis, machine learning algorithms, and forecasting models.
4. Prescriptive Analytics
Prescriptive analytics involves the use of data and analytical models to provide recommendations for actions that should be taken in the future. The goal is to optimize performance and achieve specific goals. Prescriptive analytics is often used for decision-making and planning. This is the most advanced type that goes beyond prediction to recommend specific actions. It leverages various models and simulations to suggest optimal courses of action based on different scenarios. Techniques include optimization algorithms, simulation modeling, and scenario planning.
Impact of Effective Data Analytics on Businesses
Effective data analytics is no longer a luxury, it’s a necessity for businesses of all sizes in today’s data-driven world. By harnessing the power of data, companies can gain a significant competitive edge and unlock a multitude of benefits. Let’s look at the transformative impact data analytics can have on businesses:
1. Enhanced Decision-Making
Data analytics empowers businesses to make informed decisions based on factual insights rather than intuition or guesswork. By analyzing historical data and current trends, companies can make strategic choices about product development, marketing campaigns, resource allocation, and more.
2. Improved Customer Understanding
Data analytics sheds light on customer behavior, preferences, and buying patterns. Businesses can leverage this knowledge to personalize customer experiences, target marketing campaigns more effectively, and ultimately boost customer satisfaction and loyalty.
3. Increased Operational Efficiency
Data analytics helps businesses identify inefficiencies and bottlenecks within their operations. By analyzing data on production processes, resource utilization, and employee performance, companies can streamline workflows, optimize resource allocation, and ultimately improve overall efficiency.
4. Reduced Costs and Risks
Data analytics can help businesses identify and mitigate potential risks. By analyzing financial data and customer behavior, companies can identify potential fraud patterns, predict equipment failure, and make proactive decisions to minimize financial losses.
5. Innovation and Competitive Advantage
Data analytics fuels innovation by providing valuable insights into market trends and customer needs. Businesses that leverage data effectively can develop new products and services that meet customer expectations and stay ahead of the competition.
6. Data-driven Culture
Effective data analytics fosters a data-driven culture within an organization. This means employees at all levels make decisions based on data and insights, leading to a more collaborative and results-oriented environment.

Top Data Analytics Tools and Technologies
1. Data Collection and Preparation:
Web Scraping Tools: These tools extract data from websites, social media platforms, and other online sources. (e.g. Scrapy, Beautiful Soup)
Data Integration Tools: These platforms consolidate data from various sources into a single, unified format. (e.g. Informatica PowerCenter, Talend Open Studio)
ETL/ELT Tools: Extract, Transform, Load (ETL) or Extract, Load, Transform (ELT) tools automate the process of data extraction, transformation, and loading into a data warehouse or data lake. (e.g. Apache Kafka, Fivetran)
2. Data Warehousing and Management:
Data Warehouses: These centralized repositories store large datasets for historical analysis and reporting. (e.g. Amazon Redshift, Microsoft Azure Synapse Analytics)
Data Lakes: These flexible storage repositories house large volumes of structured, semi-structured, and unstructured data. (e.g. Amazon S3, Microsoft Azure Data Lake Storage)
Data Governance Tools: These tools ensure data quality, consistency, and security within an organization. (e.g. Collibra, Informatica Enterprise Data Catalog)
3. Data Analysis and Visualization:
Data Analysis Languages: Python (with libraries like Pandas, NumPy) and R are popular languages used for statistical analysis and data manipulation.
Business Intelligence (BI) Tools: These user-friendly platforms facilitate data exploration, reporting, and dashboard creation. (e.g. Tableau, Power BI, QlikView)
Data Visualization Tools: These tools create visually appealing charts, graphs, and other visual representations of data. (e.g. Matplotlib, Seaborn, Tableau)
4. Machine Learning and Advanced Analytics:
Machine Learning Libraries: Libraries like TensorFlow, PyTorch, and scikit-learn provide tools for building and deploying machine learning models.
Artificial Intelligence (AI) Platforms: These platforms offer pre-built AI capabilities for tasks like image recognition and natural language processing. (e.g. Google Cloud AI Platform, Amazon SageMaker)
Big Data Analytics Platforms: These platforms are designed to handle and analyze massive datasets efficiently. (e.g. Apache Hadoop, Apache Spark)

Steps for Improving Your Data Analytics Strategy
Improving data analysis strategy involves several key steps and considerations:
1. Define Your Business Objectives
Before investing in any tools, it’s essential to define what you want to achieve with data analytics. This will help you identify the types of data and analytics you need, as well as the most appropriate tools to use.
2. Collect relevant data
To conduct effective data analysis, you need to collect relevant data. This may include internal data from your company’s operations, as well as external data from sources such as social media, market research, and customer feedback.
3. Clean and Process the Data
Data must be cleaned and processed before analysis can take place. This involves removing any errors, inconsistencies, or irrelevant data from your dataset.
4. Choose Appropriate Data Analytics Tools
There are many tools available, ranging from basic spreadsheets to advanced software platforms. Choose tools that are appropriate for your business needs, budget, and technical expertise. FLIP is an ideal zero-code data analytics tool.
5. Apply the Right Analytics Techniques
Different analytics techniques are suitable for different types of data and business objectives. For example, descriptive analytics can be used to understand past trends, while predictive analytics can help you forecast future outcomes.
6. Continuously Evaluate and Refine Your Analytics Strategy
Data analytics is an ongoing process, and you should continually evaluate and refine your analytics strategy to ensure it meets your evolving business needs.

Top Trends Shaping Data Analytics in 2024 and Beyond
As we look ahead to 2024, the scope of data analytics is poised for unprecedented growth and innovation. Advancements in technology, such as adaptive artificial intelligence, Natural language processing, and edge computing, are revolutionizing how data is collected, processed, and utilized. This convergence of data and technology opens a world of opportunities for businesses and professionals in the data analytics field.
1. Adaptive AI
An adaptive AI system is an artificial intelligence framework that adapts to changes in its environment or data inputs and continuously improves its performance. Unlike traditional AI systems, which are often static and pre-programmed, adaptive AI systems learn from new data inputs and adjust their algorithms and decision-making processes accordingly. A self-driving car is the best example of adaptive AI.
Adaptive AI systems typically use machine learning techniques like neural networks or reinforcement learning to analyze data and make predictions or decisions. Unlike static AI, adaptive AI systems learn from their mistakes and adapt to changing conditions.
2. Natural Language Processing
NLP is an emerging field of computer science that focuses on enabling computers to understand, interpret, and generate human language. Almost 90% of the available data is unstructured. To glean value from terabytes of unstructured data generated daily, data analytics needs to integrate NLP.
NLP is focused on developing algorithms and models that allow computers to process and analyze large volumes of text data, similar to how humans understand language. Google search already utilizes NLP in a big way to interpret search queries.
3. Edge Computing
Edge computing is a distributed computing environment that brings computing resources and data storage closer to the location where they are needed. Traditional computing heavily relies on centralized data center or cloud computing infrastructure. In edge computing, resources are placed close to the devices and sensors that generate the data.
The main objective is to reduce latency and bandwidth requirements while increasing the speed and efficiency of data processing.
4. Cloud Native Architecture
Cloud native is a software development approach designed to utilize cloud computing architecture. This architecture offers many benefits to organizations, including improved scalability, faster time-to-market, reduced infrastructure costs, and increased reliability and resilience.
Cloud native applications are built using a modular architecture. This approach breaks down the application into smaller, independent services with functionality and data storage.
5. Self-Service Data Analytics
Self-service data analytics is a novel approach to data analysis. It empowers business users to perform data analysis and visualization tasks without requiring assistance from IT or data scientists. Otherwise, it is also known as the zero-code or low-code approach to data analytics.
The most significant benefit of this approach lies in improved data accuracy and quality. This enables users to spot and correct errors in real time. IT personnel and data scientists can devote more time handling core tasks than generating reports and creating dashboards. Self-service data analytics tools typically include user-friendly interfaces that allow users to interact with data visually and intuitively.
6. Quantum Computing
While still in its early stages, Quantum Computing has the potential to revolutionize data analytics. Quantum computers can process massive datasets much faster than traditional computers, opening doors for more complex analysis and simulations.
Traditional computers process information using bits, which can either be a 0 or a 1. Quantum computers, on the other hand, leverage the principles of quantum mechanics to utilize qubits. Qubits can exist in a state of superposition, meaning they can be both 0 and 1 simultaneously. This unique property allows quantum computers to perform calculations in parallel, exponentially increasing processing power for specific tasks.

FLIP: Data Analytics Made Easy for Businesses
FLIP is a business intelligence and data analytics tool that has gained popularity due to its zero-code interface and affordable features.
With its broad range of data source integrations, intuitive user interface, and automated workflows, FLIP is a valuable tool for any organization that needs to make sense of its data but does not have the resources or expertise to implement a complex data analytics solution.
Here are some distinct advantages of using FLIP:
- FLIP is pre-configured with industry templates allowing businesses to churn out data from the first day. Companies can leverage their data to optimize their business processes with minimal integration.
- FLIP’s potential for reducing overall DataOps costs for businesses is significant, with the ability to fully automate data management requirements and minimize dependence on third-party developers and data engineers, resulting in savings of up to 75%.
- FLIP offers more than just a no-code platform; it distinguishes itself with its affordability. While other business intelligence and data analytics tools may incur significant implementation and maintenance costs, FLIP provides a cost-effective solution that is accessible to businesses of all sizes.
How Data Analytics Transforms Businesses Across Sectors
1. Retail
Personalization: Data on customer behavior and purchase history allows retailers to personalize product recommendations, marketing campaigns, and in-store promotions.
Demand Forecasting: Analyzing sales data and market trends helps retailers predict future demand, optimize inventory management, and prevent stockouts.
Fraud Detection: Real-time analytics can identify suspicious transactions and fraudulent activities, protecting revenue and customer trust.
2. Finance
Risk Management: Financial institutions leverage data analytics to assess creditworthiness, manage risk portfolios, and detect potential fraud patterns.
High-Frequency Trading: Algorithms powered by data analytics enable faster and more precise trading decisions in the financial markets.
Personalized Financial Products: Data helps banks and financial service providers create customized financial products and services tailored to individual customer needs.
3. Healthcare
Precision Medicine: Data analysis of medical records and genomic data allows for personalized treatment plans and improved patient outcomes.
Predictive Analytics: Hospitals can predict patient readmission risks and proactively intervene to improve care and reduce costs.
Drug Discovery and Development: Data analytics plays a crucial role in analyzing clinical trials, identifying potential drug targets, and accelerating drug development.
4. Manufacturing
Predictive Maintenance: By analyzing sensor data from machines, manufacturers can predict equipment failures and schedule maintenance interventions proactively, minimizing downtime and production losses.
Quality Control: Data analytics helps monitor production processes and identify quality issues in real-time, ensuring consistent product quality.
Supply Chain Optimization: Analyzing data on demand, inventory levels, and logistics allows manufacturers to optimize their supply chains for efficiency and cost reduction.
5. Marketing
Targeted Advertising: Data analytics enables marketers to target specific customer segments with personalized ad campaigns, increasing campaign effectiveness and ROI.
Customer Journey Mapping: Understanding customer behavior through data analysis helps optimize the customer journey and create a more engaging brand experience.
Social Media Listening: Analyzing social media conversations allows brands to gauge customer sentiment, identify brand mentions, and respond to customer feedback effectively.

Case Studies: Revolutionizing Businesses with Cutting-edge Data Analytics Solutions
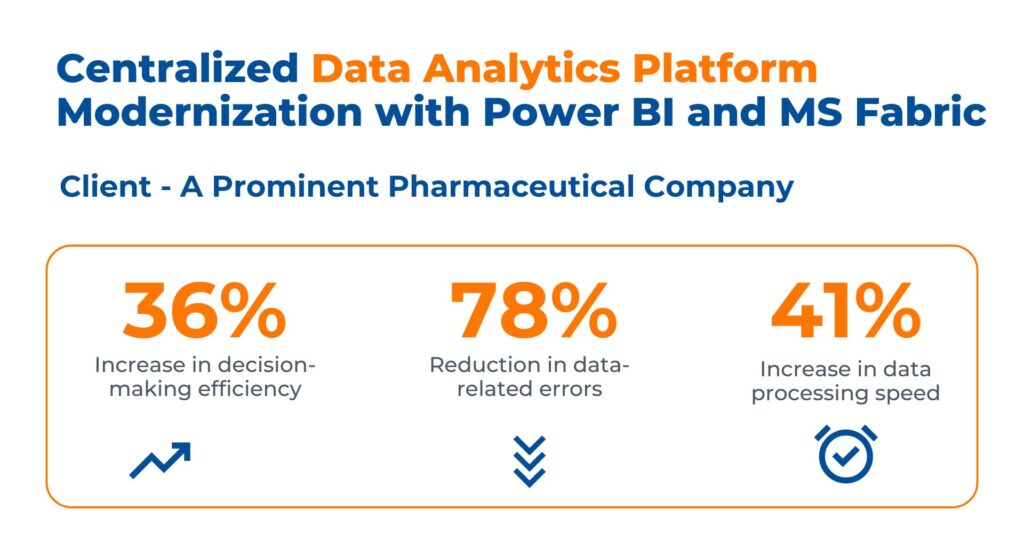
Case 1: Centralized Data Analytics Platform Modernization with Power BI and MS Fabric
Business Context
The client is a prominent pharmaceutical company headquartered in the United States. The client faced challenges with fragmented data dispersed across multiple systems such as Model N, SQL Server, SAP, and isolated databases. Their goal was to centralize and integrate its data sources into a unified data warehouse.
Kanerika solved their issues by leveraging MS fabric and Power Bi. The outcomes are:
- Centralized disparate data from Model N, SQL, and SAP into a unified Microsoft Fabric Data Lakehouse, eliminating data fragmentation.
- Structured and organized data within the Data Lakehouse, streamlining access and ensuring data integrity for effective analysis.
- Created customized Power BI reports, enabling data-driven decision-making and enhancing strategic business planning.
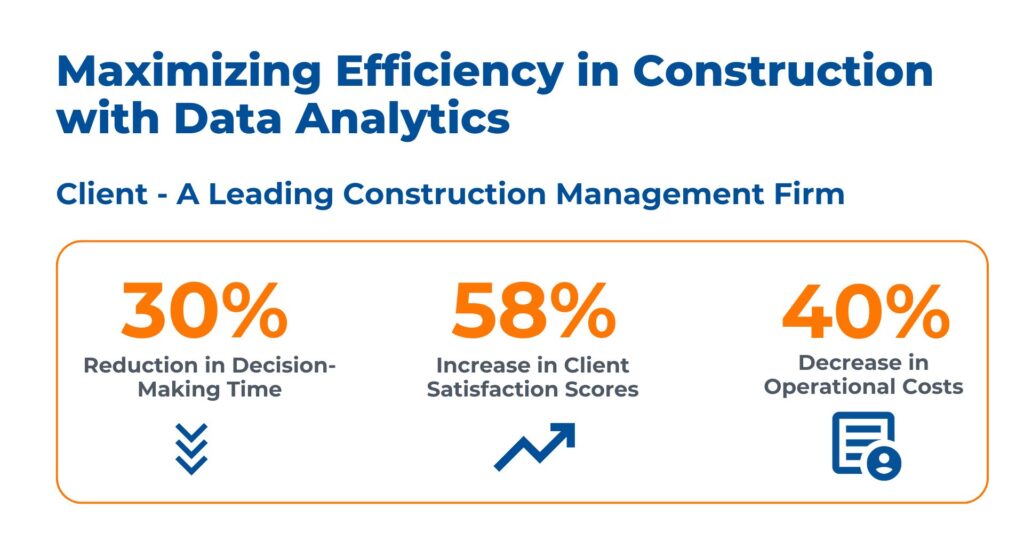
Case 2: Maximizing Efficiency in Construction Management with Data Analytics
Business Context
The client is a prominent general contracting and construction management firm licensed in all 50 states across the USA. They required a transformative approach to their reporting and analytics, choosing Power BI for its advanced capabilities. They needed assistance integrating Power BI to create interactive dashboards and real-time reports.
Kanerika helped the client achieve his business requirement by:
- Utilizing Power BI to streamline data management, enhancing decision-making efficiency and minimizing project delays.
- Implementing Power BI for real-time reporting, improving adaptability and increasing client satisfaction in project outcomes.
- Automating reporting with Power BI to reduce manual tasks, thereby cutting operational costs and boosting overall productivity.
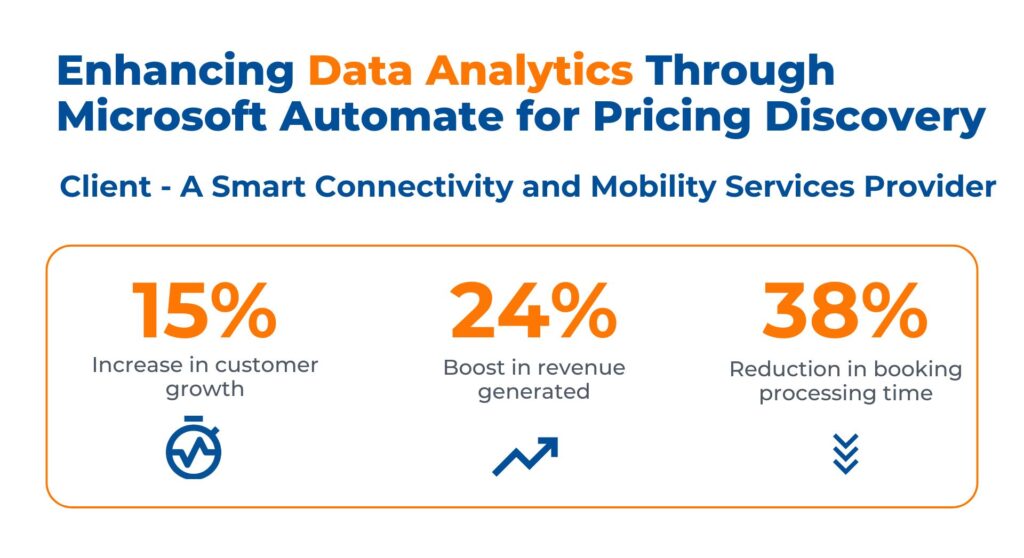
Case 3: Enhancing Data Analytics through Microsoft Automate for Competitive Pricing Discovery
Business Context
The client is a leading smart connectivity and mobility services provider. They relied heavily on data analysts manually reviewing pricing information from various travel booking service providers which consumed valuable resources and led to delays in pricing discovery,
By MS Power Automate, Kanerika resolved the client’s business challenges by:
- Automating travel booking through an intelligent pricing discovery process, ensuring a smooth customer experience.
- Activating a Bot to navigate various websites and capture pricing data to populate the discovery database for reliable insights utilizing data analysis in research.
- Automating data analytics for pricing mechanism, enhancing service visibility and customer satisfaction.
Kanerika: Your #1 Choice for Top-notch Data Analytics Solutions
Kanerika is your premier choice for exceptional data analytics solutions. With a proven track record of delivering top-notch services, we offer cutting-edge analytics tools and expertise to help businesses harness the full potential of their data. Our tailored solutions are designed to drive actionable insights, optimize operations, and unlock growth opportunities across sectors.
From predictive analytics to advanced machine learning algorithms, At kanerika, we empower organizations to make informed decisions, enhance customer experiences, and stay ahead of the competition. Experience the power of data-driven decision-making with Kanerika – your trusted partner for transformative data analytics solutions.