
TL;DR
In data ingestion vs data integration, pick ingestion to land data fast and integration to make it agree. Ingestion copies source data into a landing zone, mostly unchanged. Integration then matches and cleans it, so customers and metrics mean one thing everywhere. Most stacks need both, and ingestion comes first because unlanded data cannot be reconciled. Lead with ingestion for telemetry, replicas and raw archives, since one source rarely needs matching. Lead with integration for finance, customer 360 and AI, where conflicts cause wrong answers.
Key Takeaways
- Data ingestion moves source data into a platform, complete and on time, while data integration makes data from several systems consistent and usable.
- Ingestion fills the bronze layer of a medallion architecture, while integration builds the silver and gold layers on top of it.
- Log-based change data capture (CDC) is the ingestion pattern that catches deletes without polling the source.
- Integration effort goes mostly into identity resolution and shared metric definitions, which need business owners as well as code.
- Prioritize ingestion for single-source, high-speed or archive use cases, and integration when three or more overlapping sources must agree.
- For AI and RAG, only reconciled silver and gold data should feed a model, because a model repeats whatever conflicts it is given.
Why Ingestion and Integration Get Confused
Picture a retailer that funds a “single customer view” project. The team buys a connector tool and points it at the ERP, web store and CRM. Soon every table lands in the cloud.
Then the first dashboard shows three customer counts. The ERP says 41,000, while the CRM says 38,500 and the web store says 52,000. Nobody can say which number is right, so the project stalls.
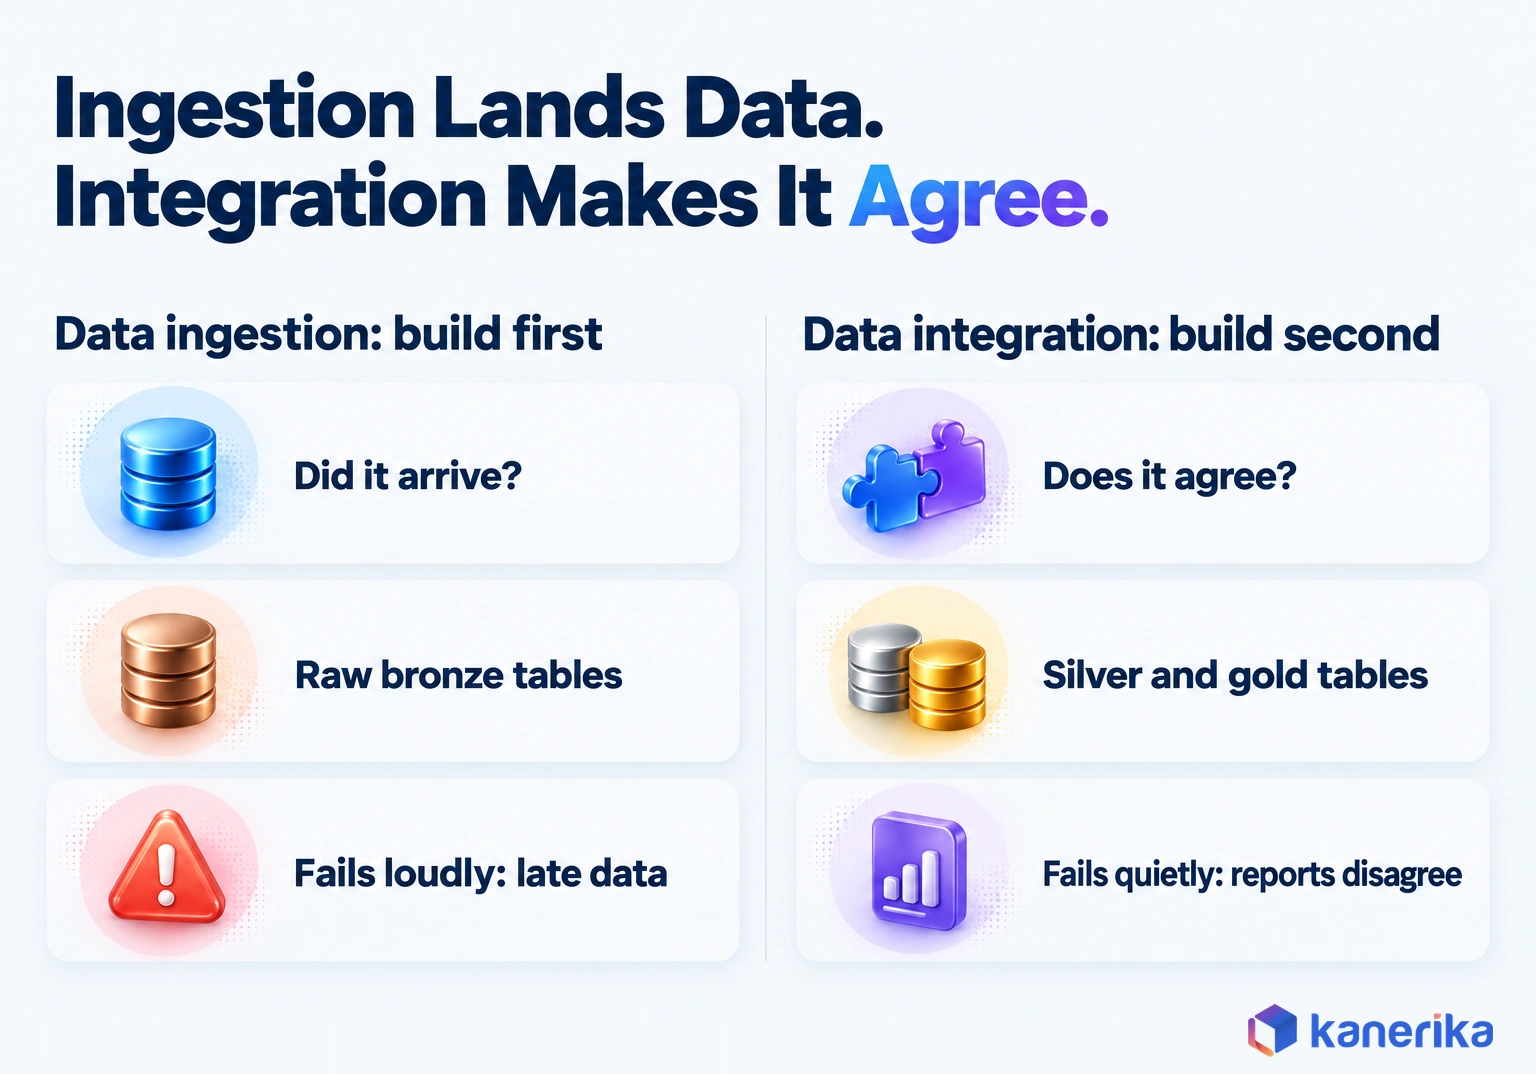
The connectors worked, because they did data ingestion, which moves data in. The project lacked data integration, the work that makes records from several systems agree. That gap is also why budgets go to the wrong layer first.
This guide settles the data ingestion vs data integration question: what each layer does, where they meet, which to prioritize and where each breaks. Moving systems rather than connecting them? See our guide to data migration vs data integration.
What Is Data Ingestion?
Data ingestion is the process of acquiring data from source systems and landing it in a destination such as a data lake, lakehouse or warehouse. The data arrives raw or lightly typed, so it stays close to how the source stored it.
Think of it as the loading dock of a data platform. Trucks arrive from different suppliers, and the dock records what came in and when, although nothing gets repackaged yet. A nightly export of ERP orders into cloud storage is ingestion, for example. So is a stream of sensor readings written to a table every second.
Good ingestion is judged on completeness, freshness and traceability. Every record that left the source should arrive when the business expects it, with a note of where it came from.
Batch, Micro-Batch and Streaming Ingestion
Ingestion runs in one of three modes, so the first question is how fresh the data must be. Batch moves data on a schedule, while micro-batch picks up new data in small, frequent increments. Streaming moves each event as it happens.
| Mode | How it works | Typical freshness | Example |
|---|---|---|---|
| Batch | Full or incremental loads on a fixed schedule | Hours to a day | Nightly ERP order file copied to cloud storage |
| Micro-batch | Small increments picked up as new data appears | Minutes | Databricks Auto Loader processing new files as they arrive in cloud storage |
| Streaming | Each event written as it is produced | Seconds | Snowpipe Streaming writing rows from apps or devices into Snowflake tables |
Most reporting runs happily on batch or micro-batch, because few reports change minute to minute. Databricks documents how Auto Loader incrementally processes new files as they land, which suits the middle row. Streaming earns its extra cost only when a decision has to happen within seconds, such as a fraud check or a machine alert.
Kanerika Service
Data Engineering Services
Kanerika builds ingestion pipelines with batch, CDC or streaming loads, schema checks and logged runs, so every source lands complete and on time in your lake or lakehouse.
Explore Data EngineeringChange Data Capture: Log-Based vs Query-Based
Change data capture (CDC) is the ingestion technique that copies only what changed in a source database. It comes in two forms, and the difference shows up when someone first deletes a row.
Query-based CDC polls the source with a query such as “give me rows updated since 2 a.m.” It is simple to set up, so many teams start there. It also adds repeated load to the source, and it cannot see deleted rows, because a deleted row no longer exists to be queried.
Log-based CDC reads the database transaction log instead. The Debezium documentation notes that this captures all changes with very low delay and avoids the CPU cost of frequent polling. Deletes are captured too, so the copy in your lakehouse stays faithful to the source.
Microsoft Fabric also provides a managed version of the same idea. Mirroring in Fabric continuously replicates data from sources such as Azure SQL Database, SQL Server, Snowflake and Oracle into OneLake as Delta tables. The short clip below then applies it to a QAD ERP through open mirroring.
Where Ingestion Stops
Ingestion ends at the landing zone by design. When teams ask it to do more, connector tools end up blamed for problems they were never built to solve.
- Matching a CRM customer to the same customer in the ERP is outside its scope.
- It does not decide what “active customer” or “net revenue” means.
- Conflicting values, such as two addresses for one supplier, stay as they are.
- Shared reference data, such as one product hierarchy, is not enforced.
The retailer from the opening shows where that line falls. Its three customer counts (41,000, 38,500 and 52,000) landed exactly as the ERP, CRM and web store held them. None of the four jobs above was done, so the dashboard had three answers and no way to choose between them.
Each of those jobs belongs to integration, the next layer up.
What Is Data Integration?
Data integration is the work of combining, mapping and reconciling data from several systems so that it becomes consistent, usable information. Where ingestion asks “did the data arrive?”, integration asks “does the data agree?”
Return to the retailer from the opening. Integration decides that “ACME Foods” in the web store and “Acme Foods Ltd” in the CRM are one company. It then links both to customer C-1042 in the ERP, so every report counts that company once.
That work happens in two broad ways. Physical integration moves and transforms data into new tables, whereas virtual integration queries it in place, without a pipeline your team has to build.
Physical Integration: ETL and ELT
ETL extracts data, transforms it in a separate engine, then loads the finished result into the target. It suits cases where sensitive fields must be masked before they reach the warehouse, or where the target cannot run heavy transformations.
ELT loads raw data first and then transforms it inside the warehouse or lakehouse with SQL or notebooks. Cloud platforms favor it because storage is cheap and compute scales, so the raw copy stays available for reprocessing. Our comparison of ETL vs ELT also covers the trade-offs.
Both patterns also contain an ingestion step, the E and the L, which is one reason the terms blur. Our guide on how data integration compares with ETL goes further, since ETL is often only one part of a wider design.
Virtual Integration: Federation and Shortcuts
Virtual integration gives people one place to query data without copying it through a full pipeline. Federation sends a query to several sources at run time, while shortcuts point one platform at data stored in another.
Mirroring, covered under CDC above, is managed ingestion rather than integration. Some teams still use a mirrored copy as a quick virtual-access layer, because it needs no pipeline of their own. The data fabric vs data warehouse comparison also shows where a virtual layer fits in a wider architecture.
Still, virtual integration unifies access, not meaning. A federated query can return the ERP and CRM customer tables side by side, yet it will not decide that they describe the same company. That reconciliation logic therefore still has to live somewhere.
Identity Resolution and Shared Metrics: the Hard Part
Most integration effort goes into two problems. The first is identity resolution: matching the same customer, product or supplier across systems that each use their own identifiers. The second is shared metrics, which means agreeing on one definition of revenue, churn or on-time delivery.
Neither problem is solved by a tool alone, because matching rules need business input. For example, someone must decide whether a tax ID beats an email domain when the two disagree.
Metric definitions also need an owner who signs them off. Otherwise finance and sales keep separate versions of the same number. This is why integration projects take longer than their connector budgets suggest. The code is often modest, but the decisions behind it involve people from several departments.
Kanerika Service
Data Integration Services
Kanerika designs the integration layer end to end, from identity matching and shared metric definitions to the silver and gold tables your reports and models read.
Explore Data IntegrationData Ingestion vs Data Integration: Side-by-Side
The quickest way to see the difference is to compare the two layers on twelve dimensions. Each row asks what each layer cares about on that dimension.
| Dimension | Data ingestion | Data integration |
|---|---|---|
| Objective | Land source data completely and on time | Make data from several systems consistent and usable |
| Main activity | Extract, copy, load, capture changes | Map, clean, match, join, conform |
| Sources | One source per pipeline, many pipelines | Several sources combined in one model |
| Output | Raw or lightly typed tables (bronze) | Validated and business-ready tables (silver and gold) |
| Processing model | Batch, micro-batch, streaming or CDC | Batch or incremental transformations, plus virtual queries |
| Transformation | Minimal: data types, file format, audit columns | Heavy: business rules, deduplication, conformed dimensions |
| Data quality focus | Completeness, freshness, schema checks | Accuracy, consistency, referential integrity |
| Latency | Seconds to hours, set by the mode | Minutes to a day, set by the slowest source it depends on |
| Storage | Landing zone in a lake, lakehouse or staging area | Curated tables in a warehouse or lakehouse |
| Main complexity | Connectors, volume, source load, schema drift | Matching rules, metric definitions, ownership |
| Failure looks like | Missing or late data, failed loads | Numbers that disagree across reports |
| Owner | Data engineering or platform team | Data engineering working with business data owners |
One pattern also runs through every row. Ingestion problems are mostly technical and visible, while integration problems are about meaning and stay quiet until a report is questioned.
How They Work Together: the Medallion View
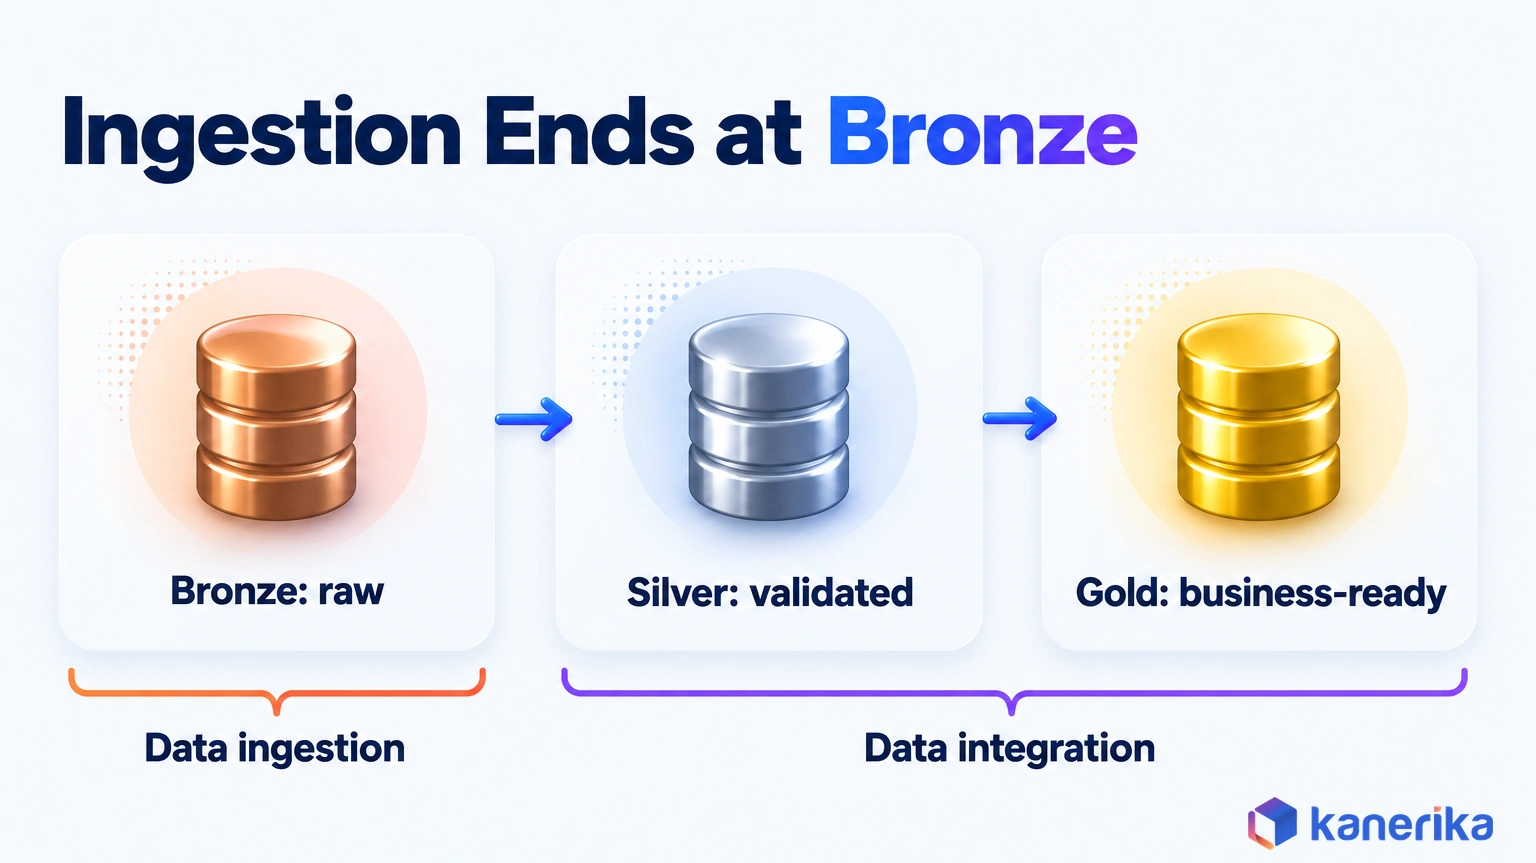
The clearest way to see both layers in one design is the medallion architecture. Databricks describes it as layers that data passes through in order, also called a multi-hop architecture. Bronze holds raw data, silver holds validated and cleaned data, and gold holds highly refined views of the data for business use.
Ingestion fills bronze. Integration then builds silver and gold, the curated tables a data warehouse architecture is designed to serve.
The two are consecutive steps in one flow, so each depends on the other. Our guide to how data pipelines work traces that flow from source to dashboard, step by step.
They also share more than people expect. Both need scheduling, monitoring, access control and lineage, and both fail when a source changes without warning. Since the plumbing is shared, it makes sense to run them on one platform with one catalog.
Where bronze lives, however, is a separate choice. Our comparison of data lake vs lakehouse covers the landing-zone options, while the medallion architecture guide goes deeper on layer design.
Where ETL, ELT, CDC and Streaming Fit
Four pattern names cause most of the confusion, because each touches ingestion and some also touch integration. The table below places each pattern in its layer, because the layer decides who owns the work.
| Pattern | Layer | What it contributes |
|---|---|---|
| ETL | Both | Extract and load are ingestion; the transform step is integration done before loading |
| ELT | Both | Load is ingestion into bronze; transformation inside the platform builds silver and gold |
| CDC | Ingestion | Captures inserts, updates and deletes from source databases with low delay |
| Streaming | Ingestion first | Lands events in seconds; joins and aggregations on the stream are integration |
When you plan work, name the layer rather than the pattern. “We need CDC” says how data arrives, but it does not say who will reconcile the result. For pattern-level detail, see our comparison of a data pipeline vs ETL.
Which Approach Fits Which Use Case?
The right priority depends on what the business wants from the data rather than on which tool is already installed. Each use case leans one way, as the table shows.
| Use case | Prioritize | Why |
|---|---|---|
| Read-only ERP replica for reporting | Ingestion | One source, so the goal is a faithful, fresh copy through CDC |
| IoT or machine telemetry landing | Ingestion | High volume and speed, while cross-system matching is light |
| Raw archive for audit or reprocessing | Ingestion | Value comes from completeness rather than matching |
| Finance consolidation across entities | Integration | Charts of accounts and currencies must map to one view |
| Customer 360 | Integration | Identity resolution across CRM, ERP and web is the core task |
| Regulatory reporting | Both | Complete capture plus reconciled, traceable figures |
| AI retrieval and analytics agents | Both, integration-heavy | Models repeat conflicts unless the data is reconciled |
| Sales and marketing dashboards | Both | Fresh data from several tools, with one definition of a lead |
Use cases with one source generally lean toward ingestion. Use cases that combine sources lean toward integration instead, while anything regulated or AI-facing needs both.
Worked Example: One Order, Three Systems
The figures here are illustrative, although the pattern is common. A customer places a web order for goods worth $1,200, plus 8% sales tax, and three systems record it.
- Bronze (ingestion). Three raw records land. The web store row shows $1,296 including tax, the ERP row shows $1,200 net with $96 tax in a separate field, and the CRM opportunity shows $1,200. Each uses its own customer ID.
- Silver (integration). Rules standardize tax treatment, drop a duplicate row left by a retried load, and match the three customer IDs to one company using tax ID and email domain.
- Gold (integration). The revenue table counts the order once, at $1,200 net, linked to one customer and one sales rep.
Without the silver step, a naive sum of the three bronze rows reports $3,696 for a $1,200 order. Ingestion did its job perfectly, so the error came from skipping integration.
Checklist
Data Integration Checklist
Download the Data Integration Checklist to plan sources, owners, freshness, matching rules and governance for every flow before you build it.
Get the Checklist →How to Decide What to Prioritize
The order of work matters because budgets rarely stretch to both layers at once. Five questions, asked in sequence, usually settle it before any tool is chosen.
- Name the business output. A report, an API, a model and a regulatory file each make different demands, so start from the output and work backward.
- Set freshness and volume. Needs measured in seconds point to streaming ingestion. Daily reporting tolerates batch, which costs less to run.
- Count sources and transformation depth. One source with light typing is an ingestion job. Three or more sources that must agree make integration the main effort.
- Weigh the governance load. Regulated data needs lineage, access rules and audit trails across both layers, and data governance tools also help track them.
- Choose the minimum architecture. Build the simplest design that meets the output, then add layers when a new use case needs them.
Data Ingestion vs Data Integration Decision Matrix
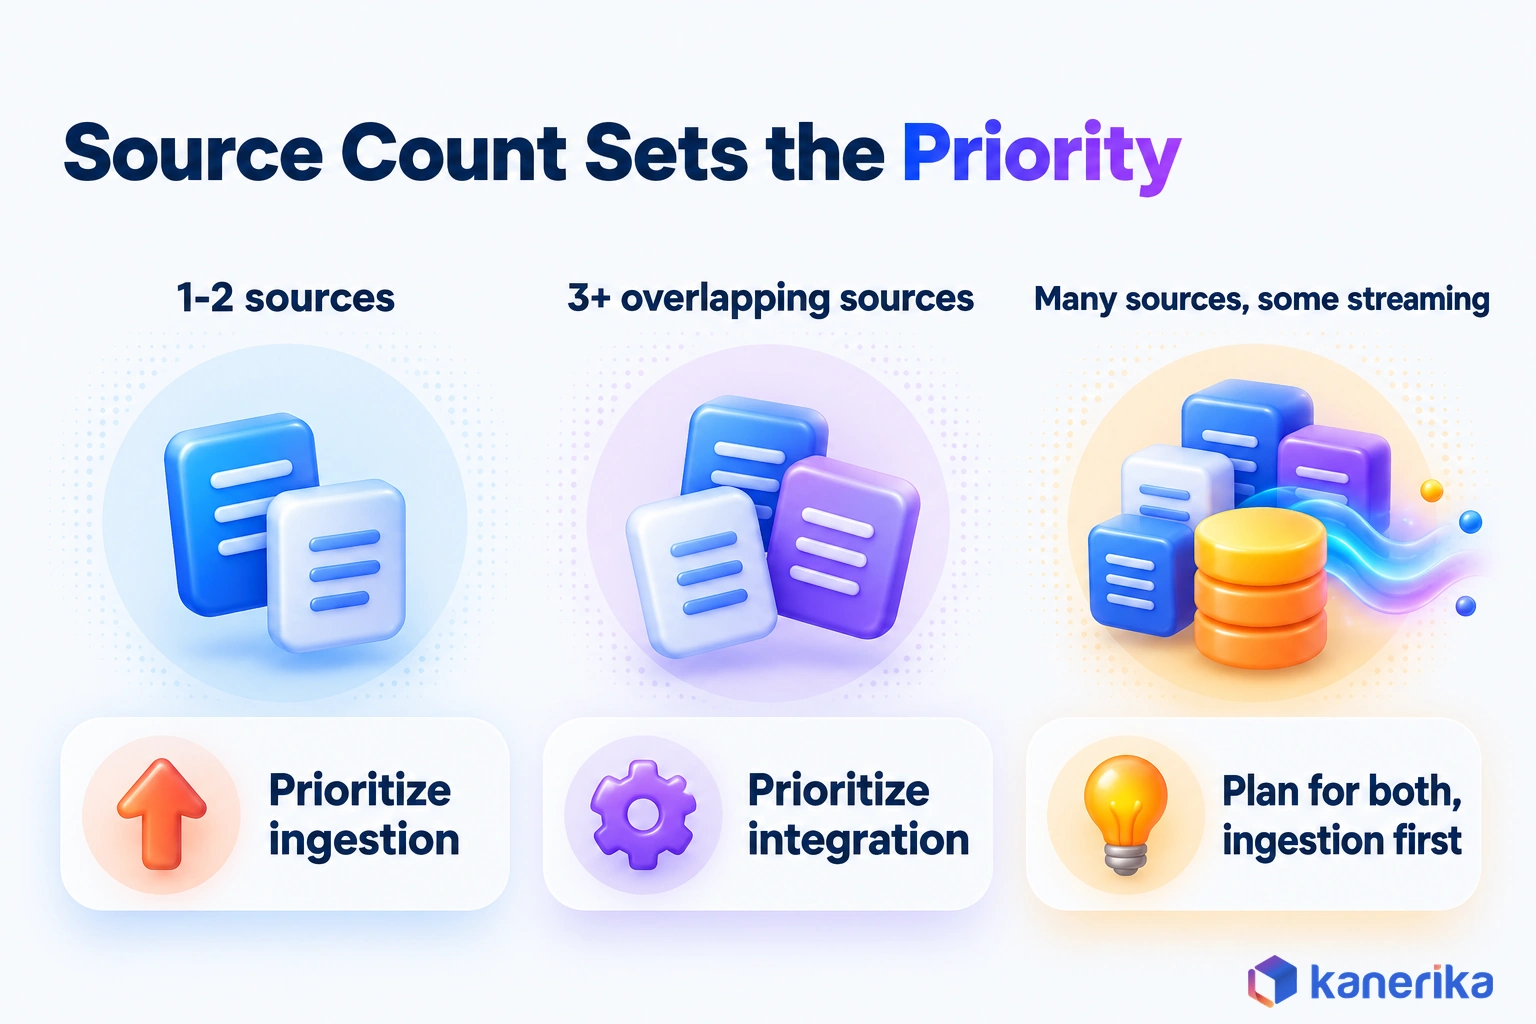
The matrix turns those questions into a quick read. Find the row that describes your situation, then read across.
| Factor | Prioritize ingestion | Prioritize integration | Plan for both |
|---|---|---|---|
| Latency need | Seconds to minutes, single source | Hourly or daily is fine | Near real time across sources |
| Number of sources | One or two | Three or more that overlap | Many, some of them streaming |
| Conformance needed | A raw copy is enough | Shared IDs and metrics required | Raw history plus conformed views |
| Compliance load | Retention and audit of raw data | Reconciled, traceable figures | Both, with lineage end to end |
| Team skills | Platform and connector skills | Data modeling and business analysis | A mixed team or a partner |
If most of your answers fall in one column, start there. A spread across columns, however, means you need both layers, built ingestion first.
Teams that are strong on connectors but short on modeling skills often bring in data engineering services for the first silver layer. They then take over once the patterns are set.
Where Pipelines Break: Drift, Contracts and Failures
Pipelines usually fail quietly: a source renames a column or a matching rule drifts, and the damage surfaces days later in a report. Knowing which layer owns each failure therefore makes the fix faster.
| Failure | Layer | How to detect it | Fix |
|---|---|---|---|
| Schema drift (renamed or new column) | Ingestion | Schema checks on every load, with an alert on mismatch | Version the schema and evolve bronze tables safely |
| Late or duplicate records | Ingestion | Row counts and freshness checks per run | Idempotent merges on the source ID |
| Deleted rows missed | Ingestion | Source-to-target count reconciliation | Switch to log-based CDC |
| Mismatched customer or product IDs | Integration | Match-rate reports and a queue of unmatched records | Tune matching rules; add a master reference table |
| Metric disagreement across reports | Integration | Compare gold metrics to a finance control total | One owned definition per metric in gold |
The best prevention is a data contract. A contract is a written agreement between the source team and the data team on schema, meaning and freshness. It is then checked automatically on every load.
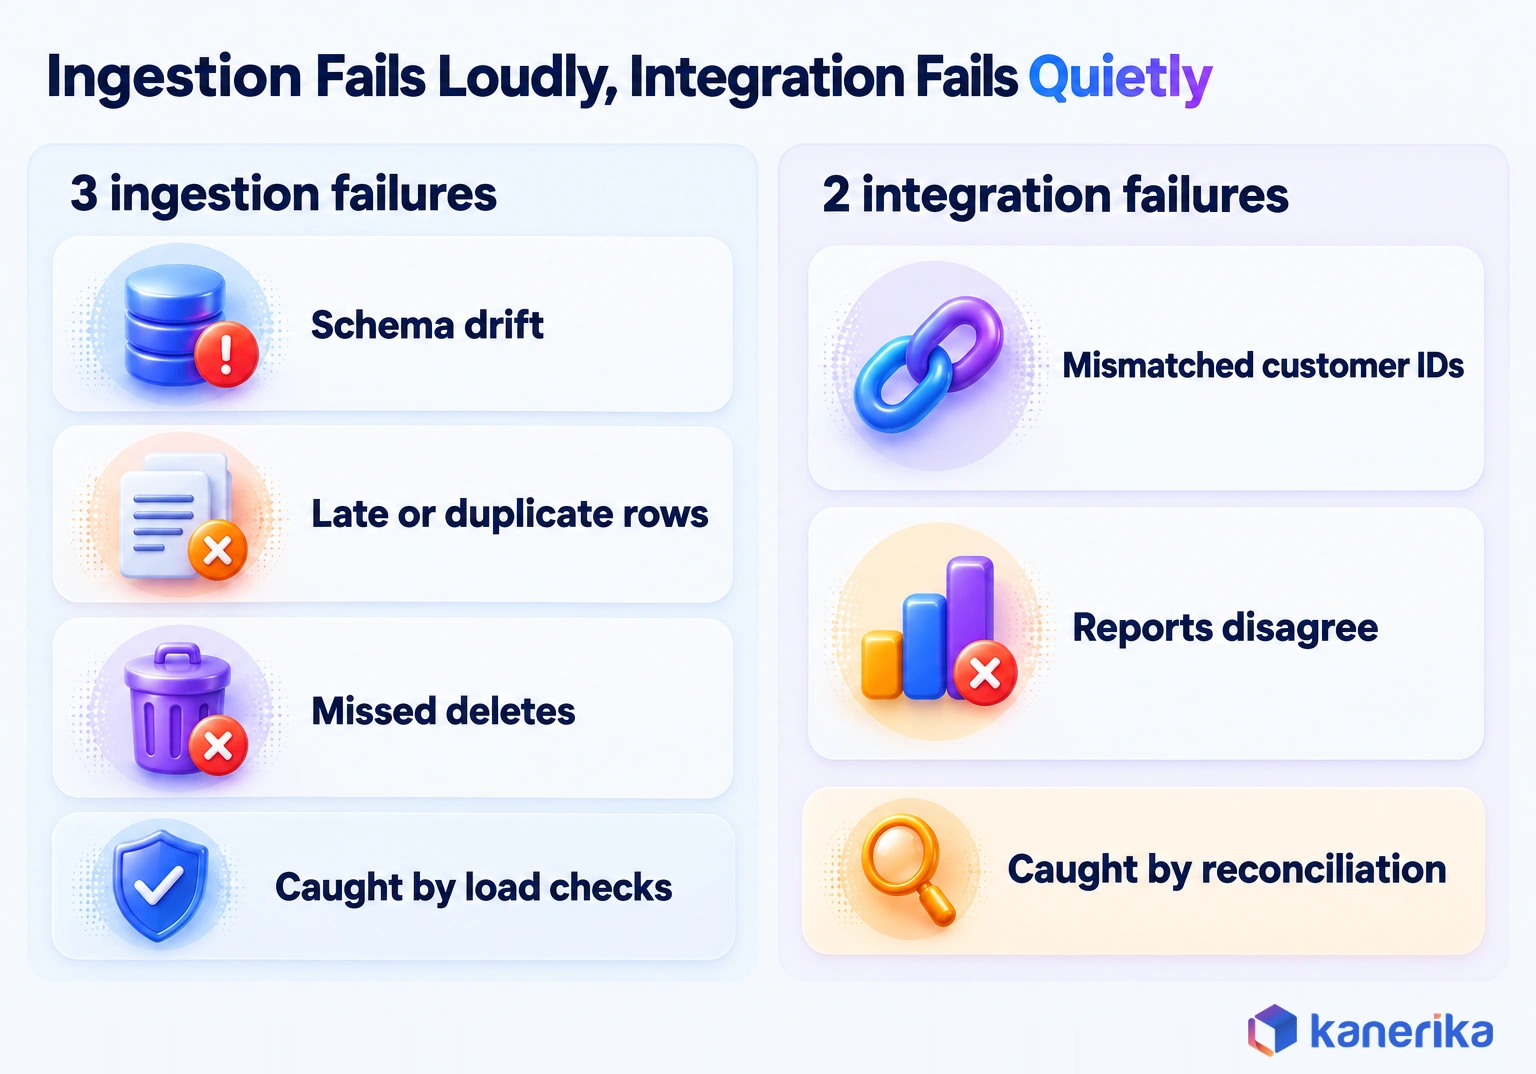
Contracts stop most drift at the bronze door, while monitoring catches the rest. Our guide to data observability explains what to watch, and data lineage shows which reports a broken table affects.
Ingestion and Integration for AI and RAG
AI projects expose integration gaps faster than dashboards do. A dashboard with two customer counts gets questioned in a meeting, but a chatbot that retrieves both versions simply picks one and answers with confidence.
Take a support assistant built on retrieval-augmented generation. If its index reads raw bronze tables, it may quote the old price list next to the new one. It may also return a contract for a customer record that was merged months ago. The model is working as designed, since its input was never reconciled.
The stakes are also measurable. Gartner predicts that through 2026, organizations will abandon 60% of AI projects unsupported by AI-ready data. A Gartner survey also found that 63% of organizations either do not have, or are unsure they have, the right data management practices for AI.
In practice, that means three checks before any AI build.
- Matching. Check that every source the index reads has passed silver-layer matching.
- Ownership. Let the index quote metrics only from gold tables with a named owner.
- Traceability. Log which table version each answer used, so a wrong answer can be traced to its source in minutes rather than days.
For AI work, ingestion puts data in front of the model, while integration makes it safe to trust. For that reason, treat the silver and gold layers as the only sources an AI index may read, and keep bronze for engineers.
Tools by Layer on Fabric, Databricks and Snowflake
All three major data platforms cover both layers, although each names the parts differently. The table lists documented capabilities by layer, so read it as a map rather than a ranking.
| Platform | Ingestion | Integration |
|---|---|---|
| Microsoft Fabric | Copy job for bulk and incremental copy (CDC replication was in preview as of September 17, 2026); Mirroring into OneLake as Delta tables; Eventstreams for real-time events, with Kafka-protocol endpoints | Lakehouse and warehouse transformations that build silver and gold tables |
| Databricks | Lakeflow Connect managed connectors, including database CDC for MySQL, PostgreSQL and SQL Server, governed by Unity Catalog; Auto Loader for new files in cloud storage | Medallion pipelines that refine bronze into silver and gold tables |
| Snowflake | Snowpipe Streaming for rows from apps and devices without staging files; Openflow, an integration service built on Apache NiFi | SQL transformations that build curated tables inside Snowflake |
Each row is drawn from vendor documentation rather than marketing pages. Microsoft documents the Fabric Copy job and Fabric Eventstreams, while Databricks documents Lakeflow Connect.
On the Snowflake side, the docs cover Snowpipe Streaming and Snowflake Openflow, whose Snowflake-hosted deployments run in AWS, Azure and Google Cloud commercial regions. Our Snowflake architecture guide also explains where these pieces sit.
Fabric teams can go further with our guide to Data Factory in Microsoft Fabric. Kanerika also works on all three platforms through its Microsoft Fabric, Databricks and Snowflake practices. Picking specific products is a separate decision, so our roundup of data integration tools compared covers the wider market.
Datasheet
Automating the Migration of Data Pipelines from SQL Server to Microsoft Fabric
Read the datasheet on Kanerika’s approach to moving existing SQL Server data pipelines into Microsoft Fabric, a common starting point for rebuilding ingestion there.
View the Datasheet →Cost and Effort: Where the Money Goes
Ingestion and integration both cost money, but in different ways. Ingestion costs scale with data volume and connector count, whereas integration costs scale with the number of decisions people must make.
| Cost driver | Ingestion | Integration |
|---|---|---|
| Connectors and licenses | Main cost when connectors are managed services | Low |
| Compute | Steady, tied to volume and frequency | Spiky, tied to transformation complexity |
| Storage | Raw history grows fastest | Curated tables are smaller |
| Engineering time | Setup per source, then light upkeep | Ongoing modeling and rule changes |
| Monitoring | Freshness, volume and failed runs | Match rates and reconciliation checks |
| Rule maintenance | Rare | Constant, as the business changes |
The biggest line item in integration, however, is usually people’s time. Every new source adds matching rules, and every reorganization changes a metric definition. So budget for integration as an ongoing service that runs as long as the sources do.
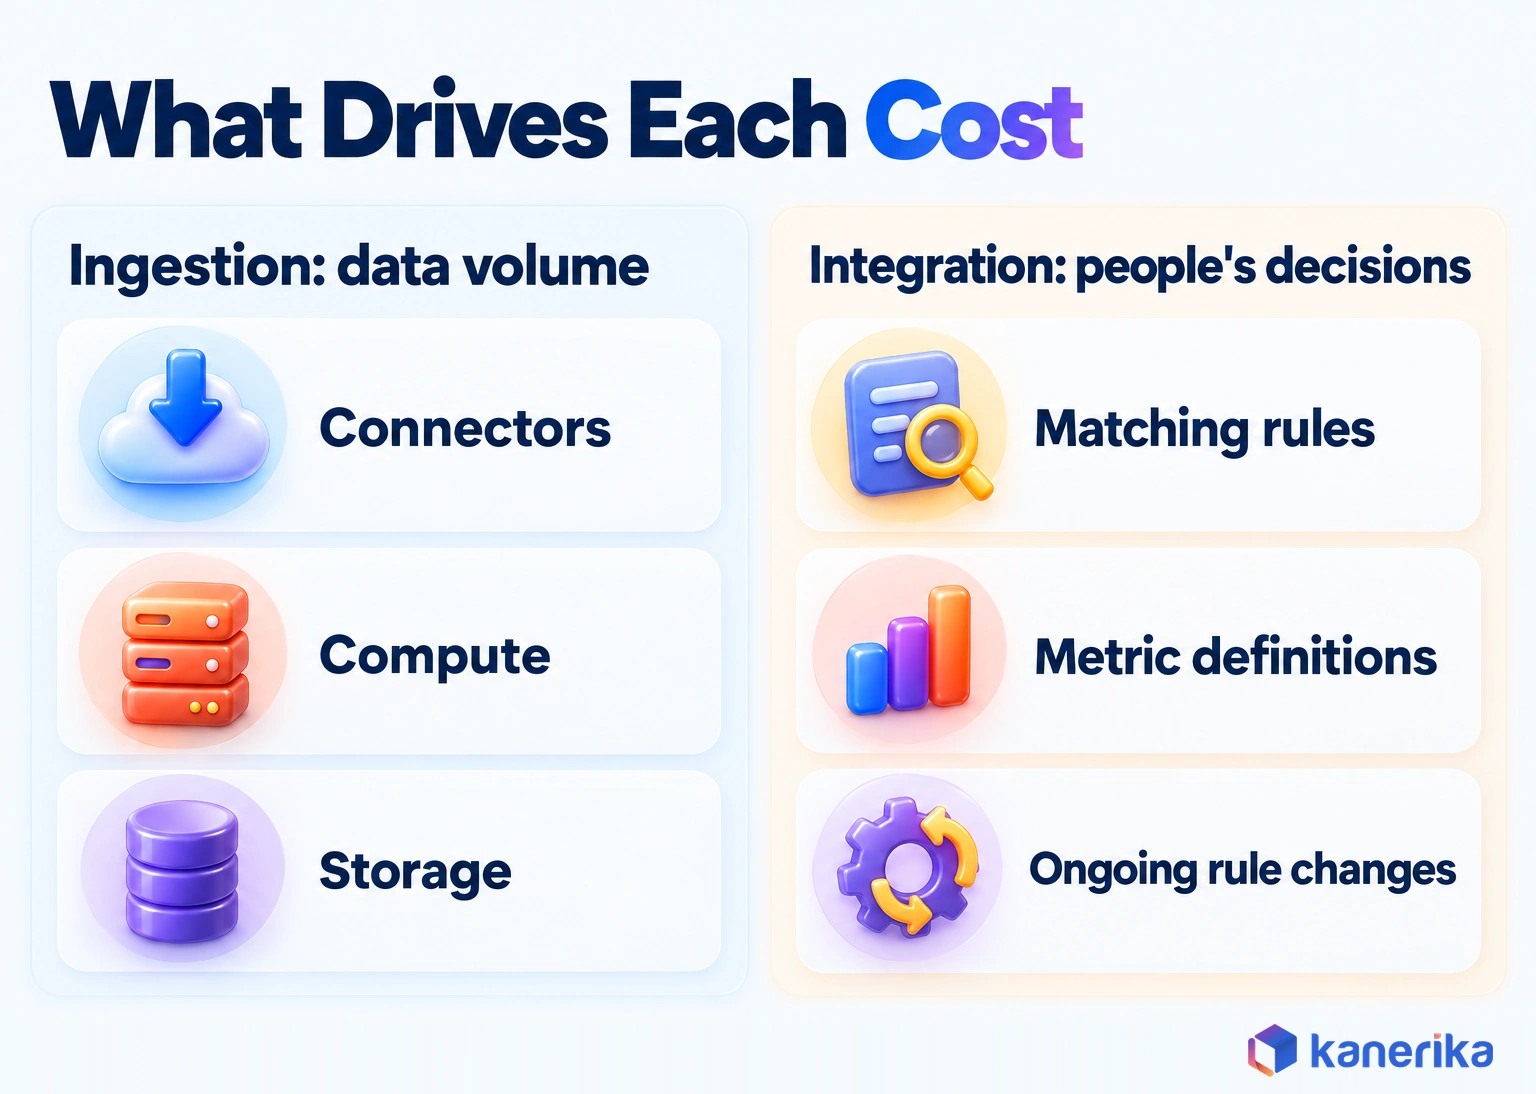
Ingestion spend is easier to forecast, and it is also easier to cut. Moving a nightly full reload to CDC, for example, lowers both source load and compute. For cost and value at enterprise scale, see our guide to enterprise data integration architecture. Data automation tools can also take routine checks off both layers.
How Kanerika Builds the Ingestion and Integration Layers
Kanerika treats ingestion and integration as two stages of one roadmap rather than two separate projects. The four stages below are how its data integration services are structured, and each stage finishes before the next starts.
- Assess sources. List every system, its owner, its volume and how it changes, and flag where deletes and schema changes happen.
- Pick the architecture. Choose the landing zone and ingestion mode for each source, then define the silver and gold layers the outputs need.
- Build one priority pipeline. Take one business output end to end on a repeatable pattern; our guide to building an ETL framework shows how such a pattern is structured.
- Scale with governance. Add sources through the same pattern, with lineage, access rules and data contracts in place as part of wider enterprise data governance.
A food and pharma manufacturer followed this order, starting with ingestion before any integration work. Kanerika consolidated six business platforms into one Microsoft Fabric bronze layer within a four-week Proof of Value. The sources included NetSuite, RedZone, Parity Factory, UpKeep and Paychex.
Ingestion was automated over standard authentication and encryption, replacing the manual report compilation the client had relied on. A validation framework also checks completeness and key business fields, and every load is logged.
The pilot’s stated outcome was a decision rather than a percentage. It proved the architecture was feasible and gave leadership clear effort estimates for a full-scale rollout. That ingestion-first foundation is what makes the later silver and gold integration work possible.
Case Study
Six Business Platforms Into One Fabric Bronze Layer in Four Weeks
A food and pharma manufacturer consolidated six platforms, including NetSuite and Paychex, into a Microsoft Fabric bronze layer during a four-week Proof of Value, with fully logged ingestion and a validation framework.
Read the Case Study →So, Ingestion or Integration?
The answer depends on which problem your stack has. If data is missing, late or locked inside source systems, prioritize ingestion. If the data is present but reports disagree, prioritize integration instead.
Most growing stacks eventually meet both problems, usually in that order, so budget for the second layer from the start. For your stack, the order is the same: land the data first, then earn trust in it.
Frequently Asked Questions
What is the difference between data ingestion and data integration?
Data ingestion moves data from source systems into a platform, complete and on time, with little change. Data integration combines, matches and cleans data from several systems so it agrees. Ingestion answers whether the data arrived. Integration answers whether the data is consistent. Most data stacks need both, and ingestion always runs first.
What is data ingestion?
Data ingestion collects data from sources such as databases, files, apps and devices and lands it in a lake, lakehouse or warehouse. The data arrives raw or lightly typed, close to its source format. Good ingestion is complete, fresh and traceable, so every record can be followed back to where it came from.
Is data ingestion the same as ETL?
No. ETL stands for extract, transform and load, and only the extract and load steps are ingestion. The transform step applies business rules and joins, which is integration. Ingestion can also happen without ETL, for example when CDC or mirroring copies data into a lakehouse and every transformation happens later inside the platform.
Is ETL part of data integration?
Yes. ETL is one of the most common ways to do physical data integration, because its transform step cleans, joins and reshapes data from several sources. ELT, data virtualization and mirroring are other routes. Our guide on data integration vs ETL explains when ETL is enough and when a wider integration design is needed.
How is data acquisition different from data integration?
Data acquisition is getting data you do not yet have, whether by buying a dataset, calling an API, scraping public sources or installing sensors. Data integration starts after that, combining acquired data with existing records so everything agrees. Acquisition and ingestion bring data in, while integration makes the combined data consistent and usable.
Which costs more, data ingestion or data integration?
Integration usually costs more over time, mostly in people’s time rather than software. Ingestion costs follow data volume, compute and connector fees, which are fairly predictable. Integration needs ongoing modeling, matching rules and metric decisions that change as the business changes. A new source adds a connector to ingestion but several rules to integration.
What should you check before ingesting data?
Check four things first. Confirm who owns the source and whether you may copy it. Decide how fresh the data must be and pick batch, micro-batch or streaming to match. Find out how the source changes, including deletes and schema changes. Agree on where the data will land and how long raw history is kept.
How is data ingestion different from data preparation?
Data ingestion lands data from sources into a platform with minimal change. Data preparation comes after it and shapes that data for a specific use. Examples include filling gaps, fixing formats, creating model features or filtering rows for an analysis. Preparation is usually closer to the analyst or data scientist than to the pipeline team.
How do you handle schema drift in ingestion pipelines?
Start with schema checks on every load that alert when a column is added, renamed or retyped. Store raw data in a format that tolerates new columns, then version the schema so downstream tables change deliberately. A data contract with the source team prevents most drift, because changes are agreed and announced before they reach production.
What is the difference between data collection and data ingestion?
Data collection is capturing data at its origin, such as a form submission, a sale or a sensor reading. Data ingestion moves already-collected data from those systems into a central platform. Extraction is the first step of ingestion, reading data out of the source, and loading it into the destination completes the ingestion step.
What does data integration mean?
Data integration means combining data from several systems into one consistent, usable view. It maps fields, removes duplicates, matches the same customer or product across systems and applies shared definitions for metrics such as revenue. The result is a set of trusted tables that every report and model can use without each team reworking the numbers.
Do I need data integration if I already have an ingestion tool?
Yes, if more than one system describes the same customers, products or transactions. An ingestion tool lands each source faithfully, but it does not decide which records match or which definition of a metric is correct. Without integration, reports built on the landed data will disagree, even though every pipeline ran without a single error.
Why does AI need integrated data and not just ingested data?
A model or retrieval index repeats whatever it is given. If it reads raw ingested tables, it can quote two prices for one product or return records for a merged customer. Integrated data removes those conflicts first. Gartner predicts that through 2026, organizations will abandon 60% of AI projects unsupported by AI-ready data.
What is an example of data ingestion?
A common example is copying new and changed orders from an ERP database into a lakehouse every few minutes using change data capture. Others include loading nightly CSV exports from a finance system and landing sensor readings from factory machines as a stream. Files dropped into cloud storage can also be picked up as soon as they arrive.
What are the main types of data ingestion?
There are three main types. Batch ingestion loads data on a schedule, such as nightly. Micro-batch ingestion picks up new data in small, frequent increments, often every few minutes. Streaming ingestion writes each event within seconds of it happening. Change data capture can feed any of them by sending only the rows that changed.
Is change data capture ingestion or integration?
Change data capture is an ingestion technique. It reads inserts, updates and deletes from a source database and copies only those changes into the target. Log-based CDC reads the transaction log, so it catches deletes and avoids polling load on the source. Reconciling those changes with data from other systems is integration work.
Where do ingestion and integration sit in a medallion architecture?
Ingestion fills the bronze layer, which holds raw data as it arrived from each source. Integration builds the silver layer, where data is validated, deduplicated and matched across systems, and the gold layer, where business-ready tables and metrics live. The layers run in sequence, so a gap in bronze always shows up later in gold.
Can data ingestion and data integration run in real time?
Yes, both can. Streaming and log-based CDC land data within seconds, which makes ingestion real time. Integration can also run continuously, with stream joins or frequent incremental updates to silver and gold tables. Real-time integration costs more and is harder to test, so reserve it for decisions that genuinely need second-level freshness.