

TL;DR
Data analytics in telecom works best when you start with one decision you can measure, like churn or outages. Use daily batch data for churn, and real-time data only for fraud and network faults. Link network, customer and billing records with shared IDs first. Fault alerts, churn, billing leakage and fraud pay back fastest. Keep a person in charge of network changes, and protect customer call data from day one. Test one use case for about 90 days, then scale only what worked.
Key Takeaways
- What works is one measurable decision first, such as outage minutes, churn, billing leakage, fraud loss or capex.
- Network telemetry, call detail records, OSS and BSS data only become useful when they share subscriber, account and site keys.
- Batch analytics covers most telecom decisions, while streaming earns its cost only for fraud, alarm storms and SLA breaches.
- Fault prediction, churn prediction, revenue assurance and fraud detection pay back fastest because the result is easy to measure.
- CPNI rules under 47 U.S.C. 222 and 47 CFR 64.2001-64.2011 shape who can see and use customer network data.
- A 90-day pilot with a holdout group tells you whether to scale, fix or stop before the spend grows.
When a Network Problem Becomes a Revenue Problem
Picture a cluster of cell sites on the edge of a growing suburb. Every evening between 7 and 10 p.m., throughput drops because new apartment blocks fill up and everyone streams at once.
The network operations center sees it first, as a wave of congestion alarms that clear by midnight. Customer care sees it next, when complaints about buffering and dropped video calls arrive. Billing sees it a full cycle later, when several households downgrade their plans or port out to a rival.
Each team still holds only one true piece of the story. But nobody holds the joined view that says these alarms, these complaints and these lost accounts are the same problem on the same sites.
This guide is about building that joined view: what the field covers, which use cases pay back first, how fast each decision needs data, and what works when operators move from dashboards to results.
What Data Analytics in Telecom Covers
Data analytics in telecom turns network, customer and billing data into decisions that cut cost, protect revenue or improve service. It spans everything from a weekly churn report to a fraud score calculated while a call is still being set up.
What makes it distinct, though, is the data itself. A telecom operator produces machine data from the network and commercial data from its customer systems, so the value sits where the two meet.
The Telecom Data Estate
A typical operator runs six broad families of data, each with its own owner and refresh speed. The table below also shows what each source tells you and how quickly it typically arrives.
| Source | What it tells you | Typical latency |
|---|---|---|
| Network telemetry and probes | Throughput, latency, packet loss and cell load per site | Seconds to minutes |
| Call and event detail records (CDRs, xDRs) | Who used what service, where, when and for how long | Minutes to hours |
| OSS (inventory, fault, performance) | Which equipment exists, which alarms fired, how each element performed | Minutes to daily |
| BSS (rating, billing, CRM) | Plans, charges, payments, complaints and account history | Hourly to monthly bill cycle |
| Digital and app channels | Self-service journeys, app speed tests, chat transcripts | Minutes to daily |
| Field operations | Truck rolls, repair times, parts used and first-time fix rates | Daily |
Joining these sources is harder than it looks, because each system names things differently. The TM Forum Information Framework (SID) helps here, since it gives operators a common vocabulary for customers, products, services and resources across business processes.
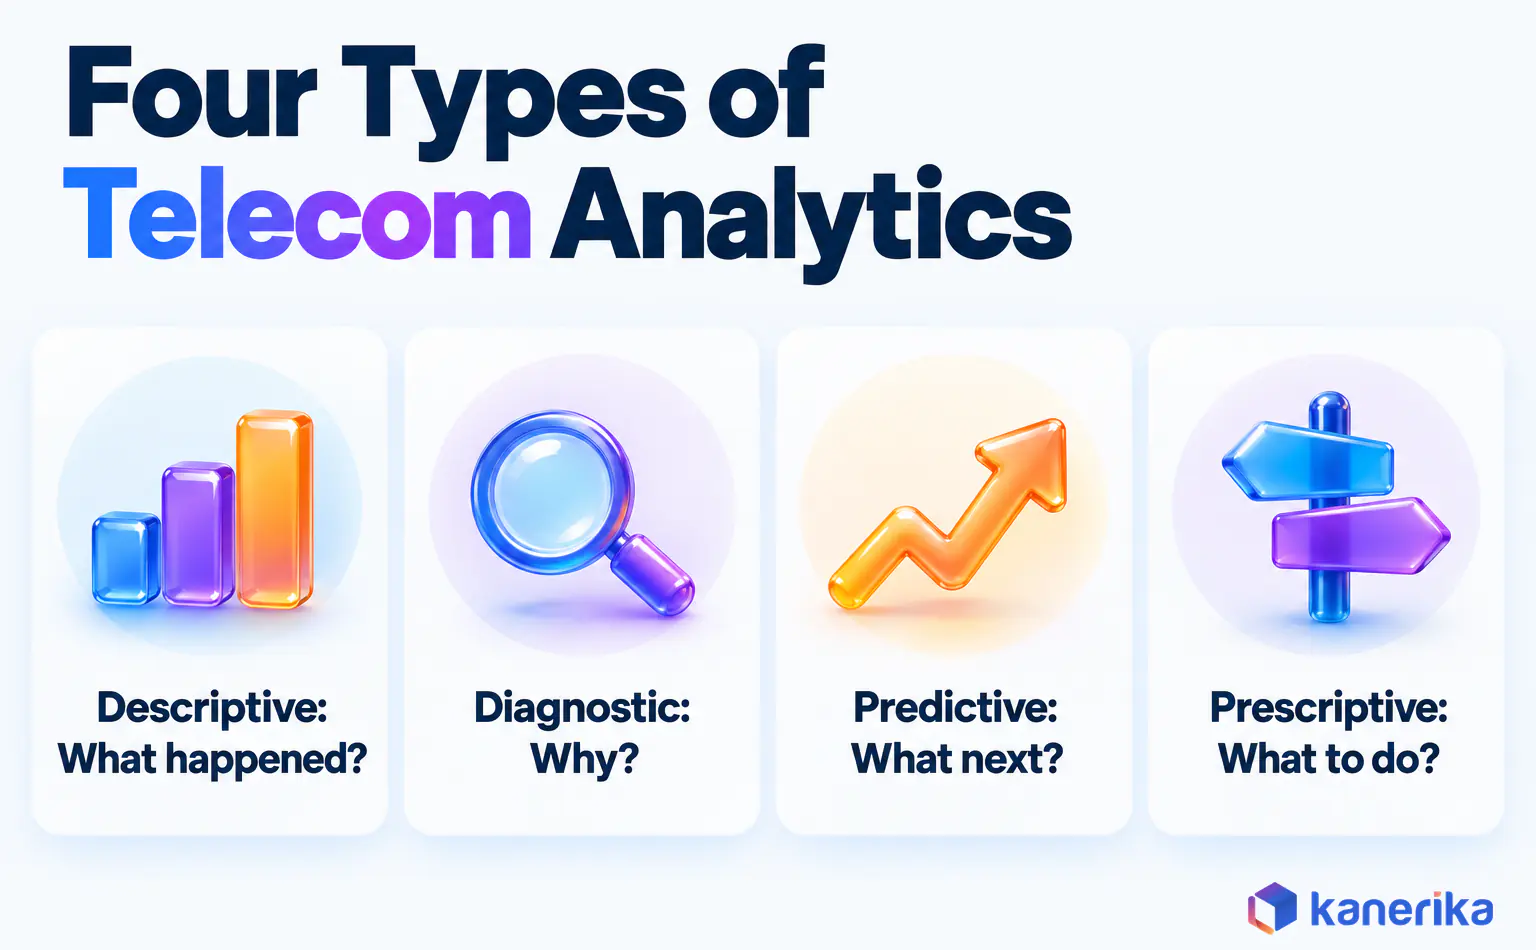
Four Types of Analytics on One Congestion Example
Analysts usually group the work into four types, from looking back to deciding what to do next. The congestion story from the opening shows how each type adds a different answer to the same problem. (The site count in the table is an illustration, not market data.)
| Type | Question it answers | On the evening congestion example |
|---|---|---|
| Descriptive | What happened? | Throughput on 14 sites fell below target on most weekday evenings |
| Diagnostic | Why did it happen? | Video traffic from new housing exceeded sector capacity at peak |
| Predictive | What will happen next? | Which accounts on those sites are likely to churn within 90 days |
| Prescriptive | What should we do? | Add capacity on the top sites first and send a retention offer to high-risk accounts |
Each type builds on the one before it, so a weak descriptive layer drags down every prediction that sits on top of it. For a deeper look at where reporting stops and forecasting starts, see this guide on business intelligence vs predictive analytics.
Telecom Analytics vs Network Analytics vs BI
These three terms overlap, and vendors also use them loosely. The difference comes down to scope: which data each one uses and who acts on the answer.
| Term | Scope | Main users |
|---|---|---|
| Telecom analytics | Network, customer, billing and operations data joined together | Strategy, marketing, finance, network planning |
| Network analytics | Performance, fault and traffic data from the network itself | Network operations and engineering |
| Business intelligence (BI) | Reports and dashboards over curated business data | Managers across every function |
In 5G, part of network analytics now lives inside the core network. The Network Data Analytics Function (NWDAF), defined in 3GPP TS 23.288 from Release 16, supplies analytics to other network functions. It helps the network tune itself, while enterprise analytics still answers the business questions about churn, revenue and capex.
Why Telecom Analytics Matters More in 2026
Telecom is a large business that is barely growing, so every gain has to come from running it better. Deloitte’s telecom outlook puts global telecom revenue at about US$1.55 trillion for 2025, up roughly 1.7% on the year before.
Since top-line growth is that thin, margin comes from three places. Operators keep the customers they already have, stop revenue from leaking between the network and the bill, and spend capex only where demand is proven.
Each of those is an analytics problem, and each is getting harder because 5G, fiber and multi-vendor equipment multiply the elements and counters a team has to watch.
AI raises the stakes again. Models can now flag a likely fault or churner faster than any analyst. But a wrong automated change to a live network can cause the very outage it meant to prevent. That is why what works in 2026 still keeps a person in the approval loop for network actions.
Why It Is Harder in Telecom Than Elsewhere
A retailer can usually join a customer to an order with one ID. A telecom operator often cannot, because one household may hold a mobile line, home fiber and a business account under three different IDs. Subscribers, devices, SIMs and sites also change over time, while old records rarely get cleaned up.
Multi-vendor equipment adds a second layer of mismatch. Each vendor’s element manager reports counters with its own names and units. Until someone maps those counters to one definition, the 14 congested sites from the opening cannot be compared side by side.
Regulation then narrows what you may do with the answer. CPNI rules limit how call and location data can be used for marketing. Of the likely churners on those sites, marketing may score only the accounts whose approval status allows it.
Two more traits add cost rather than confusion:
- Volume: network events arrive in the billions, so storing everything at full detail gets expensive fast.
- Legacy BSS: billing platforms built decades ago still hold the revenue truth and resist change.
None of these is a reason to wait. They are reasons to pick a narrow first use case where the keys can be fixed for one region or one product.
How Data Analytics in Telecom Works, Step by Step
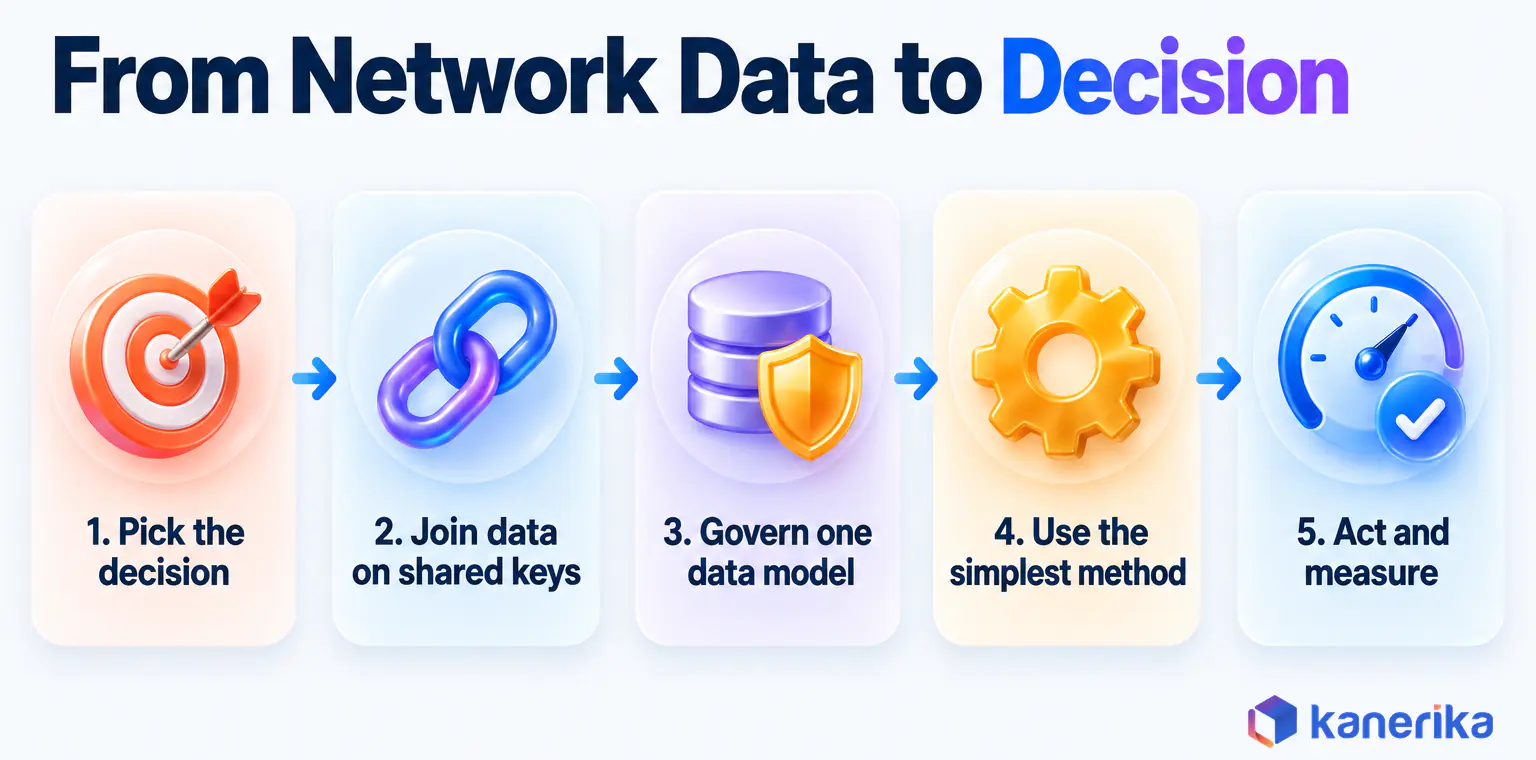
A telecom analytics program works like a supply chain for decisions. First, data moves from the network and customer systems into a governed model. Then a method turns it into a signal, and a team acts on it.
The five steps below follow that path, and the order matters more than the tools:
- Pick the decision and its baseline. Name one decision, such as which sites get capacity first, and record today’s result so you can measure change.
- Integrate the data with keys intact. Build data ingestion pipelines that keep subscriber, account and site identifiers consistent from source to model.
- Load a governed data model. Map sources to one shared model with clear owners, quality checks and access rules.
- Use the simplest method that works. Start with rules or statistics, and add machine learning only when it clearly beats them.
- Push the result into a workflow and measure. Send scores to the NOC queue, the CRM or the fraud desk, then compare outcomes with the baseline.
Step five is where most programs stall. A churn score that sits in a dashboard changes nothing, while the same score inside the care agent’s screen changes the next conversation. So treat the action owner as part of the design from the start.
Telecom Analytics Use Cases That Pay Back
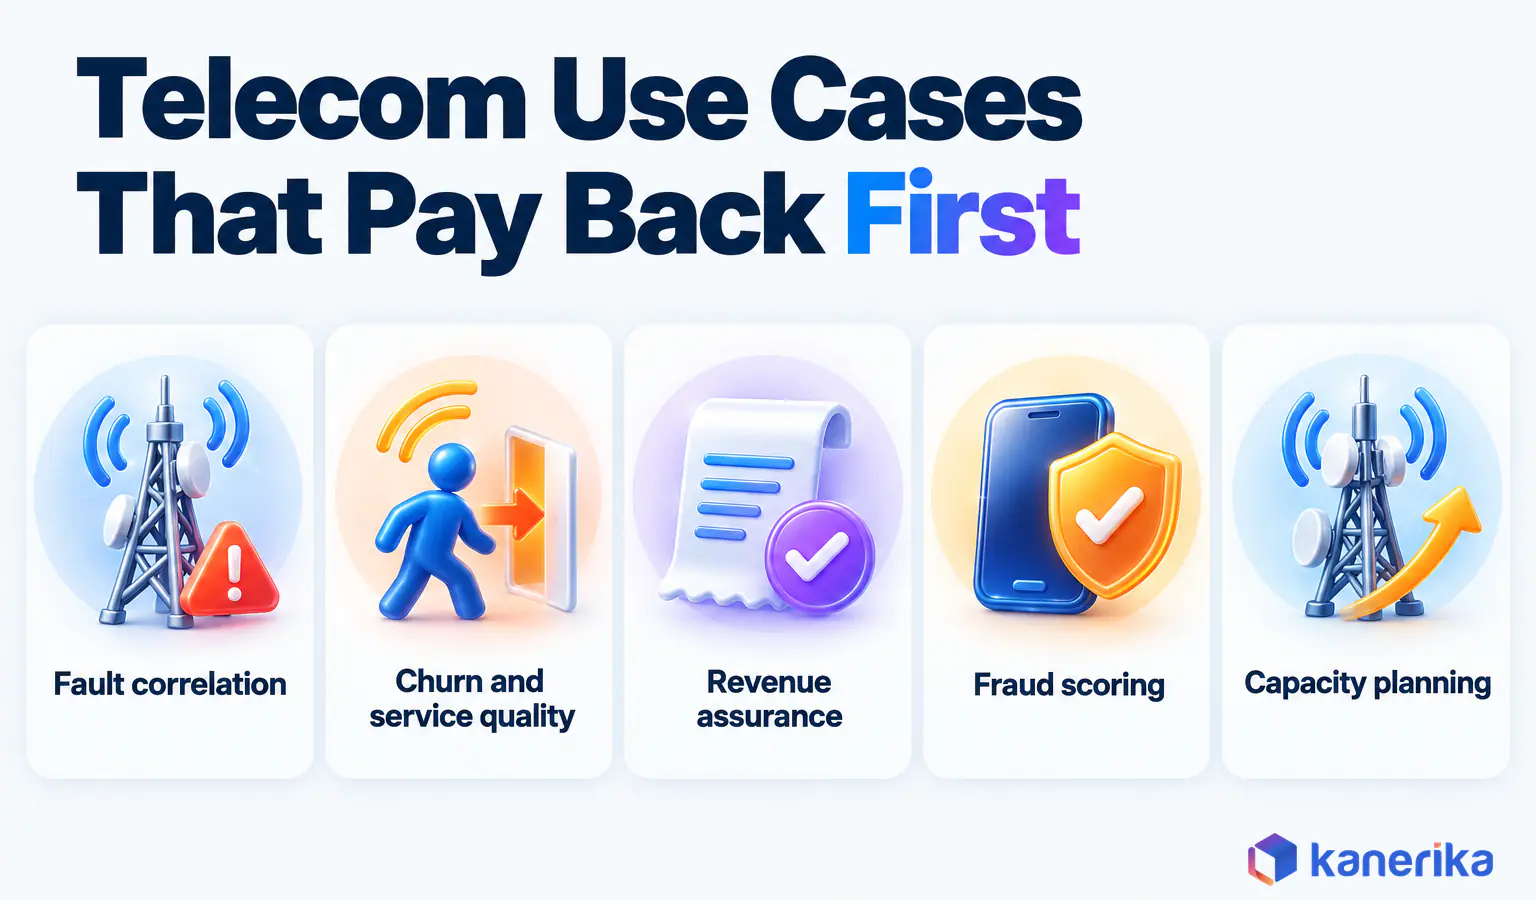
Not every use case is worth doing first. The ones that pay back quickest share three traits: a clear owner, data that already exists, and a number the finance team already tracks.
Network faults, churn, billing leakage and fraud all meet that test, so they lead the list. Capacity planning follows closely, because it steers the largest checks an operator writes each year.
The table ranks the common use cases by how fast they usually show value. Fast means a measurable result inside one 90-day pilot, while Medium usually needs more than one pilot cycle.
Slower means the use case leans on data and models from earlier rows. The last three rows build on the earlier ones in this way, so they get no section of their own below.
| Use case | Data needed | Latency | Success metric | Time to first value |
|---|---|---|---|---|
| Fault prediction and alarm correlation | Alarms, performance counters, inventory | Minutes | Avoided outage minutes, tickets per incident | Fast |
| Churn prediction tied to service quality | Network KPIs per account, CRM, billing | Daily | Churn rate versus a holdout group | Fast |
| Revenue assurance | Usage records, rating, billing | Daily to bill cycle | Recovered revenue, leakage rate | Fast |
| Fraud detection | Call records, SIM and account events | Seconds | Fraud loss, false positive rate | Medium |
| Capacity planning | Traffic by site, growth forecasts, cost | Weekly | Capex per unit of relieved demand | Medium |
| Pricing, next-best-offer and B2B SLA | Plan take-up, offer history, circuit performance | Daily (minutes for SLA warnings) | Margin per plan, offer take-up, SLA penalties avoided | Medium |
| Field operations | Tickets, truck rolls, repair outcomes | Daily | First-time fix rate | Medium |
| Location-based offers | Consented location and usage data | Minutes | Offer take-up | Slower |
| Customer lifetime value | Billing history, products, tenure | Monthly | Retention spend per account | Slower |
Network Fault Prediction and Alarm Correlation
A single fiber cut can trigger thousands of alarms across routers, radios and transport links within minutes. Engineers then spend the first hour working out which alarm is the cause and which ones are only symptoms.
Alarm correlation groups those alarms by topology and timing, so the NOC sees one incident with one probable root cause. Prediction goes a step further, because it watches for patterns such as rising error rates that tend to come before a failure. The same thinking also drives AI-driven predictive maintenance in other industries. Measure it in avoided outage minutes and fewer tickets per incident.
Churn Prediction Tied to Service Quality
Classic churn models look at contract end dates, payment history and complaints. Telecom operators can do better, though, by adding what the customer actually experienced on the network, such as dropped calls and slow evenings.
Joining those signals to accounts needs the subscriber and site keys described earlier. Then the model can tell a price-sensitive churner from one who is leaving because a nearby site is overloaded. Those two customers need very different responses, one an offer and the other a network fix.
Always keep a holdout group that receives no intervention, because that is the only honest way to prove lift. The core customer retention analytics metrics still apply, while the network signal is the telecom-specific edge.
Revenue Assurance and Billing Leakage
Revenue assurance checks that every billable event on the network ends up on a bill at the right price. Leakage creeps in when a usage record is dropped, a plan is mis-rated, or a service stays active after the account closed.
The analytics work is reconciliation at scale. Teams compare event counts from network records with rated and billed counts. They chase the gaps by product, region and system, because a small percentage of a large revenue base is real money.
Picture a roaming product where some usage records are dropped between mediation and rating. Network event counts for that product stay steady each day, but billed counts run below them, and that daily gap is the leakage.
Fraud Detection (IRSF, Wangiri, SIM Swap)
Telecom fraud differs from most revenue risks because losses pile up within minutes of a scheme starting, so a nightly score is too late. CFCA figures reported by TNS put global fraud losses at $38.95 billion in 2023 and $41.82 billion in 2025.
Three schemes come up again and again. International revenue share fraud (IRSF) pumps calls to premium numbers. Wangiri uses one-ring missed calls to bait expensive callbacks, while SIM swap fraud hijacks a number to take over bank accounts.
Each needs scoring in seconds, so this is one of the few places where streaming clearly pays. Keep a human review step for blocks that affect real customers, and borrow proven AI fraud detection techniques rather than building every model from scratch.
Capacity Planning and Capex Prioritization
Capacity planning decides where the next 5G sector, small cell or fiber build goes. Without analytics, those calls often follow the loudest region or last year’s plan.
With site-level demand forecasts, however, planners can rank builds by relieved congestion and by the revenue at risk on each site. The congestion example from the opening fits here, because the sites with the most churn risk move to the top of the list.
Kanerika Service
Data Analytics Consulting Services
Kanerika joins network, customer and billing data into one governed model and builds the churn, fault and revenue analytics your teams act on every day.
Explore Data Analytics ServicesPricing, Next-Best-Offer and B2B SLA Analytics
Pricing analytics tests how plan changes affect take-up and margin before they launch to every customer. A small regional test with a control group beats a national rollout built on assumptions.
Next-best-offer models suggest the right upgrade, add-on or retention offer for each account. They work best when care and digital channels share the same recommendation, so a customer does not hear two different offers in one week.
B2B SLA analytics tracks enterprise circuits against contracted targets and warns account teams before a breach turns into a penalty. For chat assistants, network summaries and other generative AI use cases in telecom, see the dedicated guide.
Batch, Near-Real-Time or Streaming: What Each Decision Needs
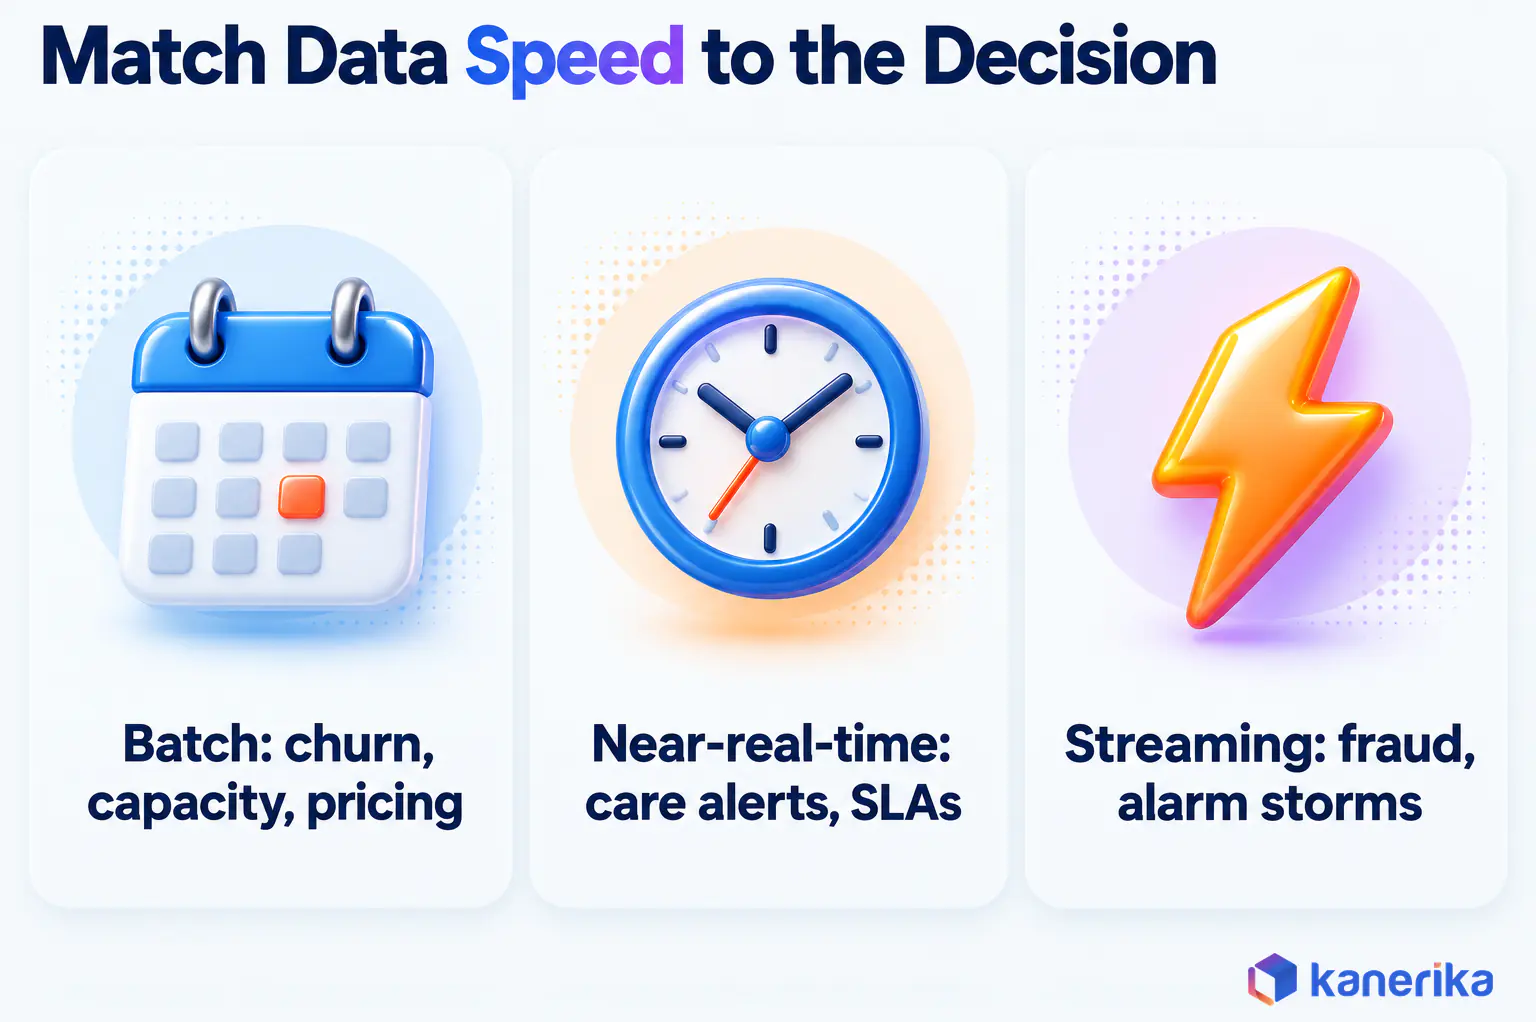
Speed costs money, so match it to the decision rather than to the data. A churn model refreshed nightly is fine, because a retention call tomorrow morning is still in time.
A fraud score refreshed nightly is useless, since the fraudulent calls have already been made. Ask how much a one-hour delay costs for each decision, and then buy streaming only where that cost is real.
| Mode | Typical delay | Good fit | Watch out for |
|---|---|---|---|
| Batch | Hours to daily | Churn scoring, capacity plans, revenue assurance, pricing | Late answers when the decision is urgent |
| Near-real-time | Minutes | Care alerts, SLA warnings, field dispatch | More pipeline jobs to monitor |
| Streaming | Seconds | Fraud scoring, alarm storms, SIM swap checks | Higher run cost and harder testing |
Most operators end up with a mix: a small streaming layer feeds the urgent decisions, while batch handles everything else. The broader method behind this split is covered in Kanerika’s guide to operational analytics.
Rules, Machine Learning or AI Agents
The method should follow the risk of the decision and how much explanation it needs. A regulator, an engineer or a customer may all ask later why a decision was made.
| Method | Best for | Explainability | Human approval |
|---|---|---|---|
| Rules and thresholds | Known fraud patterns, SLA breaches, alarm filters | High | Optional for low-risk actions |
| Machine learning | Churn, fault prediction, demand forecasts | Medium, with feature reports | Required for customer-facing blocks |
| AI agents | Triage, summaries, drafting next steps for engineers | Lower, needs logging | Required before any network change |
Agents are useful for reading tickets and suggesting a fix, but the approval step stays with a person. Keeping approval with a person limits the damage a wrong suggestion can do, while the agent still saves the engineer reading and triage time.
Choosing a Platform: Fabric, Databricks or Snowflake
All three major platforms can run telecom analytics, so the choice usually follows your existing skills and cloud contracts. Each also has a native way to ingest streaming data, which matters for fraud and fault use cases.
| Platform | Streaming capability (verified in vendor docs) | Tends to fit |
|---|---|---|
| Microsoft Fabric | Real-Time Intelligence: Eventstreams ingest without code, Eventhouse stores events, Activator triggers actions | Microsoft estates with Power BI already in use |
| Databricks | Structured Streaming ingests incrementally; Auto Loader processes new files as they arrive | Engineering-led teams building many ML models |
| Snowflake | Snowpipe Streaming writes rows directly into tables without staging files | SQL-first analytics teams sharing data widely |
Cost drivers are similar across the three: compute hours, always-on streaming jobs, storage of raw event history and data movement between clouds. For the full head-to-head, read the Databricks vs Snowflake vs Fabric comparison.
Datasheet
Snowflake vs Databricks vs Microsoft Fabric Datasheet
A side-by-side datasheet on the three platforms, to shortlist the one that fits your telecom data, skills and cloud contracts.
Get the Datasheet →A Decision Framework for Your First Telecom Analytics Use Case
The first use case sets the tone for everything after it. A quick win earns budget and trust, while a stalled project makes the next one twice as hard to fund.
Score each candidate against five questions before you commit:
- Measurable value: is there a number finance already tracks, such as churn, leakage or outage minutes?
- Data readiness: do the sources exist with keys you can join for at least one region?
- Action owner: is a named team ready to act on the output every day or week?
- Latency: does the decision need seconds, minutes or a daily refresh?
- Compliance: does it touch CPNI or location data, and is approval in place?
The answers usually point to one of a few standard starting points, shown below.
| If your situation is | What works first |
|---|---|
| Rising churn in specific regions | Batch churn model joined to site-level network quality, with a holdout group |
| Frequent alarm storms and long outages | Near-real-time alarm correlation feeding the NOC queue |
| Bill disputes or suspected leakage | Daily event-to-bill reconciliation by product |
| Fraud losses on international routes | Streaming rules plus a scoring model, with human review of blocks |
| A large capex round coming up | Weekly site demand forecasts ranked by revenue at risk |
A Worked Churn Example
The inputs below are illustrative assumptions for the arithmetic, not market statistics.
Say a model flags 10,000 high-risk postpaid accounts in one region. You then send a retention offer to 5,000 and hold out the other 5,000. Over 90 days, 8% of the holdout churns (400 accounts) against 6% of the treated group (300 accounts), so the offer saved 100 accounts.
If each saved account is worth $600 in the next year ($50 a month for 12 months), that is $60,000 retained. Then subtract a $5 credit for each of the 5,000 treated accounts, or $25,000, and the net gain is $35,000. Without the holdout, you could not tell those 100 saves from customers who would have stayed anyway.
Checklist
Data Analytics Checklist
A downloadable checklist to plan your first analytics use case, from baselining the metric and mapping sources to governance and adoption.
Get the Checklist →CPNI, Data Governance and Common Mistakes
Telecom data carries legal duties that most other industries do not face. Getting governance right early is cheaper than retrofitting it after a pilot has already copied sensitive data into five places.
CPNI and US Privacy Rules
Under 47 U.S.C. 222, carriers may use customer proprietary network information to provide the service itself. Beyond that, they need customer approval unless the law requires disclosure. CPNI covers the quantity, technical configuration, type, destination, location and amount of a customer’s use of a service.
The FCC’s implementing rules sit in 47 CFR 64.2001-64.2011. They cover customer approval (64.2007), safeguards (64.2009) and notification of CPNI breaches (64.2011).
Analytics teams therefore turn those rules into role-based access and masked identifiers in shared datasets. They also keep audit trails on every query that touches call or location detail. Marketing use cases should check approval status before scoring an account, not after. These controls build on general data governance best practices, with CPNI as the telecom-specific layer.
Data Quality, Lineage and Ownership
Broken subscriber keys are the most common quality failure. When a number is ported, a SIM is swapped or an account merges, records drift apart and models quietly lose accuracy.
Stale network inventory causes the second failure, because analytics then blames the wrong site or misses new equipment. Assign an owner to each key table, track lineage from source to report, and run quality checks before every model refresh. A clear data quality framework makes those checks repeatable.
Seven Mistakes That Sink Telecom Analytics ROI
The same handful of mistakes show up across operators of every size. Each one has a known consequence and a simple fix.
- Buying a platform before picking a decision. The build drags on without a target, so pick one metric before any purchase.
- Ignoring broken keys. Joins fail silently and models mislead, so fix identity for one region first.
- Streaming everything. Run costs climb with little gain, so stream only where delay costs money.
- Skipping the holdout. Nobody can prove lift, so keep a control group on every intervention.
- No action owner. Scores sit in dashboards, so wire output into a team’s daily queue.
- Treating CPNI as an afterthought. Projects stall in legal review, so design access controls on day one.
- Automating network changes without approval. One bad change can cause an outage, so keep a person in the loop.
How Kanerika Delivers Telecom and Connectivity Analytics
Kanerika’s data analytics consulting team runs telecom and connectivity work in five stages that follow the steps above. Each stage ends with a result the client can check before the next one starts.
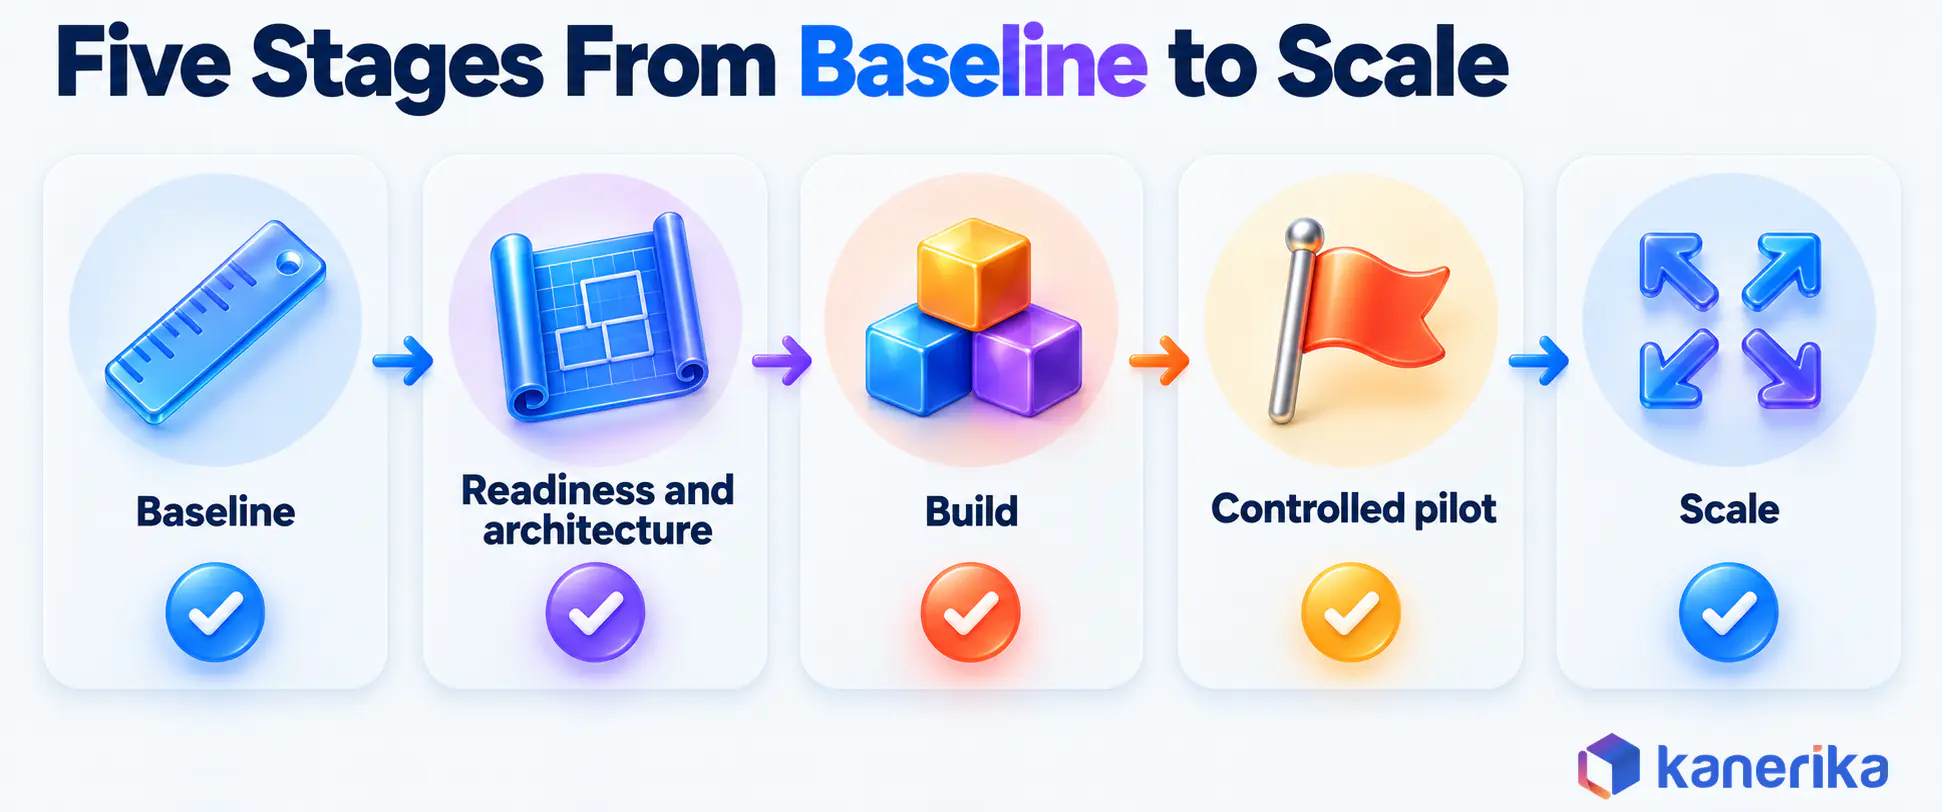
- Baseline: agree the decision, the metric and today’s number.
- Readiness and architecture: assess sources, keys and CPNI controls, then design the target model.
- Build: create the pipelines, the governed model and the first method.
- Controlled pilot: run with a holdout group in one region or product line.
- Scale: extend what worked to more regions, with monitoring and ownership in place.
One example comes from a smart connectivity and connected-vehicle telemetry provider facing a telecom-style problem. Device data arrived in one fixed message format, while each customer needed its own.
| Challenge | Approach | Result |
|---|---|---|
| Binary datalogger data went out in one default message structure that downstream customers could not use directly | Kanerika used its FLIP low-code platform to convert JSON, Excel and Kafka messages into each customer’s format | 24% less data integration time and 27% better operational efficiency |
| Custom transformation logic caused delays and operational inefficiency | Personalized message transformation was added to the analytics tooling | 16% higher customer satisfaction and 20% better resource utilization |
The full telemetry data integration case study covers the build in more detail. The lesson carries over to operators directly, because clean, joined device and event data comes before any model.
Case Study
27% Faster Operations with FLIP Data Integration
Kanerika helped a smart connectivity and connected-vehicle telemetry provider use FLIP to turn device messages into each customer’s format, cutting data integration time by 24% and lifting operational efficiency by 27%.
Read the Case Study →What Actually Works in Telecom Analytics in 2026
What works is narrower than most vendor decks suggest. Start from one decision with a baseline, join network and customer data on keys you trust, and use batch unless delay truly costs money.
A 90-day plan keeps the first project honest:
- Start (weeks 1-3): pick the decision, record the baseline, map sources and confirm CPNI approval rules.
- Build (weeks 4-8): build the pipelines and governed model for one region, then train or configure the first method.
- Pilot (weeks 9-12): run the pilot against a holdout, with a named team acting on every output.
Scale when the pilot beats its holdout by a margin finance accepts. Fix and rerun when the data broke but the signal looked real, and stop when neither is true. Data analytics in telecom works in 2026 when one measured decision, made by people who own it, proves its value before the next one starts.
Frequently Asked Questions
What is data analytics in telecom?
Data analytics in telecom is the practice of turning network, customer and billing data into decisions that cut cost, protect revenue or improve service. It covers network telemetry, call records, OSS and BSS data. Typical outputs include fault alerts, churn scores, fraud flags and capacity plans that a named team acts on every day.
What are the four types of telecom data analytics?
The four types are descriptive, diagnostic, predictive and prescriptive analytics. Descriptive shows what happened, such as falling throughput on a site. Diagnostic explains why, for example peak video traffic. Predictive estimates what comes next, such as likely churners, and prescriptive recommends the action, like adding capacity or sending a retention offer.
Why does data analytics matter to telecom operators in 2026?
Growth is thin, with Deloitte putting global telecom revenue at about US$1.55 trillion for 2025, up roughly 1.7 percent. Margin therefore comes from keeping customers, stopping revenue leakage and spending capex where demand is proven. Analytics drives all three, while 5G, fiber and multi-vendor networks make manual monitoring harder every year.
How does data analytics reduce customer churn in telecom?
Analytics reduces churn by finding at-risk accounts early and showing why they may leave. Joining dropped calls and slow evenings to each account separates price-driven churners from those hit by poor service. Teams then send offers or fix the network, and they compare results with an untouched holdout group to prove real lift.
How is customer data (CPNI) protected in telecom analytics?
Under 47 U.S.C. 222, carriers may use CPNI to provide the service itself, but other uses need customer approval unless the law requires disclosure. The FCC rules in 47 CFR 64.2001 to 64.2011 cover approval, safeguards and breach notification. Analytics teams apply role-based access, masking of identifiers and audit trails on every query touching call or location detail.
When does a telecom operator need real-time analytics?
An operator needs real-time analytics when a delay of minutes costs real money or service. Fraud scoring, SIM swap checks and alarm storms fit that test, because the damage happens within seconds. Churn models, capacity plans and revenue assurance work well in daily or weekly batches, which cost far less to run and test.
How do telecom companies use data analytics?
Telecom companies use data analytics to predict network faults, correlate alarm storms, reduce churn, find billing leakage and stop fraud. They also forecast demand by site to rank capex, tune pricing and track enterprise SLAs. The strongest programs push each result into a working queue, such as the NOC, the CRM or the fraud desk.
Which tools and programming languages are used for telecom analytics?
Most teams use SQL and Python, with Spark for large event volumes. Common platforms include Microsoft Fabric, Databricks and Snowflake, plus BI tools such as Power BI for reporting. Streaming services like Fabric Eventstreams, Databricks Structured Streaming or Snowpipe Streaming handle fraud and fault data that needs scoring within seconds of arrival.
How do telecom operators use data science and machine learning?
Operators use machine learning to predict churn, forecast traffic by site, spot equipment likely to fail and score fraud in real time. Data scientists usually start with rules or simple statistics, then add models only when they clearly beat the baseline. Any automated network change should still pass a human approval step first.
Which KPIs should telecom analytics track?
Track the numbers tied to each decision. For networks, that means outage minutes, dropped call rate, throughput and tickets per incident. For customers, track churn rate against a holdout group, complaints and lifetime value. For finance, track leakage rate, fraud loss, false positive rate and capex per unit of relieved demand.
What types of data do telecom operators generate?
Operators generate network telemetry and probe data, call and event detail records, and OSS data on inventory, faults and performance. They also hold BSS data on rating, billing and CRM, digital and app journey data, and field operations records. Each source refreshes at a different speed, from seconds for telemetry to monthly for bills.
What are the main challenges of data analytics in telecom?
The biggest challenge is identity, because one household may hold mobile, fiber and business accounts under different IDs. Multi-vendor equipment reports counters in different formats, event volumes are huge, and legacy billing systems resist change. CPNI rules also limit how call and location data can be used, so governance must start early.
What is network data analytics, and what is NWDAF in 5G?
Network data analytics studies performance, fault and traffic data from the network itself. In 5G, the Network Data Analytics Function (NWDAF) supplies analytics to other network functions inside the core. 3GPP defines it in TS 23.288, starting with Release 16. It helps the network tune itself, while enterprise analytics still handles churn, revenue and capex questions.
How does data flow from the network to an analytics platform?
Network elements and probes emit counters, alarms and event records. Ingestion pipelines collect them in batches or as streams and keep subscriber and site keys intact. The data lands in a governed model next to billing and CRM data. Methods then score that data, and results flow into the NOC, care or fraud queues.