
TL;DR
Business analytics in logistics pays off first in freight audit and carrier scorecards, then ETA exception management, while route optimization should wait. It turns TMS, WMS, ERP and EDI data into daily decisions on carriers, labor and inventory. Start with descriptive and diagnostic analytics on one governed data model, because predictions built on disputed numbers fail. Define each KPI once, including which timestamp counts and whether OTIF is measured by shipment or by order. Then roll out in three phases, visibility, prediction and prescription, and give each phase an exit test. Finally, record a baseline before the project starts so the savings can be proven.
Key Takeaways
- Business analytics in logistics turns shipment, warehouse, carrier and invoice data into decisions, so every team acts on one version of events.
- Adopt the four analytics types in order, descriptive, diagnostic, predictive and then prescriptive, because each one needs the data of the type before it.
- Freight audit, carrier scorecards and ETA exceptions usually pay back first, since their data already sits in TMS and EDI feeds.
- Write every KPI rule down once, or two teams will report two different OTIF numbers for the same week.
- A governed data model with clean carrier, location and SKU master data matters more than the choice of BI tool.
- Kanerika also cut report generation time by 80% for a US 3PL with Power BI dashboards on Microsoft Fabric.
When Three Systems Give Three Reasons for One Late Load
Picture the Monday operations review at a regional food and beverage distributor. A full truckload reached a grocery customer’s DC four hours late on Friday, and since then a chargeback has arrived.
Transportation opens the TMS, where the delay is coded as a carrier problem. In the warehouse, however, the WMS shows that the trailer left the dock on time. Someone then pulls the carrier’s EDI 214 status message, which says the delivery appointment was missed at the customer’s dock.
Each system is right about its own slice of the trip. Nobody can say why the load was late, though, so nobody can say what to fix. The meeting ends with three spreadsheets and no decision.
That gap is where business analytics in logistics starts. Before any forecast or optimization model can help, the business needs one agreed version of what happened to each shipment. This guide shows how to build that version, which use cases to fund first, which KPIs to track and how to prove the return.
What Is Business Analytics in Logistics?
Business analytics in logistics combines shipment, warehouse, carrier and cost data into one trusted model. Teams then use that model to explain performance, predict problems and recommend actions. It covers transportation, warehousing, inventory and freight spend, especially for people who make daily operating decisions.
The word “business” matters here because the goal is a decision someone acts on. A report might say that on-time delivery fell to 88% in a given week. Analytics then shows which lanes, carriers and docks caused the drop. It also shows what the drop cost and whether it will happen again.
Much of the work is plumbing rather than math. Logistics data is spread across systems that were never designed to agree, so the first job is to bring them together under shared rules. Our guide to business analytics covers the wider discipline outside logistics.
Where Logistics Data Comes From
Because each system records a different part of the same shipment, a typical logistics operation needs several of them joined together. The transportation management system (TMS) plans and tenders loads, while the warehouse management system (WMS) tracks receiving, picking and shipping. Carriers then report progress through EDI messages and APIs.
Three X12 EDI transaction sets matter most for US truckload analytics, especially for carrier and invoice data. The X12 standard names the 204 the Motor Carrier Load Tender and the 210 the Motor Carrier Freight Details and Invoice. Finally, the 214 is the Transportation Carrier Shipment Status Message. Sensors add a further layer of readings, and our guide to IoT in logistics and supply chain covers that hardware side.
| Source | What it records | Typical refresh |
|---|---|---|
| TMS | Load plans, tenders, rates and carrier assignments | Near real time to hourly |
| WMS | Receipts, putaway, picks, shipments and labor | Near real time |
| ERP | Orders, invoices, item and customer masters | Hourly to daily |
| ELD and telematics | Location, hours of service, engine and fuel data | Every few minutes |
| X12 EDI 204, 210 and 214 | Load tenders, freight invoices and shipment status events | Per event, but often sent in batches |
| Carrier APIs | Tracking events, ETAs and proof of delivery | Minutes to hourly |
| IoT sensors | Temperature, shock, door and location readings | Seconds to minutes |
Business Analytics vs Supply Chain Analytics vs Logistics BI
These three terms overlap, so teams often talk past each other. The real difference is scope, that is, how far upstream the analysis reaches and whether it stops at reporting.
Supply chain analytics spans the whole network, including sourcing and production planning as well as inventory. Logistics BI, on the other hand, usually means dashboards on transport and warehouse data. Business analytics sits between them, because it goes past dashboards into diagnosis and prediction while staying focused on moving and storing goods.
| Dimension | Business analytics | Supply chain analytics | Logistics BI |
|---|---|---|---|
| Scope | Transport, warehousing, freight spend and delivery | Sourcing to delivery, such as suppliers and production | Transport and warehouse reporting |
| Main question | Why did it happen, and what happens next? | How should the whole network plan and buy? | What happened? |
| Typical outputs | Diagnostic views, ETA risk models and cost analysis | Demand plans, inventory policy and supplier risk | Dashboards and scheduled reports |
This guide stays inside the logistics scope. When a question reaches into supplier planning or production, the sections below point to the related guides that cover it.
Kanerika Service
Logistics and Supply Chain Data Solutions
Kanerika connects TMS, WMS, ERP and carrier data into one governed model for shipment visibility, freight cost control and delivery prediction.
Explore Logistics SolutionsThe Four Types of Logistics Analytics and the Order to Adopt Them
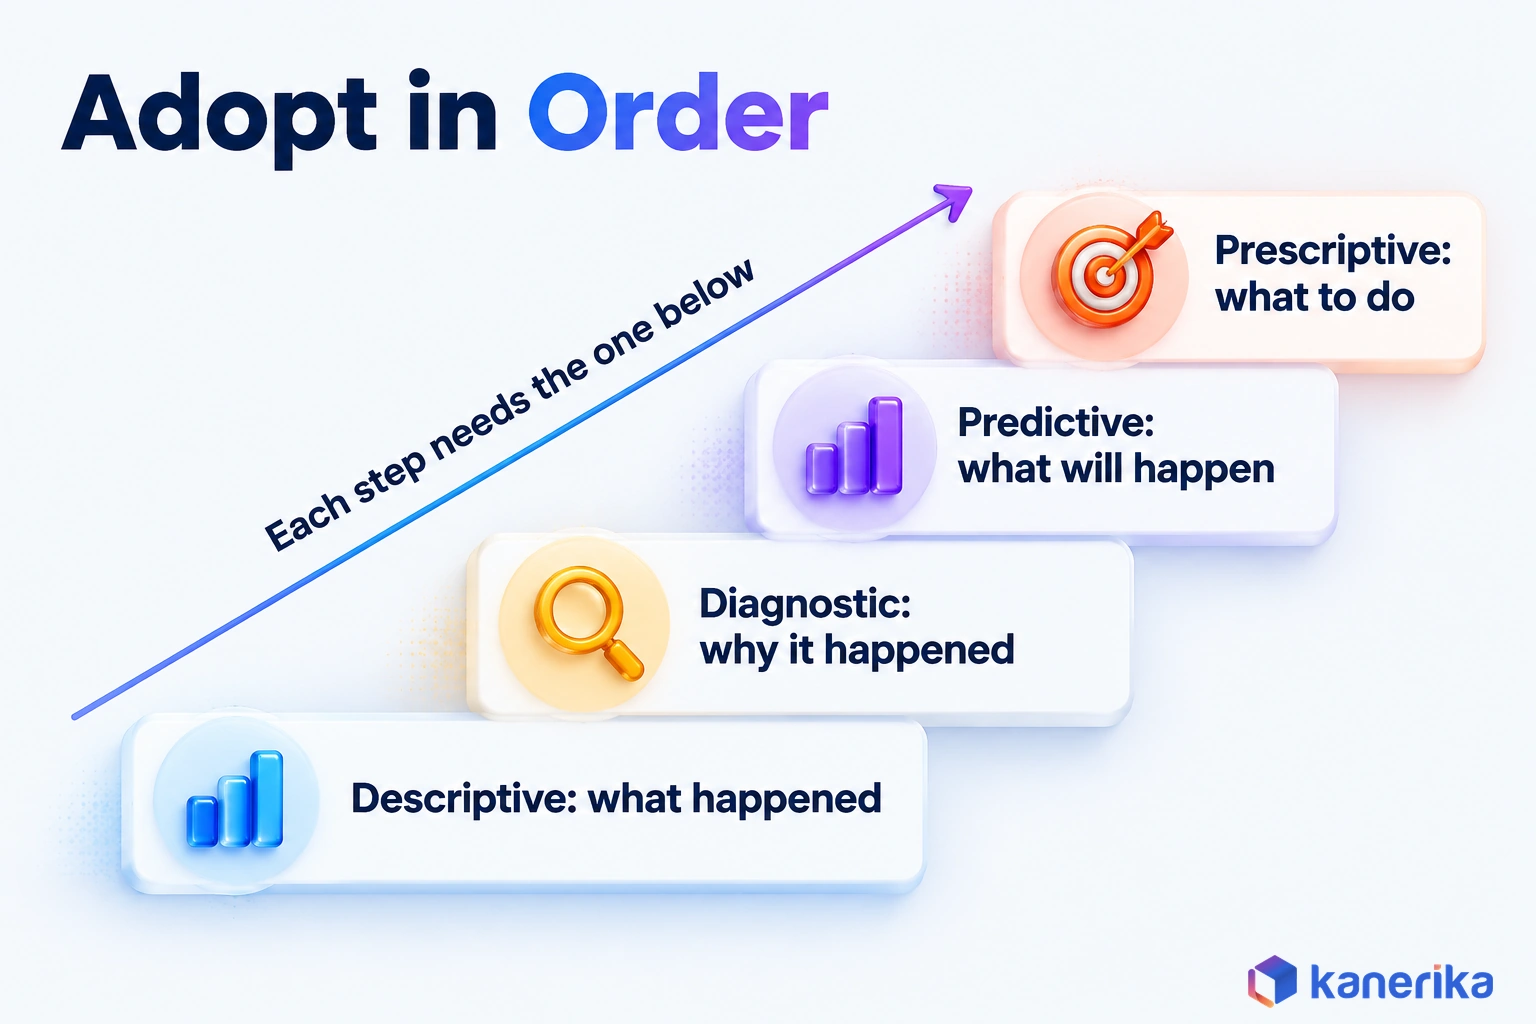
Logistics analytics comes in four types, and each one answers a harder question than the one before. Teams that skip a step often stall, because every type depends on the data discipline of the type below it.
Descriptive analytics reports what happened, such as on-time delivery by lane for the past month. Diagnostic analytics explains why, for example by tracing late loads to one dock’s appointment backlog. Both run on history you already hold, so they are the natural place to start.
Predictive analytics estimates what will happen next, such as which of tomorrow’s loads are likely to arrive late. It needs months of clean and consistently coded history, because a model also learns the mistakes in its training data. Our guide to machine learning in predictive analytics covers how those models learn.
Prescriptive analytics recommends what to do, for instance moving a load to another carrier or changing a pick wave. A dispatcher still approves or overrides each recommendation. Once those recommendations turn into actions that software takes on its own, the subject becomes agentic AI in supply chain, which needs its own controls.
What Each Type Needs From Your Data
| Type | Question | Logistics example | Data needed |
|---|---|---|---|
| Descriptive | What happened? | On-time delivery by lane and carrier for the past month | Clean shipment history with agreed timestamps |
| Diagnostic | Why did it happen? | Late loads traced to one DC’s appointment backlog | Joined TMS, WMS and carrier status data |
| Predictive | What will happen? | A late-arrival risk score for each open load | Consistent history and live status feeds |
| Prescriptive | What should we do? | A suggested carrier swap for loads at risk | Predictions, costs, constraints and override logs |
The order matters more than the ambition. A team with disputed descriptive numbers will also get disputed predictions, only faster.
Where Business Analytics Pays Off First in Logistics
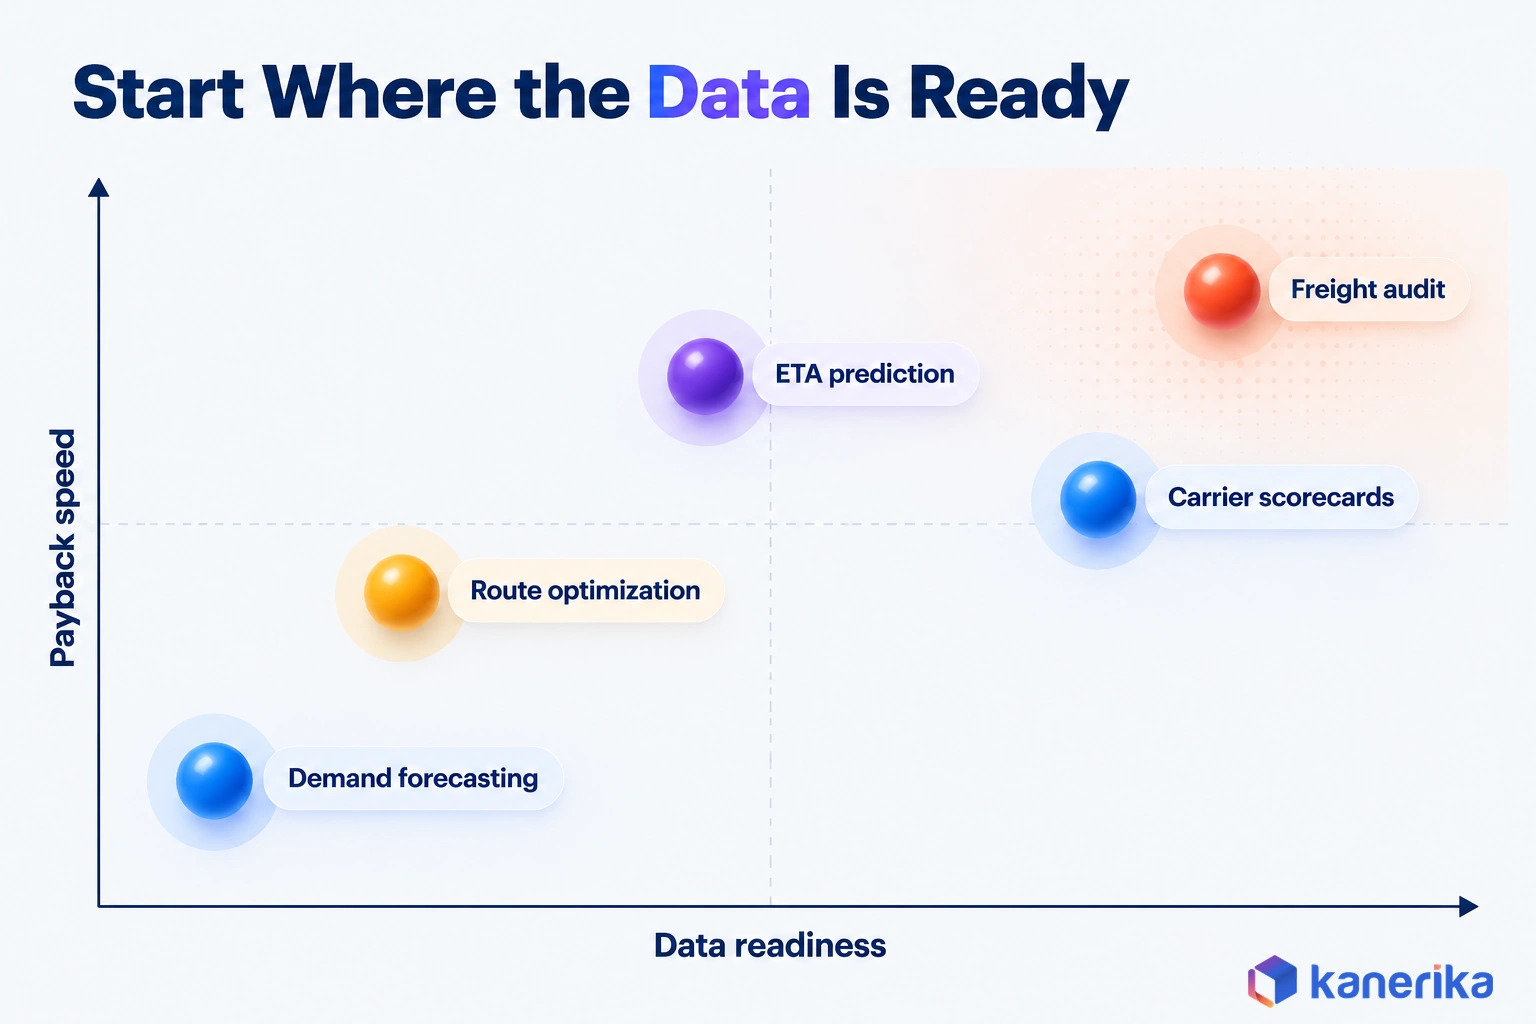
The use cases that pay back first share two traits. First, their data already exists in usable form. Second, one team owns the result and can act on it within weeks, which is why the order of investment matters.
The table ranks common use cases by data readiness as well as payback speed. It reflects where data usually sits at a mid-sized shipper or 3PL, so adjust it to your own systems before you commit a budget. A shipper whose carriers do not yet send EDI 214 status events, for instance, should move carrier scorecards down a row.
| Use case | Data needed | Typical first KPI | Time to first result |
|---|---|---|---|
| Freight audit and spend analytics | Contract rates, EDI 210 invoices and shipment records | Billing error rate | Fast |
| Carrier performance and on-time delivery | TMS loads, EDI 214 status and proof-of-delivery times | On-time delivery by carrier and lane | Fast |
| ETA prediction and exception management | Status history, live tracking and appointment data | Late loads flagged before departure | Medium |
| Warehouse labor and fulfillment | WMS task and labor records | Picks per labor hour | Medium |
| Route and load optimization | Clean addresses, time windows and vehicle limits | Miles per stop and load utilization | Slower |
| Demand and inventory forecasting | Order history, promotions and lead times | Forecast error | Slower |
Freight audit sits at the top for a plain reason. Its two inputs, the contract rate table and the EDI 210 invoice, already arrive in structured form. Every invoice can be checked against a contract rate and a shipment record, so each error shows up as money you can recover.
Freight Audit and Spend Analytics
Freight invoices drift away from contracts in small but costly ways. For example, a fuel surcharge uses the wrong index week, or a detention charge appears without a matching delay. Another lane bills at a spot rate instead of the contract rate. Each error is minor, but across thousands of invoices they add up.
Spend analytics matches every EDI 210 invoice line to the tendered rate, the accessorial rules and the shipment’s actual events. Mismatches then go to an auditor with the evidence attached. Over time, the same data also shows which carriers and lanes create the most disputes. Trax, a transportation spend management company that audits freight invoices, rebuilt that audit process with Kanerika. Invoice processing accuracy rose by 85%, and processing time fell by 41%.
Carrier Performance and On-Time Delivery
Carrier scorecards are the second quick win, since TMS and EDI 214 feeds already hold most of the data. A scorecard then compares carriers on on-time pickup, on-time delivery, tender acceptance and claims, lane by lane.
Lane-level detail matters because a carrier can be excellent on one lane and poor on another, and an average hides that. With a lane view, procurement can move volume at the next bid based on evidence rather than anecdote. Claims data adds another angle by showing which carriers damage freight most often.
ETA Prediction and Exception Management
Exception management means catching the loads that will miss their window while there is still time to act. A model scores each open load for late-arrival risk, based on its route and carrier history as well as departure time and live tracking. Planners then work the riskiest loads first instead of the oldest ones. Our guide to AI in logistics covers more of these model-driven use cases.
The same data also reduces “where is my order” (WISMO) calls. When customer service can see a predicted ETA and the reason for a delay, the call is short or never happens. Tracking WISMO calls by customer also shows where proactive alerts would save the most effort.
Inbound parts logistics has to catch late loads early too, as our guide to data analytics in the automotive industry explains. In one Kanerika project, a carrier that moves high-value items such as artwork and luxury cars needed sharper ETAs. Its delivery-prediction model improved delivery-time prediction by 45% and reached 87% accuracy.
Case Study
45% Better Delivery-Time Prediction for Niche Logistics
An AI model for a firm moving high-value items improved delivery-time prediction by 45%, cut operational expenses by 26% and reached 87% accuracy.
Read the Case Study →Warehouse Labor and Fulfillment Analytics
Inside the DC, analytics turns WMS task data into labor plans. Pick rates by zone and shift show where to add people before a wave backs up. Dock-to-stock time shows how long received goods wait before they are available to pick.
Slotting analysis is a quieter win, but a real one. Moving the fastest-selling SKUs closer to pack stations shortens travel for every picker. The WMS also holds the pick history needed to find them.
Picture a night shift whose pick rate drops in one zone while the other zones hold steady. The pick history shows why. That zone’s fast movers were slotted at the back, so pickers walk the full aisle for the most common lines. The planner moves those SKUs to the bays nearest the pack station before the next wave, then checks the zone’s rate on the following shift.
Route and Load Optimization
Route optimization is the best-known logistics analytics story, largely because of UPS. In 2015, UPS said it expected its ORION routing system to cut 100 million miles a year once fully implemented in 2016. The company also projected savings of about 10 million gallons of fuel and more than $300 million a year after its US rollout. Those figures are 2015 company projections, not audited results.
Results at that scale, however, depend on accurate addresses, stop times and vehicle limits. Load optimization follows the same rule, because cube and weight use only improve once item dimensions and order profiles are right. For most shippers, this use case therefore belongs after the data model is stable.
Demand and Inventory Forecasting
Forecasting sits last in the ranking because it needs the longest clean history and touches the most teams. Better demand forecasting lets a DC staff ahead of volume and place inventory before demand arrives. Forecast error shows up on the floor, because a high forecast pays for idle shifts while a low one brings overtime and missed cutoffs. Our guide to predictive analytics in supply chain also covers the model side in depth.
Upstream signals help too. When a supplier plant changes its production schedule, inbound appointment volumes at the DC shift with it. Receiving plans should follow the manufacturing industry trends that affect your suppliers, so dock slots match what will actually arrive.
Which Logistics KPIs Should You Track?
A KPI earns its place only if it changes a decision. The ten below cover service, cost, asset use and accuracy, so each one maps to a weekly choice.
Start with five of them, because trust takes time to build. A sensible first set is on-time delivery, OTIF, freight cost per shipment, pick accuracy and dock-to-stock time. The rest can follow once those numbers are trusted.
| KPI | Formula | Decision it supports |
|---|---|---|
| On-time delivery (OTD) | Deliveries inside the promised window ÷ total deliveries | Carrier allocation and customer commitments |
| On time in full (OTIF) | Orders delivered on time and complete ÷ total orders | Service reviews and chargeback disputes |
| Freight cost per shipment | Total freight spend ÷ shipments | Mode and carrier mix |
| Freight cost as % of sales | Freight spend ÷ net sales × 100 | Pricing and budget |
| Load utilization | Weight or cube used ÷ trailer capacity | Consolidation and load building |
| Pick accuracy | Correct order lines picked ÷ total lines picked | Training and slotting |
| Dock-to-stock time | Time from receipt until stock is available to pick | Receiving staff levels |
| Order cycle time | Time from order placement to delivery | Promise dates and order cutoffs |
| Carrier claims rate | Shipments with claims ÷ total shipments | Carrier scorecards and packaging |
| Forecast error | Average absolute error ÷ actual demand | Safety stock and labor planning |
How to Define KPIs So Every Team Gets the Same Number
Two teams can both report OTIF and still disagree, because each made different choices inside the formula. The fix is a written definition that settles every choice once.
For example, consider one illustrative week at a DC that shipped 100 orders in 160 shipments. Sixteen shipments failed, but they belonged to only 15 orders. Measured by shipment, OTIF is therefore 144 of 160, or 90%. Measured by order, however, one failed shipment fails the whole order, so it is 85 of 100, or 85%.
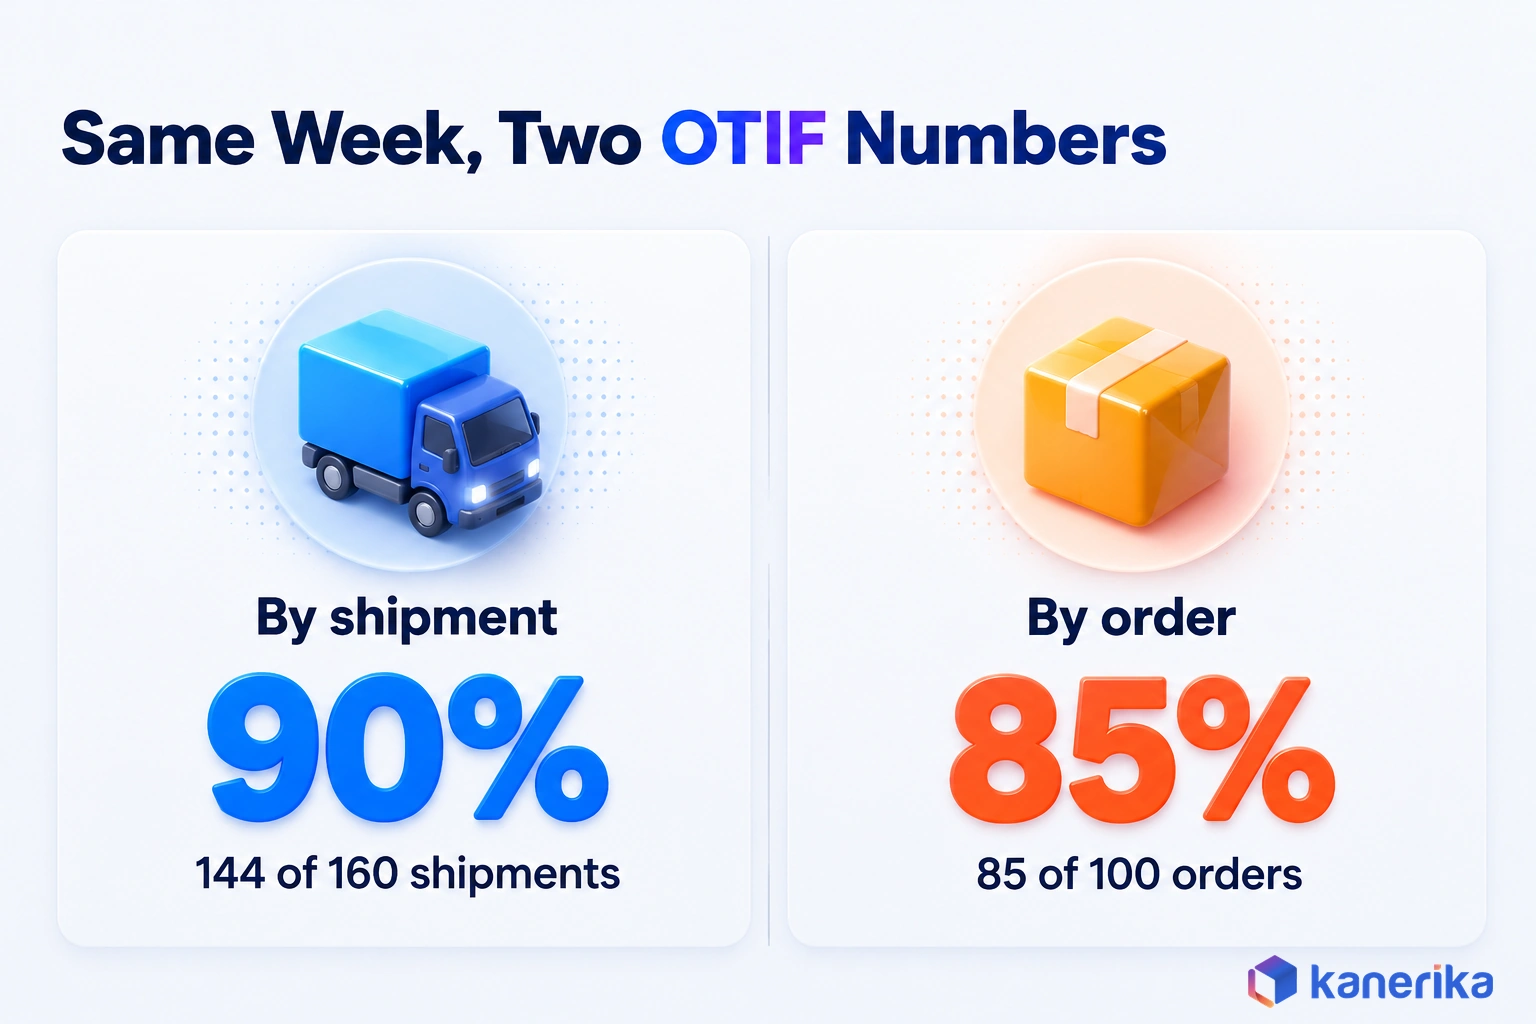
Neither number is wrong, but a customer scorecard and an internal dashboard built on different rules will never match. If customers judge you by order, report order-level OTIF to them and keep shipment-level OTIF for carrier reviews. Either way, write these five decisions into every KPI definition.
- Eligibility: which orders count, such as whether customer-requested reschedules are excluded.
- Timestamp: whether “on time” means the appointment time, gate arrival or proof of delivery.
- Level: shipment-level or order-level OTIF, and which one goes to customers.
- Owner: the one person who approves any change to the definition.
- Refresh: how often the number updates and when it becomes final for the period.
The Same OTIF Rules Written as a Query
Written as code, the same rules leave no room for interpretation. The illustrative T-SQL below computes both OTIF levels from one shipment table, so the 90% and 85% figures share a single source.
-- Illustrative schema: one row per shipment in fact_shipment
WITH shipment_flags AS (
    SELECT
        s.order_id,
        CASE
            WHEN s.pod_time <= s.window_end
             AND s.qty_delivered >= s.qty_ordered
            THEN 1 ELSE 0
        END AS is_otif
    FROM fact_shipment AS s
    WHERE s.ship_week_start = '2026-10-19'   -- one reporting week
      AND s.is_customer_reschedule = 0       -- eligibility rule
),
order_flags AS (
    SELECT order_id, MIN(is_otif) AS order_otif  -- one failed shipment fails the order
    FROM shipment_flags
    GROUP BY order_id
)
SELECT
    (SELECT AVG(CAST(is_otif AS DECIMAL(5,4))) FROM shipment_flags) AS otif_by_shipment,
    (SELECT AVG(CAST(order_otif AS DECIMAL(5,4))) FROM order_flags) AS otif_by_order;
Each rule maps to one line. The reschedule filter is the eligibility rule, the proof-of-delivery comparison is the timestamp rule, and the MIN over each order sets the level. A shipment with no proof of delivery yet fails the comparison, so it counts as not on time.
Publish the definitions next to the dashboard so anyone can check how a number was built. After that, disputes become questions about the rule instead of arguments about whose spreadsheet is right.
Building the Data Foundation for Logistics Analytics
The data foundation is the set of pipelines, models and rules that turn raw system records into numbers people trust. It decides whether analytics survives its first disputed meeting.
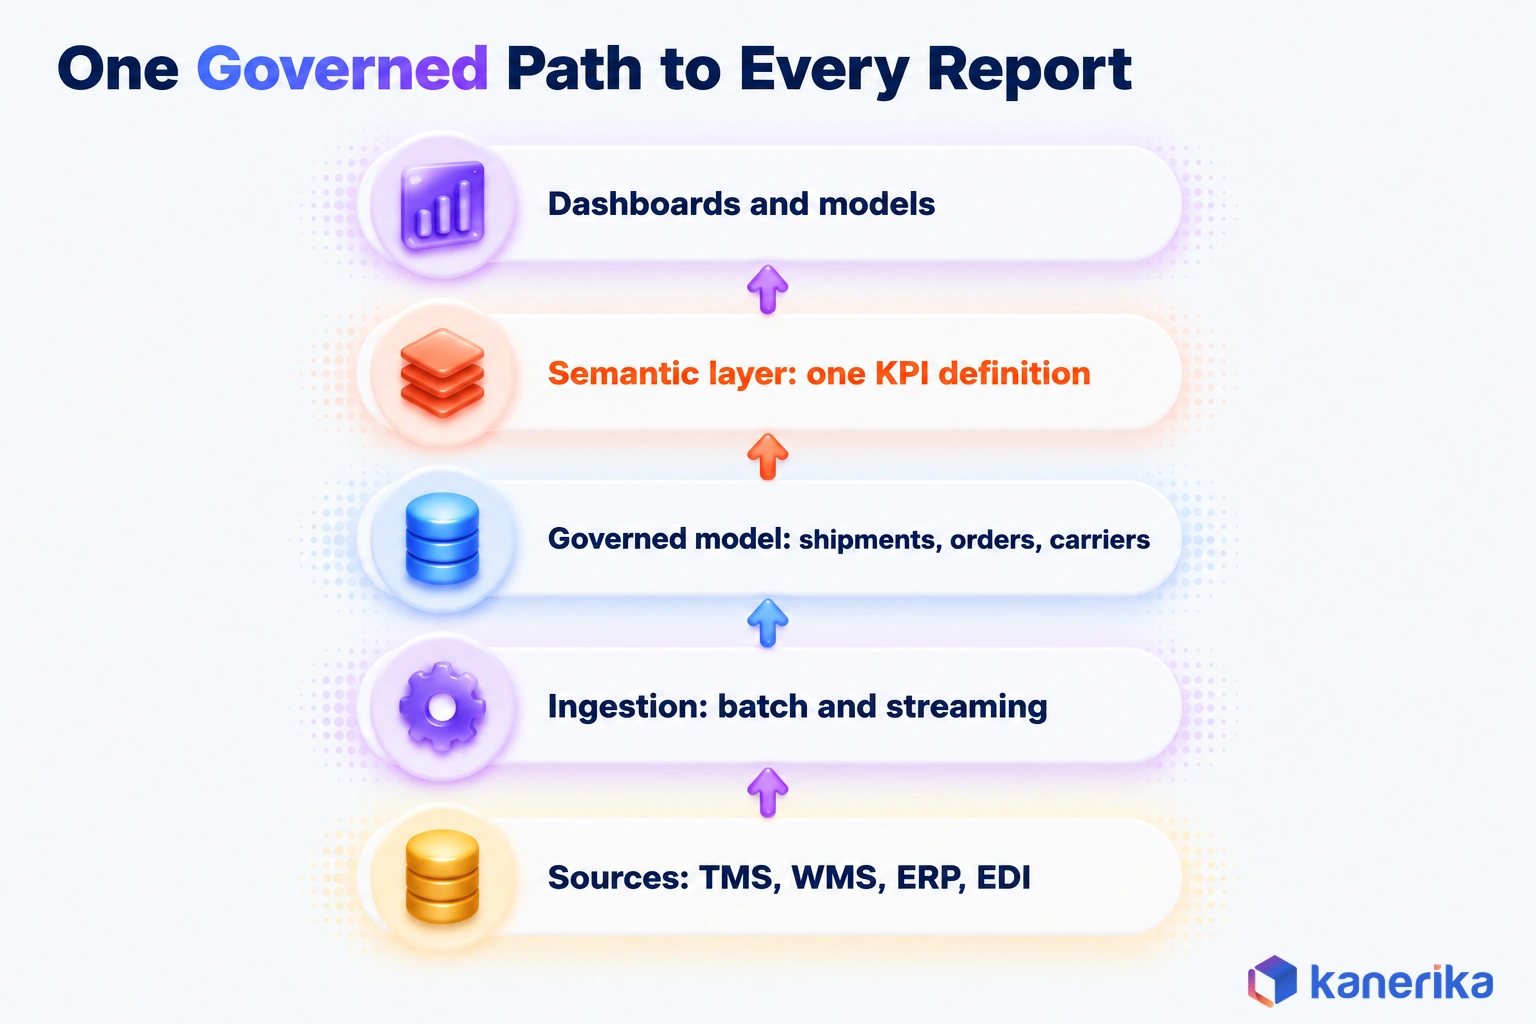
Source systems feed an ingestion layer that runs in batch for invoices but in near real time for tracking events. Ingested data then lands in a governed model, built around facts such as shipments and orders and dimensions such as carrier, location and SKU. Microsoft’s star schema guidance describes the same split, where fact tables store events and dimension tables describe business entities. Our guide to data warehouse architecture covers the layers around it.
A semantic layer sits on top and holds each KPI definition once, so every dashboard and model reads the same logic. In a Microsoft stack, that layer is a Power BI semantic model, which Microsoft describes as data ready for reporting and visualization. Dashboards and models sit on top, and because they read from the semantic layer rather than raw systems, they are the easiest part to replace. Older TMS and WMS platforms often need moving before any of this, and our guide to data migration in logistics covers that step.
Master Data for Carriers, Locations and SKUs
Many broken logistics reports trace back to master data rather than to models. One carrier can appear under three names and two SCAC codes, so its scorecard splits into pieces. A single DC may carry different location IDs in the TMS and WMS. A SKU may also be counted in cases in one system and in eaches in another.
Fixing this starts with ownership, the core idea of data governance, because software alone cannot settle which record is right. Assign an owner to each carrier, location and item record, then map every source code to one standard key. For carriers, that key is the SCAC, which the NMFTA issues and governs as the freight industry’s universal carrier identifier. Our guide to supply chain master data management also walks through the governance model in detail.
Batch vs Near Real-Time: What Needs Streaming
Streaming every feed is expensive, so it is rarely worth it. The test is whether someone acts on the number within the hour. If they do, stream it, but if they don’t, a scheduled batch is cheaper and easier to keep correct.
| Needs near real time | Batch is enough (hourly or daily) |
|---|---|
| Shipment status and ETA changes | Freight spend and invoice audit |
| Alerts for loads at risk of arriving late | Carrier scorecards |
| Dock door and yard status | Monthly KPI packs |
| Temperature alerts on refrigerated loads | Demand forecasts and inventory plans |
On Microsoft Fabric, Real-Time Intelligence covers the streaming side, reacting to events as they happen rather than on a schedule. Scheduled pipelines in Data Factory in Microsoft Fabric can carry the batch feeds. If only one or two feeds pass the one-hour test, keep everything else in batch and add streaming feed by feed.
Logistics Analytics Tools and Platforms
Tool choice matters less than the data model under it, but each category of tool has a clear job. The useful question, then, is which layer a tool fills in your stack.
TMS and WMS platforms ship with built-in reports that work well, especially inside their own data. They struggle once a question spans systems, such as linking a dock delay to a carrier invoice. That cross-system view therefore needs a separate analytics layer, usually a BI tool on a shared data platform. Our guide to Microsoft Fabric explains how one such platform combines storage, pipelines and Power BI.
| Category | Good for | Limit |
|---|---|---|
| TMS and WMS embedded analytics | Fast operational views inside one system | Cannot join data across systems |
| BI layer, such as Power BI | Shared dashboards, self-service and a semantic model | Needs a governed model underneath |
| Lakehouse platforms, such as Microsoft Fabric, Databricks and Snowflake | Storing and modeling large, mixed data | Needs data engineering skills to run well |
| ML tooling | Training and monitoring predictive models | Only as good as the history it learns from |
A simple rule helps with the platform choice. If the team already runs Power BI and other Microsoft tools, Fabric usually shortens the path. If data engineering already lives in Databricks or Snowflake, put Power BI on that platform rather than move the data.
For a vendor-by-vendor comparison, see our roundup of supply chain analytics tools. If you want software to carry out tasks, such as keying freight documents, our guide to automation in logistics is the better fit.
On-Demand Webinar
Optimizing Supply Chain with AI and Analytics
A recorded Kanerika session on applying AI and analytics to supply chain planning and operations, from data foundations to day-to-day decisions.
Watch the Webinar →How to Implement Business Analytics in Logistics: Visibility, Prediction, Prescription
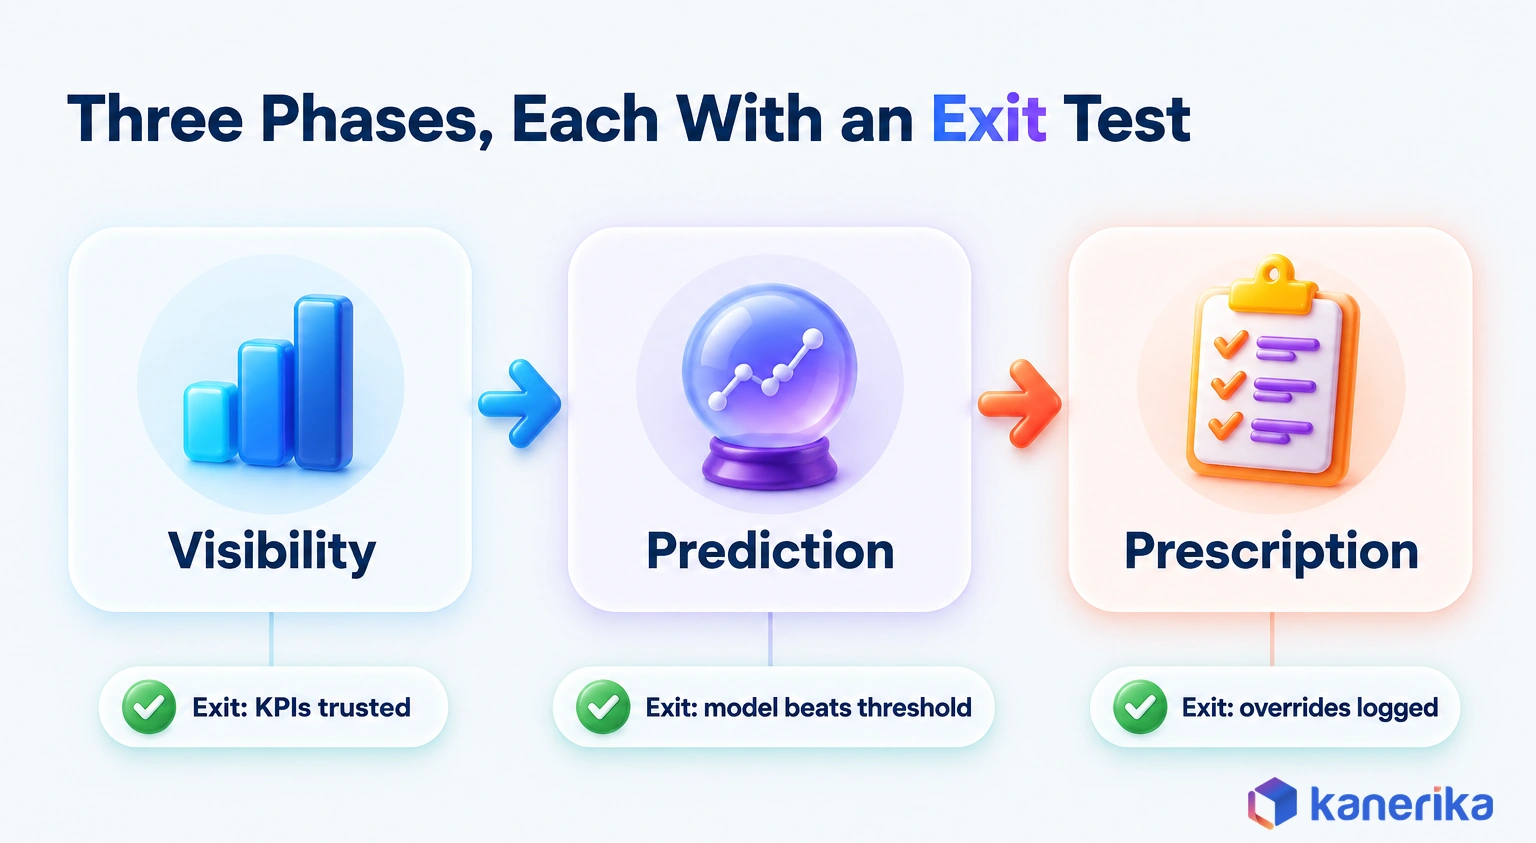
A staged rollout keeps each investment tied to a result you can check. Each phase below has a deliverable, a data scope, a KPI and an exit test that must pass before the next phase starts.
- Phase 1, Visibility. Build one governed KPI set, such as on-time delivery and OTIF by lane, from TMS, WMS and EDI 214 feeds. Dashboards then serve transport and warehouse teams. Move on only when operations and finance accept the numbers for a full reporting cycle.
- Phase 2, Prediction. Add one predictive model, such as late-load risk, trained on Phase 1 history and live tracking. Measure the share of late loads flagged before departure, and retrain on a set schedule. Move on once the model beats an accuracy threshold the team agreed in advance.
- Phase 3, Prescription. Put recommendations, such as carrier swaps or wave changes, inside the dispatcher’s own tools. After launch, track the share of recommendations accepted. The phase is stable when every override is logged with a reason and reviewed each month.
A frequent failure is skipping Phase 1. A late-load model trained on inconsistent timestamps flags the wrong loads, so dispatchers stop trusting it within weeks.
Phase 2 is also where outside help often pays off. Teams without in-house data scientists can bring in predictive analytics services for the model build and still keep ownership of the model afterward.
Challenges of Business Analytics in Logistics and How to Handle Them
The hardest problems in logistics analytics tend to involve data ownership and trust rather than technology. Each one below also has a known failure pattern and a control that keeps it in check.
| Challenge | What goes wrong | Control |
|---|---|---|
| Data quality across carriers | Missing or late 214 events and inconsistent status codes | Carrier data terms and a status-code mapping table |
| Model drift | Accuracy falls when the network or carrier mix changes | Scheduled accuracy checks, then retraining when accuracy drops |
| Dispatcher trust | Recommendations get ignored when no reason is shown | Show the reason behind each score, then log overrides |
| Carrier data-sharing terms | Contracts do not allow reuse of tracking data | Add data clauses at the next carrier bid |
| Access to driver and customer data | Personal data is visible to too many users | Role-based access and masked fields |
These controls all depend on noticing problems early. Missing 214 events or a sudden drop in tracking volume should raise an alert before a dashboard shows a wrong number. Our guide to data observability explains how to monitor pipelines that way.
Some teams also want task automation next to analytics, such as document capture for bills of lading. Our guide to intelligent automation in supply chain covers where RPA and document processing fit.
US Regulatory and Reporting References
Analytics on driver and emissions data has to respect the rules that govern those records. Three references matter most for US operations, since each one shapes how long you keep data or how you calculate it.
| Area | Reference | Analytics implication |
|---|---|---|
| Driver hours records | 49 CFR 395.8 requires motor carriers to keep records of duty status and supporting documents for at least six months | Keep ELD data long enough for audits and trend analysis |
| Freight emissions benchmarking | EPA SmartWay, a voluntary public-private program launched in 2004 | Carrier emissions data can feed scorecards and lane choices |
| Transport emissions accounting | ISO 14083, a common method to quantify and report transport-chain greenhouse gas emissions | Use one method so emissions figures compare across carriers |
Each of these rules needs a home in the data model rather than on a special platform. Retention periods, access rights and emissions methods belong there, rather than being patched into reports later.
Checklist
Data Analytics Checklist
Check your data sources, quality, governance and KPI definitions before you fund logistics dashboards or predictive models.
Get the Checklist →How to Measure the ROI of Logistics Analytics
ROI for logistics analytics is the value of better decisions minus the full cost of producing them. The hard part, then, is counting both sides honestly.
Costs include integration work and data quality cleanup, as well as software licenses and the time teams need to adopt new tools. Benefits, on the other hand, come from fewer late loads, recovered freight overcharges, better labor plans and lower inventory. Record the baseline before the project starts, because a saving with no baseline will not survive a budget review.
The formula itself is short, since ROI equals annual benefit minus annual cost, divided by annual cost. Payback in months then equals first-year cost divided by monthly benefit.
A Worked Example With Illustrative Numbers
The figures below are illustrative, not client results. They model a shipper with six DCs that wants to cut late deliveries, so every input is an assumption.
| Input | Illustrative value |
|---|---|
| Loads shipped per month across six DCs | 3,000 |
| Late-load rate before the program | 8%, or 240 late loads |
| Late-load rate after Phase 2 | 6%, or 180 late loads |
| Cost per late load (chargebacks, expedites and service time) | $350 |
| Annual saving | 60 loads × $350 × 12 months = $252,000 |
| First-year program cost | $180,000 |
On these assumptions, the monthly saving is $21,000, so payback takes about 8.6 months. First-year ROI is ($252,000 − $180,000) ÷ $180,000, or 40%. If the late-load rate fell only to 7%, however, the monthly saving would be $10,500 and payback would stretch to about 17 months. Run the same check on your own baseline before you present the case.
How Kanerika Delivers Logistics Analytics
Kanerika starts every logistics analytics engagement with one business decision. We pick the decision that costs the most when it goes wrong and agree on the KPI set behind it. Then we audit the source systems that feed it.
After that, our data analytics services team builds one governed data flow on Microsoft Fabric with Power BI on top. Prediction comes next, once the numbers hold up in weekly reviews. Kanerika is also a Microsoft Solutions Partner for Data and AI with the Analytics Specialization.
Case Study: 80% Faster Reporting for a US 3PL
A privately owned US third-party logistics provider manages more than 13 million square feet of warehouse space, with a focus on food and beverage. It needed to standardize reporting and analytics across its operations.
Kanerika then built a Microsoft Fabric data foundation with Power BI dashboards on top. As a result, report generation time fell by 80%, data processing speed rose by 75%, and effective decisions increased by 62%.
With near/on/off-shore capabilities, our team of over 300 professionals drives innovation and delivers impactful results. Our expertise spans industry sectors such as logistics, retail, BFSI, manufacturing, and more, ensuring that our clients stay ahead in a data-driven world. For additional insights into digital transformation in the travel and transportation sector, you can check this resource.
Case Study
80% Faster Reporting for Logistics with Microsoft Fabric
A US 3PL managing more than 13 million square feet of warehouse space cut report generation time by 80% with Power BI dashboards on Microsoft Fabric.
Read the Case Study →What Works in Business Analytics in Logistics in 2026
What works in business analytics in logistics in 2026 is a narrow start and a strict order. Begin with one KPI set that operations and finance both trust, since every later step depends on it. Fund freight audit and carrier scorecards first, then ETA exception management, because their data already exists. Add prediction only after the data model holds through a full reporting cycle, and leave autonomous agents for later. To put what works into practice, pick the one logistics decision that cost you the most last quarter and define its KPI this week.
Frequently Asked Questions
What is business analytics in logistics and how does it work?
Business analytics in logistics combines shipment, warehouse, carrier and cost data into one trusted model. Teams use it to explain performance, predict problems and choose actions. Data flows from the TMS, WMS, ERP and carrier feeds into a governed model. Dashboards and predictive models then read from that model, so every team works from the same numbers.
What are the four types of logistics analytics?
The four types are descriptive, diagnostic, predictive and prescriptive analytics. Descriptive shows what happened, such as on-time delivery by lane. Diagnostic explains why it happened. Predictive estimates what will happen next, such as which loads may arrive late. Prescriptive recommends an action, like a carrier swap. Most teams should adopt them in that order.
Is data science used in logistics?
Yes. Data scientists build the predictive models behind late-arrival risk scores, demand forecasts, labor plans and route optimization. Their work depends on clean, consistent history, so it usually follows the descriptive and diagnostic stages. A model also needs monitoring and a retraining schedule, because carrier networks and customer patterns change over time.
Which KPIs should logistics teams track first?
A practical first set is on-time delivery, OTIF, freight cost per shipment, pick accuracy and dock-to-stock time. Together they cover service, cost and warehouse performance. Add load utilization, order cycle time, claims rate and forecast error once the first set is trusted. Every KPI needs a written definition, an owner and a refresh schedule.
What software is used for logistics analytics?
Most logistics analytics stacks combine four layers. TMS and WMS platforms provide built-in operational reports. A BI tool such as Power BI handles shared dashboards. A lakehouse platform such as Microsoft Fabric, Databricks or Snowflake stores and models the data. ML tooling then trains and monitors predictive models on top of that governed data.
How is business analytics different from supply chain analytics?
Supply chain analytics covers the whole network, from sourcing and production planning to inventory and delivery. Business analytics in logistics is narrower and focuses on transportation, warehousing, freight spend and delivery performance. It goes past dashboards into diagnosis and prediction for the teams that move and store goods, such as dispatchers and DC managers.
How is AI changing logistics analytics in 2026?
AI is moving logistics analytics from reports toward predictions and recommendations. Models now score open loads for late-arrival risk, suggest carrier swaps and forecast labor needs. People still approve most actions, and overrides should be logged. AI agents that act on their own are a later step, and they depend on the same trusted data model.
What data do you need to start logistics analytics?
Start with shipment and order records from the TMS and ERP, plus warehouse task data from the WMS. Then add carrier status events such as EDI 214 messages. Add freight invoices and contract rates for spend analysis. Clean master data for carriers, locations and SKUs matters as much as volume, because mismatched codes break every report.
What is master data in logistics?
Master data is the shared reference data that every logistics transaction points to. It covers carriers and their SCAC codes, locations such as DCs and customer docks, and items with their units of measure. When one carrier appears under several names, scorecards split apart. Each record needs an owner and one standard key across systems.
What are the steps to implement analytics in a logistics operation?
Start by choosing one costly decision and the KPIs behind it. Audit the source systems, then build one governed data model and a dashboard set that teams accept. Next, add one predictive model, such as late-load risk, with an agreed accuracy threshold. Only then add prescriptive recommendations, and log every dispatcher override with a reason.
What ROI can logistics analytics deliver, and how long does it take?
ROI depends on your baseline, so measure it before the project starts. Benefits usually come from fewer late loads, recovered freight overcharges and better labor plans. In an illustrative six-DC example, cutting the late-load rate from 8% to 6% pays back a $180,000 program in about nine months. Smaller gains stretch payback considerably.
What are the biggest challenges in implementing logistics analytics?
The biggest challenges are inconsistent carrier data, conflicting master data and low trust from dispatchers. Models also drift after network or carrier changes. Contracts may limit how tracking data can be reused, and driver or customer data needs access controls. Each problem has a fix, such as data terms, mapping tables, retraining checks and role-based access.
How is data analytics used in supply chain management?
Supply chain teams use data analytics to forecast demand, set inventory levels, assess supplier risk and plan transport. It links sourcing, production and delivery data so planners can see how a change in one area affects the others. Logistics analytics is the part focused on moving and storing goods, from carrier choice to warehouse labor.
What is big data analytics in logistics?
Big data analytics in logistics handles very large or fast data, such as telematics pings, IoT sensor readings and tracking events from many carriers. It needs a scalable platform, such as a lakehouse, rather than a single reporting database. Most of the value still comes from joining that data to shipments, orders and costs for decisions.
How is data analytics used in transportation?
Transportation teams use analytics to score carriers, audit freight invoices, predict late arrivals and plan routes. Data comes from the TMS, EDI 214 status messages, ELD and telematics devices, and carrier APIs. Lane-level views show where a carrier performs well or poorly, which gives procurement evidence for the next bid instead of relying on anecdotes.
What role does ETL play in logistics analytics?
ETL, or extract, transform and load, moves data from the TMS, WMS, ERP and EDI feeds into the analytics model. The transform step does most of the hard work. It maps carrier codes, aligns units of measure, fixes timestamps and applies KPI rules. Every report and model then starts from the same clean, consistent data.