We are living in a data-driven world in the true sense of the term. Research says that by the year 2025, the amount of data created worldwide would touch 181 zettabytes—for context, it takes a trillion gigabytes to make 1 zettabyte. Moreover, as a business entity willing to thrive in the digital age, harnessing the power of data is a must. But with so much data available all around, it’s inevitable to make mistakes and fall into the trap of bad data. This is where data transformation comes into the picture. It makes the available data suitable for visualization and analysis, so you can avoid errors and derive accurate insights.
In this article, we’ll take a deep dive into data transformation—how it works, what are the different types and techniques, why it’s beneficial for businesses, and more. So, let’s get started.
What is Data Transformation?
Data transformation is the backstage magician that ensures the show runs smoothly, making data more accessible and actionable for businesses, researchers, and analysts alike.
To put it theoretically, it is the process of converting data from one format, structure, or representation into another, with the aim of making it more suitable for analysis, storage, or presentation. This can involve various operations, such as cleaning, filtering, aggregating, or reshaping data.
Read More: 10 Best Data Transformation Tools
Data transformation is a crucial step in data preparation for tasks like data analysis, machine learning, and reporting, as it helps ensure that data is accurate, relevant, and in a format that can yield valuable insights or be readily utilized by applications and systems.
Transform Your Raw Data into Actionable Insights – Start Now!
Partner with Kanerika for Advanced Data Transformation Services
How is Data Transformation Used?
Data transformation comes in handy when it’s time to convert your existing data to match the data format of the destination system. It takes place in two places—for on-site storage setups, it’s part of the extract, transform, load (ETL) process during the ‘transform’ step. And in cloud-based environments, where scalability is high, ETL can be skipped in favor of a process known as extract, load, and transform (ELT), transforming data as it’s uploaded. This second method of data transformation can be manual, automated, or a blend of both.
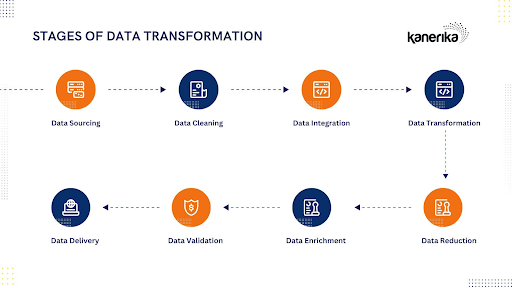
The data transformation process looks something like this:
1. Discovery
Data transformation begins with the discovery phase. During this stage, data analysts and engineers identify the need for transformation. This can result from data coming in from different sources, being in incompatible formats, or needing to be prepared for specific analysis or reporting.
2. Mapping
Once the need for transformation is identified, the next step is to create a mapping plan. This involves specifying how data elements from the source should be mapped or transformed into the target format. Moreover, mapping may include renaming columns, merging data, splitting data, or aggregating values.
3. Code Generation
After mapping is defined, data transformation code needs to be generated. Depending on the complexity of the transformation, this can involve writing SQL queries, Python or R scripts, or using specialized ETL (Extract, Transform, Load) tools. This code is responsible for executing the defined transformations.
4. Execution
With the transformation code in place, the data transformation process is executed. Source data is ingested, and the transformations are applied according to the mapping plan. This step may occur in real-time or as part of batch processing, depending on the use case.
5. Review
The transformed data should be thoroughly reviewed to ensure that it meets the intended objectives and quality standards. This includes checking for accuracy, completeness, and data integrity. Data quality issues need to be identified and addressed during this phase.
10 Must-Have Data Transformation Tools in 2025
Unlock the power of your data—explore the top 10 data transformation tools for 2025!
Data Transformation Techniques
Let’s have a look at some key data transformation techniques that your business needs on a day-to-day basis:
1. Data Smoothing
Data smoothing involves reducing noise or fluctuations in data by applying techniques like moving averages or median filtering. Moreover, it helps in making data more manageable and understandable by removing small-scale variations.
Use cases: Often used in time series data to identify trends and patterns by removing short-term noise.
2. Attribution Construction
Attribution construction involves creating new attributes or features from existing data. However, this technique can involve mathematical operations, combining different attributes, or extracting relevant information.
Use cases: Commonly used in feature engineering for machine learning, creating composite features that can enhance predictive models.
3. Data Generalization
Data generalization involves reducing the level of detail in data while retaining important information. This is often used to protect sensitive information or to simplify complex data.
Use cases: In data anonymization, generalization is used to hide specific identities while preserving the overall structure of the data.
4. Data Aggregation
Data aggregation combines multiple data points into a single summary value. This summary can be the result of mathematical operations like sum, average, count, or more complex aggregations.
Use cases: Commonly used in data analysis and reporting to simplify large datasets and extract meaningful insights.
5. Data Discretization
Data discretization involves converting continuous data into discrete categories or bins. This can be useful when working with continuous variables in classification or clustering.
Use cases: Used in machine learning to transform numerical data into categorical features, making it easier to analyze and model.
6. Data Normalization
Data normalization standardizes data by scaling it to a common range, typically between 0 and 1 or with a mean of 0 and a standard deviation of 1. It helps in comparing variables with different scales.
Use cases: Widely used in machine learning algorithms like gradient descent to improve convergence and performance.
Each of these data transformation techniques serves a specific purpose in data analysis, preprocessing, and modeling, and their selection depends on the nature of the data and the goals of the analysis or machine learning task.
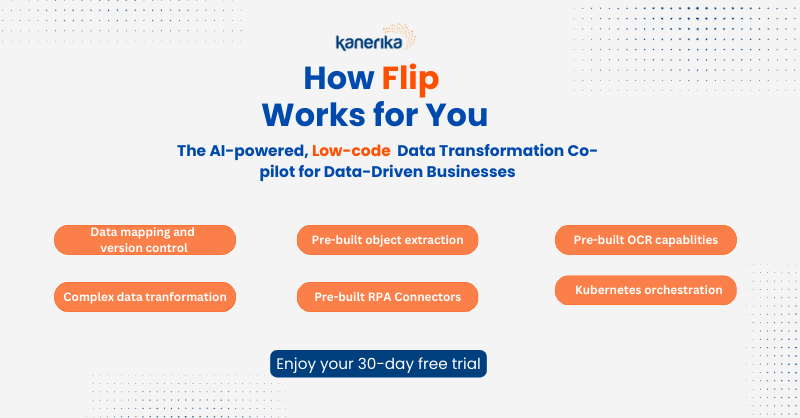
Want to empower your business with operational intelligence? Get started with FLIP, an analytics-focused DataOps automation solution by Kanerika, and stay on top of data transformation and management.
Unlock the Power of Clean Data – Begin Your Transformation Journey!
Partner with Kanerika for Advanced Data Transformation Services
Benefits of Data Transformation
Transformation of data offers a plethora of benefits in the context of data analysis, machine learning, and decision-making:
1. Improved Data Quality
Data transformation helps in cleaning and preprocessing data, removing errors, duplicates, and inconsistencies, leading to higher data accuracy and reliability.
2. Enhanced Compatibility
It makes data from different sources or formats compatible, facilitating integration and analysis across diverse datasets.
3. Reduced Dimensionality
Techniques like PCA or feature selection can reduce the dimensionality of data, simplifying analysis and potentially improving model performance.
Read More: Generative AI Consulting: Driving Business Growth With AI
4. Normalized Data
Standardization and normalization make data scales consistent, preventing certain features from dominating others, which can be crucial for algorithms like gradient descent.
5. Effective Visualization
Transformed data is often more suitable for creating informative and visually appealing charts, graphs, and dashboards.
6. Increased Model Performance
Preprocessing, including feature scaling and engineering, can enhance the performance of machine learning models, leading to more accurate predictions.
Read More – 6 Core Data Mesh Principle for Seamless Integration
7. Reduced Overfitting:
Dimensionality reduction and outlier handling can help prevent overfitting by simplifying models and making them more generalizable.
8. Better Interpretability
Transformation can make complex data more interpretable and understandable, aiding in decision-making and insights generation.
9. Handling Missing Data
Imputation techniques fill in missing values, ensuring that valuable data is not lost during analysis.
Read More – Business Transformation Strategies For Enterprises in 2025
10. Enhanced Time-Series Analysis
Time-series decomposition and smoothing techniques make it easier to identify trends, patterns, and seasonality in data.
11. Improved Text Analysis
Text preprocessing techniques, such as tokenization and stemming, prepare text data for natural language processing (NLP) tasks.
12. Data Reduction
Aggregation and summarization can reduce data size while retaining essential information, making it more manageable for storage and analysis.
Read More: 10 Ways AI & RPA Are Shaping The Future of Automation
13. Outlier Detection
Data transformation helps in identifying and handling outliers that could skew analysis and modeling results.
14. Facilitates Decision-Making
High-quality, transformed data provides more reliable insights, supporting data-driven decision-making in various fields, from business to healthcare.
15. Enhanced Data Privacy
Data anonymization techniques can be part of data transformation, protecting sensitive information while retaining data utility.
Kanerika Boosts NorthGate’s Business Performance with Data Analytics Transformation
Unlock powerful insights—discover how Kanerika transformed NorthGate’s performance through data analytics!
Challenges of Data Transformation
Just like any other technical process, transformation also comes with a fair share of challenges.
1. High Expense
Data transformation can be expensive, both in terms of hardware and software resources. Depending on the volume of data and complexity of transformations required, organizations may need to invest in powerful servers, storage, and specialized software tools.
2. Resource-Intensive
Data transformation processes often demand significant computing power and memory. Large datasets or complex transformations can strain the available resources, potentially leading to slow processing times or even system failures.
3. Lack of Expertise
Effective transformation requires a deep understanding of both the data itself and the data automation tools used for transformation. Many organizations lack experts who are proficient in these areas, leading to suboptimal transformations or errors in the data.
4. Scalability
As data volumes grow, the scalability of data transformation processes becomes a concern. Solutions that work well with small datasets may not perform adequately when processing terabytes or petabytes of data.
But the good news is, that with a powerful data transformation tool like FLIP by your side, you can overcome these shortcomings swiftly.
Streamline Your Data Processes – Get Started Free
Partner with Kanerika for Advanced Data Transformation Services!
Types of Data Transformation
There are various transformation techniques that are essential for businesses to manage and make sense of the vast amounts of data they collect from diverse sources. Let’s take a look at the most vital ones:
1. Transformation through Scripting
This involves using scripting languages like Python or SQL to extract and manipulate data. Scripting allows for the automation of various processes, making it efficient for data analysis and modification. It requires less code compared to traditional programming languages, making it accessible and versatile for data tasks.
2. On-Premises ETL Tools
On-premises ETL (Extract, Transform, Load) tools are deployed internally, giving organizations full control over data processing and security. These tools can handle numerous data processing tasks simultaneously. They are preferred by industries with strict data privacy requirements, such as banking and government, but may require third-party connectors for mobile device integration.
Read More: How to build a scalable Data pipeline
3. Cloud-Based ETL Tools
Cloud-based ETL tools operate in the cloud, offering scalability and accessibility. However, data ownership and security can be ambiguous since data encryption and keys are often managed by third-party providers. Many cloud-based ETL systems are designed for mobile access, but this can raise security concerns, especially for sensitive data.
4. Constructive and Destructive Transformation
Constructive transformation involves enhancing data by adding, copying, or standardizing it. Destructive transformation, on the other hand, cleans and simplifies data by removing fields or records. These transformations can be complex and error-prone, as they aim to make data more useful while balancing complexity.
5. Structural Data Transformation
Structural transformation involves, which may include combining, splitting, rearranging, or creating new data structures. This transformation can modify a dataset’s geometry, topology, and characteristics. It can be simple or complex, depending on the desired changes in the data’s structure.
6. Aesthetic Data Transformation
Aesthetic transformation focuses on stylistic changes, such as standardizing values like street names. It may also involve modifying data to meet specific specifications or parameters. Aesthetic data transformation helps organizations improve data quality and consistency for better operational and analytical insights.
Benefits of Data Analytics in Healthcare Transformation
Unlock the future of healthcare with data-driven insights—explore the transformative benefits of data analytics today!
Best Practices for Transforming Data Effectively
Data transformation is a complex and challenging process that requires careful planning, execution, and monitoring.
You should follow some best practices, such as:
- Define clear objectives and goals, to ensure the success and quality of data transformation efforts,
- Identify the key stakeholders, users, and beneficiaries of the process and involve them in planning.
- Evaluate the source data and assess the data quality.
- Maintain standard data formats to ensure that data is in a consistent and compatible format across different sources.
- Use common standards and conventions for data naming, structuring, encoding, and representation.
- Protect data from unauthorized access, modification, or loss during the transformation process.
- Focus on compliance with regulations or policies regarding data privacy and security.
- Review the transformed data and validate its authenticity.
- Finally, establish a set of rules and guidelines for managing data throughout its lifecycle stages.
Maximize Data Value Through Transformation – Learn How
Partner with Kanerika for Advanced Data Transformation Services
Why Do Businesses Need Data Transformation?
By engaging in transformation, you can uncover trends, identify customer preferences, and optimize your operations. It also enables you as a decision-maker to make more accurate forecasts, enhance customer experiences, and support your strategic planning.
Data transformation also empowers you to adapt to changing market conditions, make data-backed decisions, and drive innovation, ensuring the long-term success of your business in an increasingly digital landscape.
Kanerika’s robust solutions, empower businesses to democratize and harness the full potential of their data pipelines faster and at a lower cost.
Next Steps: Learn about…
- Kanerika’s Products
- Kanerika’s Data Tranformation Case Studies
- Schedule a Free Data Strategy Assessment
FAQs
What is difference between data translation and transformation?
Data translation is like changing the language of your data – converting formats or units without altering its meaning (e.g., Celsius to Fahrenheit). Transformation, however, changes the data’s structure or values to create new, meaningful information (e.g., calculating averages from raw scores). Essentially, translation is about representation, while transformation is about derivation. One preserves meaning, the other creates it.
What is the meaning of data manipulation?
Data manipulation is the process of altering or transforming raw data to make it more useful or insightful. This involves cleaning, organizing, and potentially restructuring data, often to prepare it for analysis or visualization. Think of it as refining raw materials into something more valuable and understandable. It’s a crucial step in getting meaningful information from data.
What is data transformation in Excel?
Data transformation in Excel means changing your data’s format or structure to make it more useful. Think of it as cleaning and prepping your data for analysis or presentation. This could involve anything from changing dates to numbers, standardizing text, or removing duplicates. Essentially, it’s making your raw data more refined and insightful.

