

TL;DR
To fix bad data quality, prevent defects at the source and save one-off cleanup for the backlog already in your systems. Start with the few data elements that drive revenue, compliance or AI, and put a dollar cost on their defects. Then profile them for a baseline and trace each defect to the process that creates it. Remediate with cleansing, matching and master data, then stop recurrence with entry validation, data contracts, pipeline tests and monitoring. The stakes are real: Forrester research cited by IBM finds over a quarter of organizations lose more than USD 5 million a year. A team that only cleans downstream pays that bill again every quarter, while a team that fixes the source pays it down for good.
Key Takeaways
- Bad data quality means data that is not fit for the decision or process that uses it, rather than just data with typos.
- The first warning signs are business symptoms, so look for reports that disagree, manual reconciliations, failed loads and stale AI answers.
- You can also price the problem with one formula: defective records times minutes to fix, divided by 60, times a loaded hourly rate.
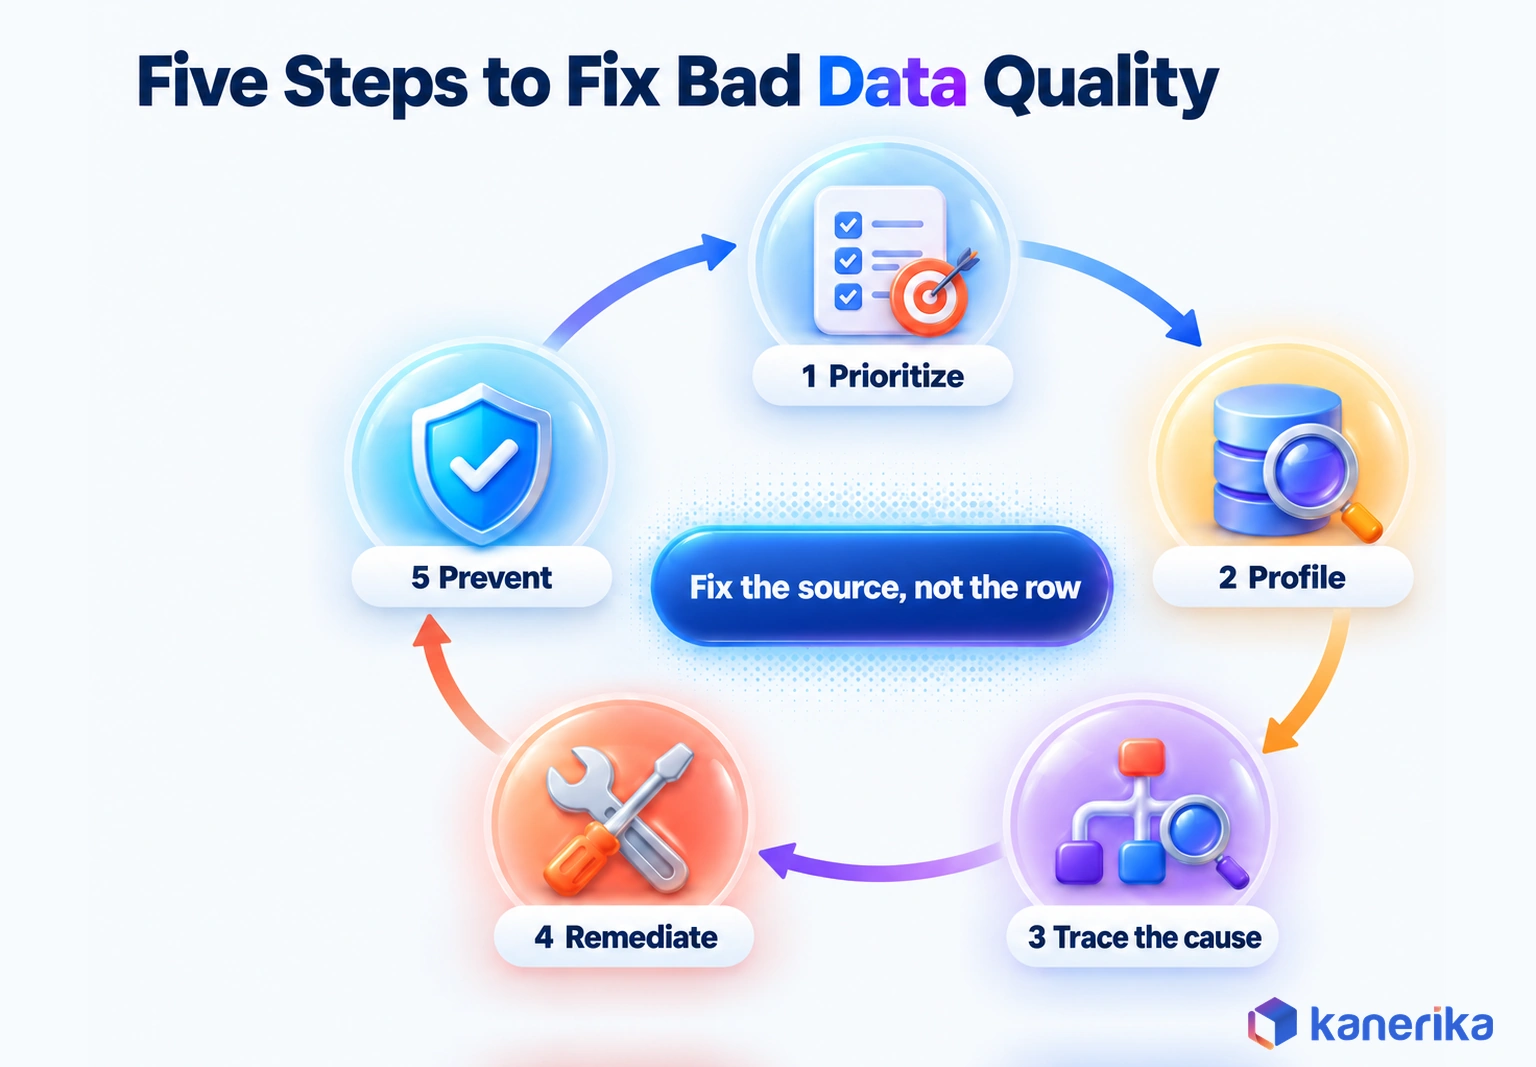
- The fix runs in five steps: prioritize critical data, profile it, trace root causes, remediate, then prevent recurrence.
- Prevention at the point of entry and in the pipeline saves more than repeated cleanup, because each cleanup only treats the symptom.
- Every critical data element needs a named owner and steward, or the same defects return within months.
The Report That Counted the Same Customer Three Times
Picture a Monday revenue review at a mid-sized distributor. Marketing shows 48,000 active customers. Finance shows 41,000. Nobody in the room can say which number is right.
The cause turns out to be one buyer stored three ways. The CRM knows her as “J. Smith”, billing has “John Smith”, and the support desk logged “Jon Smith” with a different email. So marketing mails her three catalogs, and the dashboard spreads her spending across three accounts. Revenue per customer looks lower than it is, and the growth plan built on that figure aims at the wrong target.
Nothing in that story is a dramatic failure. No system crashed, and no alert fired, so nobody looked. That silence is exactly why bad data is so expensive: the damage hides inside normal reports until someone acts on them.
This guide covers what bad data looks like, how to spot it and how to put a dollar figure on it. It then walks through a five-step fix, shows which method fits which problem, and explains who should own the result.
What Is Bad Data Quality?
Bad data quality is data that is not fit for the decision or process that depends on it. A customer address can be perfectly valid for a marketing list and still be wrong for a tax filing. Quality is always judged against a use, which is why two teams can disagree about the same table.
Standards bodies describe that fitness through dimensions. The UK Government Data Quality Framework lists the six core dimensions from DAMA UK: accuracy, completeness, consistency, timeliness, uniqueness and validity. It also notes that this is not a prescriptive list, so teams can add dimensions that matter to them. The ISO/IEC 25012 data quality model goes further, with 15 characteristics split between inherent qualities and system-dependent ones.
You do not need to memorize either list, though. What matters is that each dimension turns a vague complaint into something you can measure. For example, “the customer data is bad” becomes “12% of customer records have no email.” Those numbers can be owned, tracked and fixed.
Kanerika Service
Data Governance and Data Quality Services
Kanerika sets measurable quality rules, assigns owners and automates controls for the data that drives your revenue, reporting and AI.
Explore Data Governance ServicesSeven Types of Bad Data
Defects tend to fall into seven recognizable types. The table below shows how each one appears in daily work, and also where it usually starts. If you want the boundary between this topic and data integrity, our guide to data integrity vs data quality draws that line in detail.
| Type | What it looks like | Typical cause |
|---|---|---|
| Inaccurate | A price, address or balance that does not match reality | Typing errors, wrong source system, bad conversion logic |
| Incomplete | Blank email, missing tax ID, null product category | Optional form fields, partial loads, skipped steps |
| Inconsistent | “CA” in one system and “California” in another | No shared standards across teams or applications |
| Duplicate | The same customer or supplier stored two or more times | Separate systems creating records with no matching rules |
| Outdated | A contact who left the company two years ago | Data decay with no refresh or expiry process |
| Invalid | An order dated in the future or a negative quantity | Missing validation at entry or in the pipeline |
| Biased | Training data that underrepresents a region or customer group | Narrow collection methods or skewed historical records |
Warning Signs Your Data Has a Quality Problem
Bad data rarely announces itself in a data team’s tools first. Instead, it shows up as friction in the business, where people work around numbers they no longer trust. So if several of the signs below sound familiar, the problem is already costing you time.
- Two reports answer the same question with different numbers, and meetings start with an argument about which is right.
- Analysts keep spreadsheets that reconcile one system against another before every month-end close.
- Campaign emails bounce, while invoices or parcels go to old addresses.
- Nightly loads fail because a field arrived in a new format or a column was renamed upstream.
- An AI assistant or chatbot cites a policy, price or contact that changed months ago.
- Customers call more than once to correct the same details, because the first fix never stuck.
Symptoms tell you where to look, while a few quick checks tell you how big the problem is. Run these on one critical table before you plan any fix, because the numbers will set your priorities.
- Measure the null rate on fields the business needs, such as email or tax ID.
- Count rows that share a key that should be unique.
- Count values outside a valid range, for example negative quantities or future dates.
- Compare a total, such as open orders, between two systems that should agree.
None of these checks needs a new tool, so you can start right away. A few SQL queries or a profiling run will show whether you have a minor cleanup or a structural problem.
Talk to Kanerika
Minor Cleanup or Structural Problem?
Kanerika profiles your critical data elements, prices their defects and shows which fixes return the most, so you know where to start.
Book a Data Quality Assessment →What Bad Data Quality Costs, and How to Calculate Yours
Cost is the argument that gets a data quality program funded. Without a number, the work competes with every other request, so it usually loses. With a number, however, it becomes a business case that a finance leader can check.
What the Research Says
The clearest published figures come from an IBM analysis. In a January 2026 analysis of poor data quality, IBM cites its Institute for Business Value 2025 research. That study found 43% of chief operations officers name data quality issues as their most significant data priority.
The same analysis cites Forrester research on losses: over a quarter of organizations estimate they lose more than USD 5 million a year to poor data quality. At the top end, 7% report losses of USD 25 million or more.
Those losses rarely appear as one line item, because they spread across rework hours, missed sales, write-offs, delayed decisions and audit findings. That spread is why a team needs its own estimate rather than an industry average.
A Worked Cost Example
The simplest useful formula counts the labor spent fixing defects by hand. It ignores lost revenue and fines, so it gives a floor, not a ceiling.
- First, count defective records per month, which is records processed times the defect rate.
- Then multiply by the average minutes a person spends finding and fixing each one.
- After that, divide by 60 to get hours.
- Finally, multiply by the loaded hourly rate of the people doing the fixing.
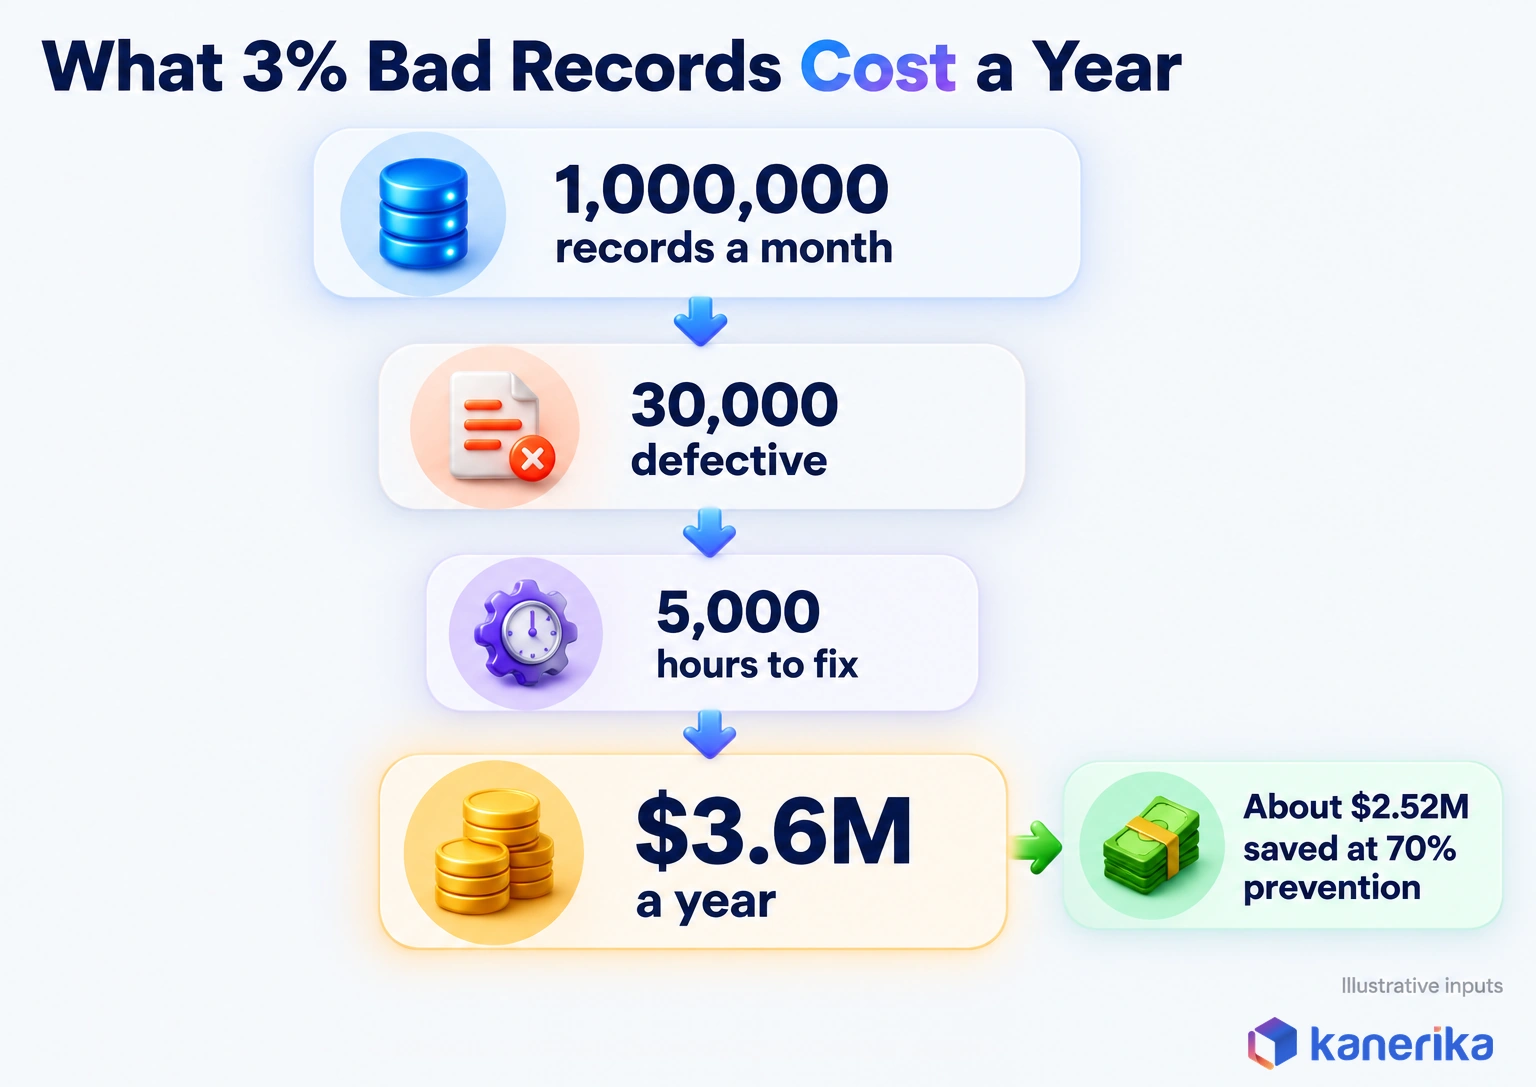
Here is an illustrative case with stated assumptions, not a benchmark. Say a company processes 1,000,000 customer and order records a month, and 3% are defective. That gives 30,000 bad records.
If each takes 10 minutes to research and correct, the team spends 300,000 minutes, or 5,000 hours. So at a loaded rate of $60 an hour, that is $300,000 a month, or $3.6 million a year.
Now assume prevention removes 70% of that rework. That is an assumption to test, not a promise. The saving would still be about $2.52 million a year, before counting a single recovered sale. Then swap in your own volumes, rates and minutes, and you have a defensible first estimate.
Where Bad Data Comes From: Seven Root Causes
Every defect has a birthplace, and it is usually a process rather than a person. So fixing records without fixing that process guarantees the same defects next month. These seven causes account for most of what data teams find.
- Manual entry. People type fast and skip optional fields, so a sales rep enters “Acme Corp” while a colleague enters “ACME Corporation.”
- Integration and migration breakdowns. Field mappings drop or truncate values when data integration tools are set up in a hurry. A data migration can also carry old defects into a new platform at full speed.
- No shared standards. Each team defines “active customer” or “region” its own way, so joins and totals disagree.
- No owner. When nobody is accountable for a data element, nobody fixes it at the source.
- Data decay. People move, change jobs and switch phone numbers, so a correct record becomes wrong with time.
- Upstream schema drift. When a source team renames a column or changes a type, downstream loads break or fill with nulls.
- Unvalidated AI and unstructured inputs. Text extracted from PDFs, emails or model outputs enters tables without the checks that form data gets, so errors slip through.
Migrations deserve special attention, because they concentrate several causes at once. Mappings change, old rules disappear, and deadlines push data migration testing aside. Step 4 covers the reconciliation check that catches that damage.
How Bad Data Spreads From Source to Decision
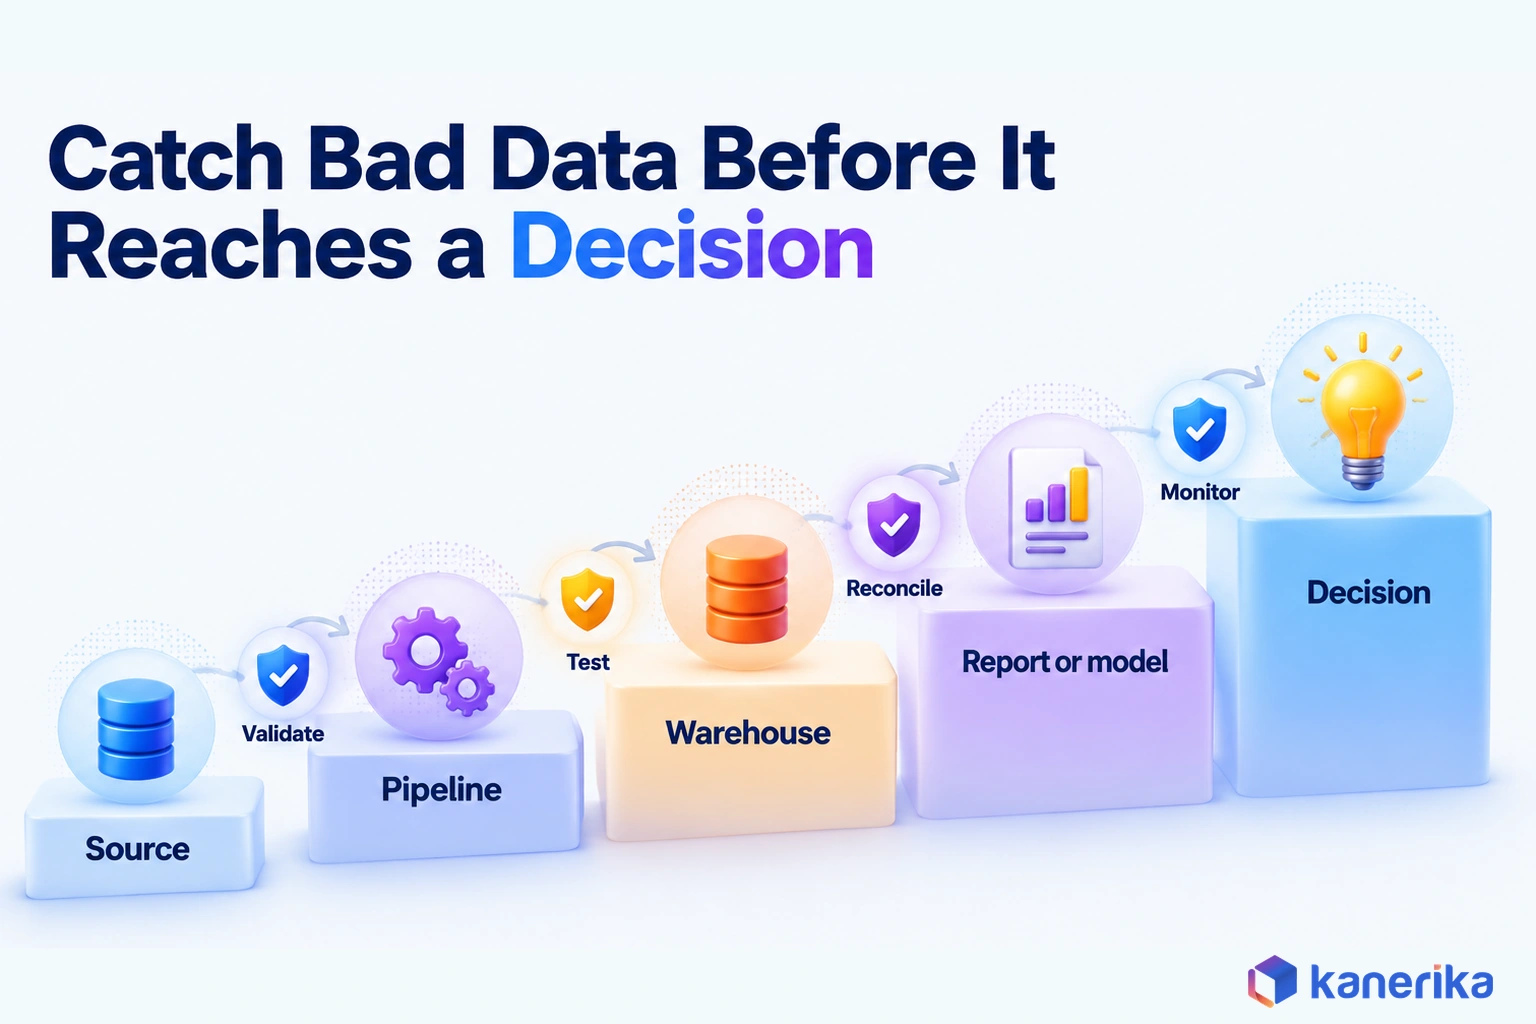
A defect does not stay where it starts. It travels from a source system through ETL pipelines into a warehouse, then into reports, models and finally decisions. At each hop it gets harder to trace and more expensive to correct.
A short, dated example shows how far one bad input can reach. In August 2023, a single flight plan that UK air traffic systems could not process caused widespread disruption, and thousands of passengers were stranded. So one record at the source became a national travel problem.
The lesson for data teams is about where checks belong. Validate at the source, then test in the pipeline, reconcile in the warehouse, and monitor what reports and models consume. To see how each hop connects, our explainer on data lineage shows how teams map that path end to end.
How to Fix Bad Data Quality in 5 Steps
A lasting fix follows the same order every time: decide what matters, measure it, find the cause, repair the data and then block the cause. Skipping straight to cleanup is a common reason programs stall. Each step below builds on the one before it.
Step 1: Pick Your Critical Data Elements and Price Their Defects
Start small and specific, because a short list is easier to fund. A critical data element is a field that drives revenue, compliance or a key model. Customer ID, billing address, product price and claim amount are typical examples. A short workshop with finance, operations and data leads usually produces a first list.
Then, for each element, estimate the defect cost with the formula above. A billing address that causes failed invoices outranks a marketing preference field, even if the preference field has more errors. Rank by business impact rather than error count, so effort goes where it returns money.
A quick ranking shows why. The figures below are illustrative assumptions, priced with the labor formula alone at $60 an hour:
| Element | Defects a month | Minutes to fix each | Monthly labor cost |
|---|---|---|---|
| Billing address | 400 | 45 | $18,000 |
| Marketing preference | 6,000 | 1 | $6,000 |
The preference field has 15 times more errors, yet the billing address costs three times as much. That is before counting a single failed invoice, so the address goes first.
Step 2: Profile the Data and Set a Baseline
Profiling measures what the data actually holds before anyone changes it. For each critical element, record completeness, uniqueness and validity rates. That baseline is how you will prove the program worked, so capture it before the first fix.
A baseline can start with a query this simple, run against one critical table:
-- Baseline profile for one critical table
SELECT
  COUNT(*) AS total_rows,
  100.0 * SUM(CASE WHEN customer_email IS NULL THEN 1 ELSE 0 END) / COUNT(*) AS email_null_pct,
  COUNT(*) - COUNT(DISTINCT order_id) AS duplicate_order_ids,
  SUM(CASE WHEN order_total < 0 THEN 1 ELSE 0 END) AS negative_totals,
  SUM(CASE WHEN order_date > CURRENT_DATE THEN 1 ELSE 0 END) AS future_dates
FROM sales.orders;
Turn each result into a written rule with a threshold, so everyone measures the same thing. Our guide to data profiling also covers column statistics, pattern checks and tooling in more depth.
| Dimension | Example rule | Target |
|---|---|---|
| Completeness | customer_id is not null | 100% |
| Validity | email matches a standard email pattern | 99% or higher |
| Uniqueness | one row per order_id | 100% |
| Timeliness | orders table refreshed within 2 hours | Every business day |
Step 3: Trace Each Defect to Its Root Cause
A failed rule tells you what is wrong, but not why. Root-cause work asks “why” until the answer is a process you can change. The five-whys method works well here because it stops teams from blaming the last person who touched the record.
Take duplicate customers, for example. Why are there duplicates? Because support creates new records. Agreeing one format for names, addresses and codes through data standardization removes many of these duplicates.
Why does support create them? Because the support tool cannot search the CRM. Why not? Because the tool was bought with no CRM integration in scope, and nobody owns the cross-system customer lookup. That is the process cause, so the real fix is an owned integration or lookup, not a weekly merge job. To find the producing system quickly, trace the defect back through data lineage from the report to its first source.
Then record each cause next to its rule. Over a few cycles, patterns appear, such as one intake form or one integration behind half your defects.
Step 4: Remediate With Cleansing, Matching and Master Data
Remediation repairs the records you already have. Cleansing corrects formats and obvious errors, while standardization applies one convention for names, addresses, units and codes. Deduplication then finds records that describe the same real-world entity.
Matching needs explicit rules. A rule might treat two customers as one when tax ID matches, or when name and postal code match closely. Machine learning can suggest likely matches, as our guide to AI in data management describes, but a steward still approves the rule. Survivorship rules then decide which value wins, for example the most recent verified address. For entities shared across many systems, such as customers, products and suppliers, master data management keeps one golden record that every system references.
After any migration or bulk fix, reconcile counts and totals between source and target, a step every data migration checklist should include. Purpose-built data reconciliation tools automate those comparisons, so a missing batch shows up before a user finds it.
Step 5: Prevent Recurrence With Validation, Contracts and Monitoring
Prevention is where the money comes back. Every rule from Step 2 should move as close to the source as possible. That way a bad value is rejected at entry instead of cleaned later.
Start with controls the database already offers. Foreign keys enforce referential integrity, check constraints block impossible values, while unique constraints stop duplicate keys:
ALTER TABLE sales.orders
  ADD CONSTRAINT fk_orders_customer
  FOREIGN KEY (customer_id) REFERENCES crm.customers (customer_id);

ALTER TABLE sales.orders
  ADD CONSTRAINT chk_order_total CHECK (order_total >= 0);

ALTER TABLE crm.customers
  ADD CONSTRAINT uq_customer_email UNIQUE (customer_email);
Beyond the database, three habits close the remaining gaps. Data contracts are written agreements between a producing team and its consumers on schema, meaning and freshness. Pipeline tests run those rules on every load and stop a bad batch before it publishes, which is the core of data reliability. Monitoring then watches volume, freshness and distribution, and alerts the owner when something drifts.
In a dbt project, for example, a pipeline test takes only a few lines of YAML. dbt ships four generic data tests (unique, not_null, accepted_values and relationships), and each one returns the rows that fail it. A test with zero failing rows passes, as the dbt data tests documentation explains:
models:
  - name: orders
    columns:
      - name: order_id
        data_tests:
          - unique
          - not_null
      - name: customer_id
        data_tests:
          - not_null
Monitoring and quality checks overlap but are not the same discipline. Our comparison of data observability vs data quality explains where each one fits.
Which Fix Fits Which Problem
Each defect type has a method that works best for it, so using the wrong one wastes months. A team that buys a deduplication tool to solve schema drift will still have broken loads. Match the problem to the method first, then choose a tool category and an owner.
| Problem | Best method | Tool category | Owner |
|---|---|---|---|
| Duplicate (customers or suppliers) | Match and merge rules, survivorship | MDM or matching engine | Data steward |
| Incomplete (missing required fields) | Validation at entry | Application forms, database constraints | Application owner |
| Invalid (impossible values, future dates) | Entry validation, check constraints | Database constraints, pipeline tests | Application owner |
| Inconsistent (format drift in dates, codes, units) | Standardization rules | Data cleansing or ETL transforms | Data engineer |
| Schema changes break loads | Data contracts and pipeline tests | Pipeline testing frameworks | Producing team |
| Outdated (silent freshness gaps) | Freshness and volume monitors | Data observability | Data engineer |
| Totals differ across systems | Source-to-target reconciliation | Reconciliation tools | Data owner |
| Biased (skewed training sets) | Representation checks on training sets | Data profiling and ML data validation | Data scientist plus data steward |
The table also shows why tooling should come last. Every method depends on rules and owners that a tool cannot invent for you.
Checklist
Data Governance Checklist
Work through ownership, quality rules, policies and controls step by step, so every fix in this table has a rule and an owner behind it.
Get the Checklist →Why Bad Data Hurts AI More Than Dashboards
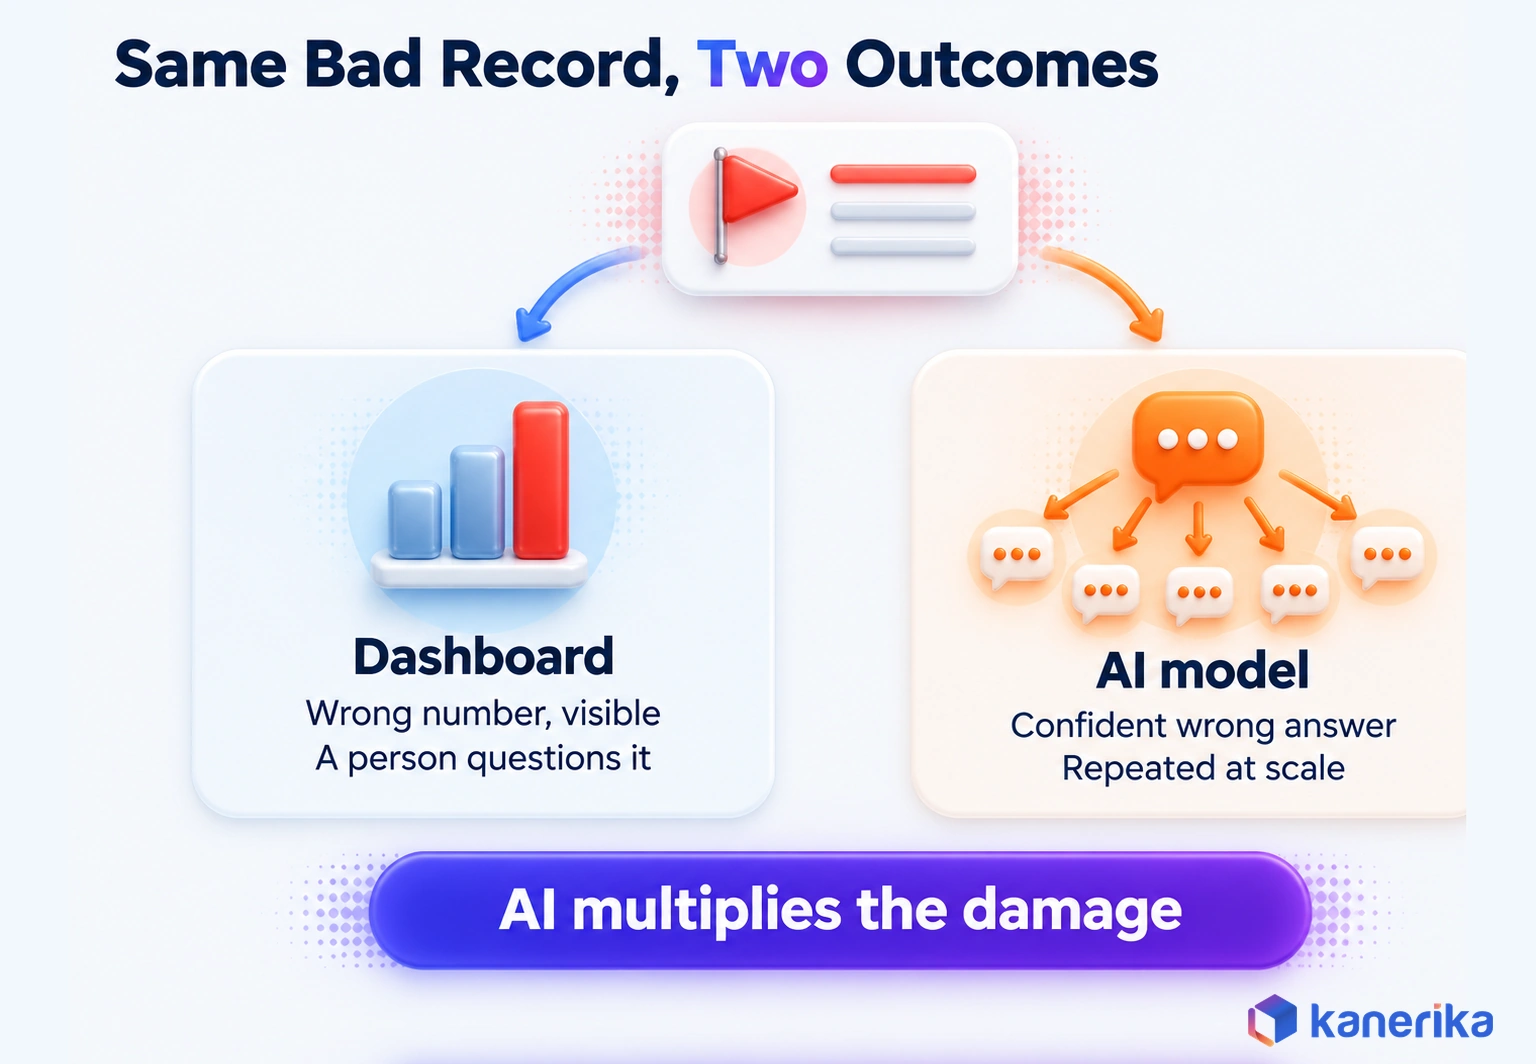
A wrong number on a dashboard is visible, so a person can question it. A model trained or grounded on bad data, however, repeats the error quietly, at scale and with confidence. That difference raises the stakes for every AI project.
Recall the warning sign from earlier, an AI assistant citing a policy, price or contact that changed months ago. Say a retrieval assistant quotes an expired price list because the old PDF was never retired. The model worked as designed, and the source data failed it.
IBM’s analysis notes that data quality problems can cause hallucinated AI outputs or make models drift over time. Gartner’s February 2025 press release predicted that through 2026 organizations will abandon 60% of AI projects unsupported by AI-ready data. The same release reported that 63% of organizations either lack or are unsure whether they have the right data management practices for AI.
Regulators also write data quality into AI rules. Article 10(3) of the EU AI Act covers training, validation and testing data for high-risk systems. That data shall be “relevant, sufficiently representative, and to the best extent possible, free of errors and complete in view of the intended purpose.” In the US, the NIST AI Risk Management Framework, released in January 2023, provides a voluntary way to manage AI risk.
For a data team, AI changes three things in practice:
- Unstructured inputs, such as documents and chat logs, need quality checks inside the AI data pipeline, not just in tables.
- Bias becomes a quality dimension, so training sets need representation checks during data preprocessing, alongside null and duplicate checks.
- Freshness matters more, because a retrieval system will answer from whatever version it finds.
Who Owns Data Quality
Data quality fails without clear ownership, and it fails slowly. Everyone assumes another team will fix the problem, so nobody does. That gap is one of the classic data governance challenges. A simple responsibility map ends that loop.
The model below fits a typical enterprise. The business owns the meaning of the data, stewards run the day-to-day rules, while engineers build the controls. If you are designing the wider program, our guide to building a data quality framework covers scope, metrics and tooling choices.
| Role | Responsible for | Accountable for |
|---|---|---|
| Data owner (business leader) | Defining what “good” means for the domain | Quality targets and funding |
| Data steward | Writing rules, triaging issues, approving merges | Daily rule health in the domain |
| Data engineer | Building validation, tests, monitors and fixes | Pipeline reliability |
| Data consumer (analyst, data scientist) | Reporting defects with examples | Using data within its stated limits |
| Governance council | Settling cross-domain definitions and disputes | Policy and priorities |
Ownership also sits inside a broader governance model. The data governance framework guide explains how policies, roles and councils fit together.
Standards and Regulations That Set the Bar
Setting quality targets is the data owner’s job, and outside standards make those targets defensible. Several standards and rules define what good enough means. You do not need all of them, but knowing which ones apply helps you set targets that auditors and partners will accept.
Datasheet
Elevate Data Governance, Compliance and Security of Your Organization
See how Kanerika’s governance offerings assign ownership, enforce quality and compliance rules, and keep sensitive data secure across your platforms.
View the Datasheet →| Standard or rule | What it asks | Who it applies to |
|---|---|---|
| ISO/IEC 25012 | A model of 15 data quality characteristics | Any organization defining quality requirements |
| ISO 8000 series | Standards for data quality and master data | Organizations exchanging master data |
| DAMA dimensions, UK Government Data Quality Framework | Six core dimensions and a quality culture | UK public sector, widely reused elsewhere |
| BCBS 239 | Accurate, complete and timely risk data aggregation and reporting | Banks, especially systemically important ones |
| EU AI Act, Article 10 | Relevant, representative and as error-free as possible training data | Providers of high-risk AI systems |
| NIST AI RMF | Voluntary practices for managing AI risk | Any organization building or using AI |
BCBS 239 has an instructive origin. The Basel Committee published the principles in January 2013. The 2007 crisis had shown that many banks could not aggregate their risk exposures quickly or accurately. Covered banks must show risk data that is accurate, complete and reconciled, which is Steps 2 to 4 applied under a regulator.
Common Mistakes That Bring Bad Data Back
Many stalled programs did fix their data once. It simply went bad again because the fix never reached the cause. These mistakes show up again and again, and each one has a simple counter.
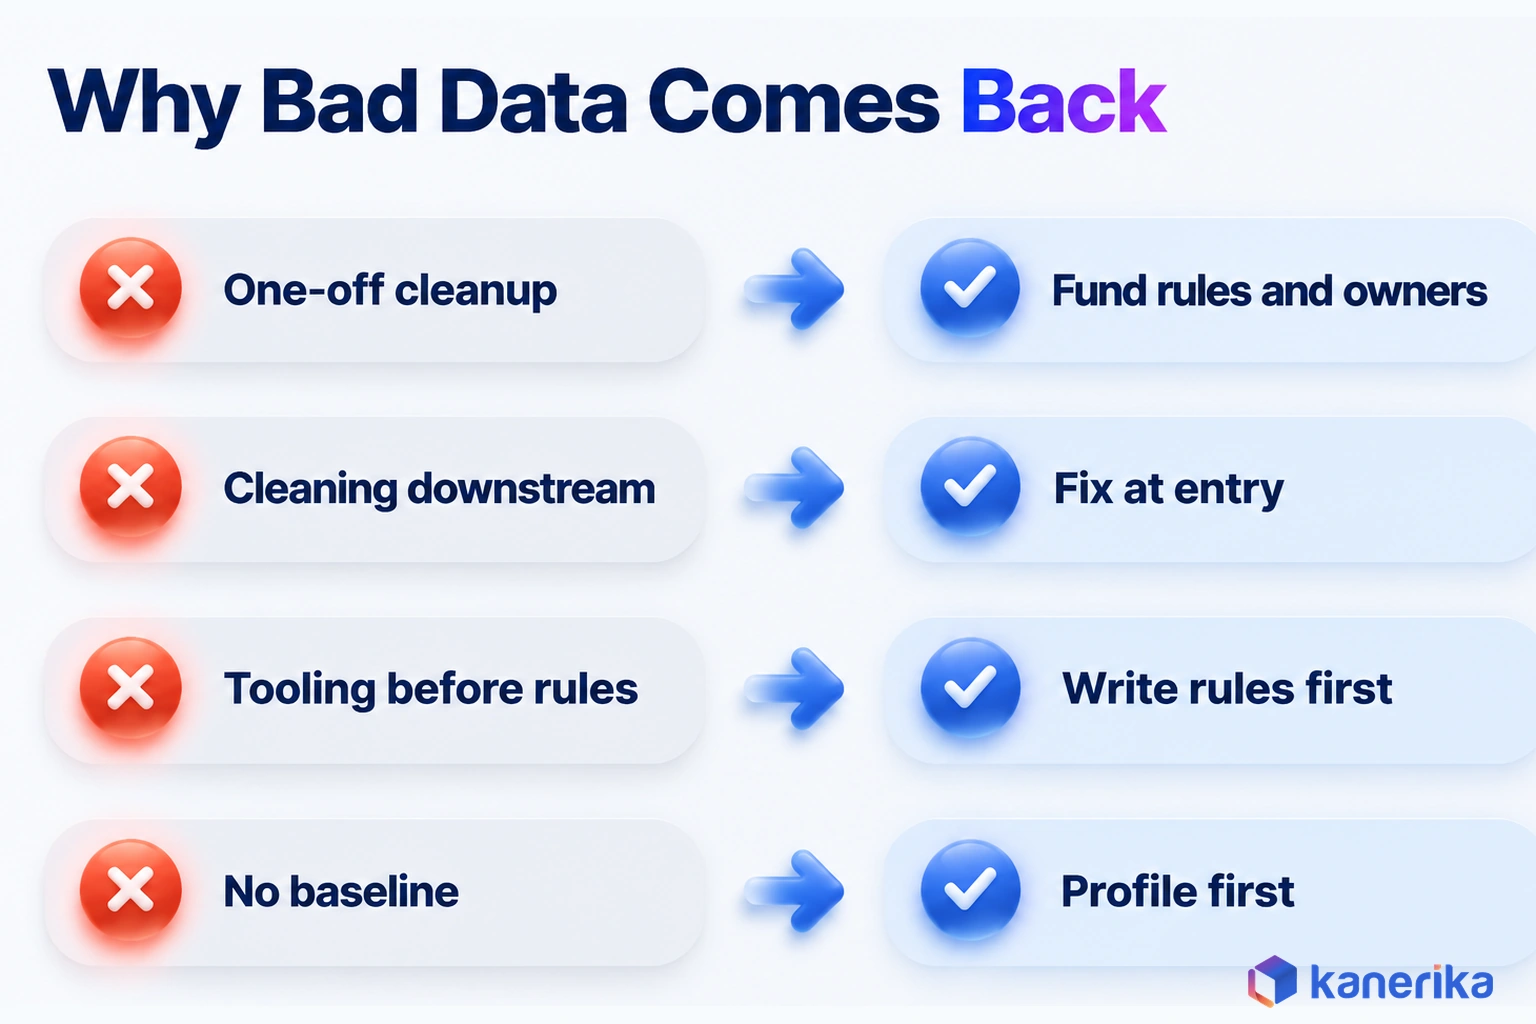
- One-off cleanup projects. A big cleanup with no prevention decays within months. In the worked example above, a cleanup clears 30,000 bad records, and the next month brings 30,000 more. Fund rules and owners instead of a single sprint.
- Cleaning only downstream. Fixing data in the warehouse leaves the source broken, so push each rule back toward entry.
- Fixing records without telling the producer. A steward who quietly corrects bad rows hides the defect from the team that creates it. Log each fix and send it back to the source owner.
- Tooling before rules. A platform with no agreed rules only measures confusion. Write rules first, then automate them.
- No baseline. Without a starting measure, nobody can show progress. Profile before you change anything.
- Alert fatigue. Hundreds of low-value alerts teach people to ignore all of them. Instead, alert only on critical elements and tune thresholds monthly.
Avoiding these is less about effort than about order. Teams that follow the five steps in sequence rarely fall into more than one of them.
How Kanerika Fixes Data Quality at the Source
Kanerika treats poor data as a process problem with a data symptom. Our work follows the same five steps described above, adapted to each client’s systems and regulators.
We start by assessing and profiling the critical data that drives revenue and reporting. Business owners sign off on the rules, so quality targets reflect real decisions. Our data engineering team fixes root causes inside pipelines and source integrations, not just in the warehouse.
Automated controls, monitoring and governance policies from our data governance services, which include KANGovern, KANGuard and KANComply, keep those fixes in place. Once the first set of critical elements holds steady, we expand to the next.
A pharmaceutical client shows why data consolidation can be the root-cause fix. Its data sat across Model N, SQL Server, SAP and SAP Vistex, with no central warehouse. With four systems and no shared source, teams duplicated effort and reported inconsistent numbers.
That split was the process cause Step 3 looks for, so cleaning reports alone could not fix it. Kanerika removed the split by unifying those sources into a Microsoft Fabric lakehouse, with Power BI reporting on one source of truth. The pharma data platform case study records a 78% reduction in data-related errors and 41% faster data processing.
Case Study
78% Fewer Data Errors for Pharma with Microsoft Fabric
A pharmaceutical company unified data from Model N, SQL Server, SAP and SAP Vistex into one Fabric lakehouse, cutting data-related errors by 78% and speeding up data processing by 41%.
Read the Case Study →Bottom Line: How to Fix Bad Data Quality and Keep the Savings
To fix bad data quality, price the critical defects, profile them, trace their causes, remediate the backlog and prevent recurrence at the source. Forrester research cited by IBM finds that over a quarter of organizations lose more than USD 5 million a year to poor data quality. The worked example shows a mid-sized operation losing $3.6 million a year in rework labor alone.
The savings come from prevention, not from one-off cleanup, because prevention removes the rework that cleanup keeps paying for. Clear the backlog once, then block each cause where it starts, and you fix bad data quality and cut its cost for good.
Frequently Asked Questions
What does poor data quality mean?
Poor data quality means data that is not fit for the decision or process using it. It may be inaccurate, incomplete, inconsistent, duplicated, outdated or invalid. The same record can be fine for one use and wrong for another, so quality is always judged against a purpose. Data quality issues are the specific defects behind that gap.
What is an example of bad data quality?
A common example is one customer stored three times across CRM, billing and support under slightly different names. Marketing sends three mailings, revenue per customer looks lower than it is, and service agents miss earlier tickets. Other examples include blank required fields, orders dated in the future and addresses that went out of date years ago.
How do you improve data quality over the long term?
Long-term improvement depends on ownership and prevention. Give every critical data element a named owner and steward, and write measurable rules with targets. Move those rules as close to data entry as possible, test them in every pipeline run and monitor freshness and volume. Review results monthly and expand to new data elements once the first set holds.
How does poor data quality affect AI and machine learning?
Models learn and answer from the data they are given, so defects become wrong predictions or confident wrong answers. IBM notes that data quality problems can cause hallucinated outputs and model drift. Gartner predicted organizations will abandon 60% of AI projects unsupported by AI-ready data through 2026. Biased or stale training data also creates compliance risk.
Can AI automatically fix bad data quality?
AI helps, but it cannot own the result. Machine learning is good at fuzzy matching of duplicates, spotting anomalies and suggesting standard formats. It still needs rules that people define, such as which source wins a conflict or what counts as a valid value. Keep a human steward approving merges and reviewing model suggestions on critical data.
How do you prevent bad data from entering a data warehouse?
Block it before it lands. Validate values in source applications, enforce keys and check constraints in databases and agree data contracts with producing teams. Then run automated tests in each pipeline so a failing batch stops before it publishes. Finally, monitor freshness, volume and distributions in the warehouse so any drift reaches an owner quickly.
Who is responsible for data quality in an enterprise?
Responsibility is shared, but accountability should be clear. A business data owner defines what good means and funds targets. A data steward writes rules and triages issues, data engineers build validation and monitoring, and consumers report defects with examples. A governance council settles definitions that cross domains. Without named owners, defects tend to return within months.
What tools help improve data quality?
Tools fall into a few categories. Profiling tools measure what data holds, and cleansing and standardization tools fix formats. Matching and master data management tools handle duplicates, while pipeline testing frameworks enforce rules on each load. Observability platforms monitor freshness and volume, and reconciliation tools compare systems. Choose the category after you define the problem and rules.
What are the types of bad data?
Seven types cover most defects. Inaccurate data does not match reality, and incomplete data has missing values. Inconsistent data uses different formats across systems, while duplicate data stores one entity more than once. Outdated data has decayed over time, invalid data breaks business rules, and biased data underrepresents a group, which matters most for AI training sets.
What are the dimensions of data quality?
There is no single fixed count. The UK Government Data Quality Framework uses six core DAMA dimensions, which are accuracy, completeness, consistency, timeliness, uniqueness and validity. ISO/IEC 25012 defines 15 characteristics, split between inherent and system-dependent ones. Many teams start with the six DAMA dimensions and add others, such as relevance, when their use cases need them.
What are the 3 C's of data quality?
The 3 C’s are an informal shorthand, usually completeness, consistency and correctness, rather than a formal standard. They map onto the DAMA dimensions of completeness, consistency and accuracy. The shorthand is useful for quick conversations with business users. For real measurement, though, use the full dimension set so that timeliness, uniqueness and validity are not missed.
What causes poor data quality?
Poor data usually starts in a process, not a person. Common causes are manual entry, broken integrations and migrations, missing shared standards and data with no owner. Records also decay as people move or change jobs, upstream schema changes break loads, and AI or document extraction adds unvalidated values. Fixing the process stops the defects from returning.
What is the impact of bad data?
Bad data wastes staff time on rework and reconciliation, sends invoices and products to the wrong places, and leads to decisions built on wrong figures. It can also trigger audit findings and regulatory penalties. In AI systems it causes wrong or hallucinated answers and model drift. The losses spread across many budgets, so they often go unmeasured.
How much does bad data quality cost a business?
It varies widely, but the numbers can be large. Forrester research cited by IBM finds over a quarter of organizations estimate losses above USD 5 million a year from poor data quality, and 7% report USD 25 million or more. Estimate your own labor cost as defective records times minutes to fix, divided by 60, times hourly rate.
How do you identify bad data?
Start with business symptoms such as reports that disagree, manual reconciliation spreadsheets, bounced emails and failed loads. Then run quick checks on a critical table. Measure null rates on required fields, count duplicate keys, look for out-of-range values like negative quantities, and compare totals between two systems that should match. Profiling tools automate these checks at scale.
How do you fix a data quality issue?
Fix it in five steps. Pick the critical data elements and estimate the cost of their defects. Profile them to set a baseline, then trace each defect to the process that creates it. Remediate with cleansing, deduplication and master data, and finally prevent recurrence with validation at entry, data contracts, pipeline tests and ongoing monitoring.