TL;DR
Automated data integration done right uses change data capture for records that change all day, and scheduled batch for data read daily. Either way, every flow detects new, changed and deleted records, validates them, loads them safely on re-runs, and alerts someone on failure. The most common silent fault is a sync that never copies deletes, so reports keep rows the source already removed. Choose mirroring when you want a near-live copy with little build work, and keep virtualization for occasional queries across sources. Buy managed connectors for common databases and SaaS apps, and build custom flows only where no connector handles your source well. Start with one flow, set freshness and reconciliation targets, prove it with five failure tests, then turn it into a template.
Key Takeaways
- Automated data integration moves and reconciles data between systems on a schedule or when a source changes, so nobody runs steps by hand.
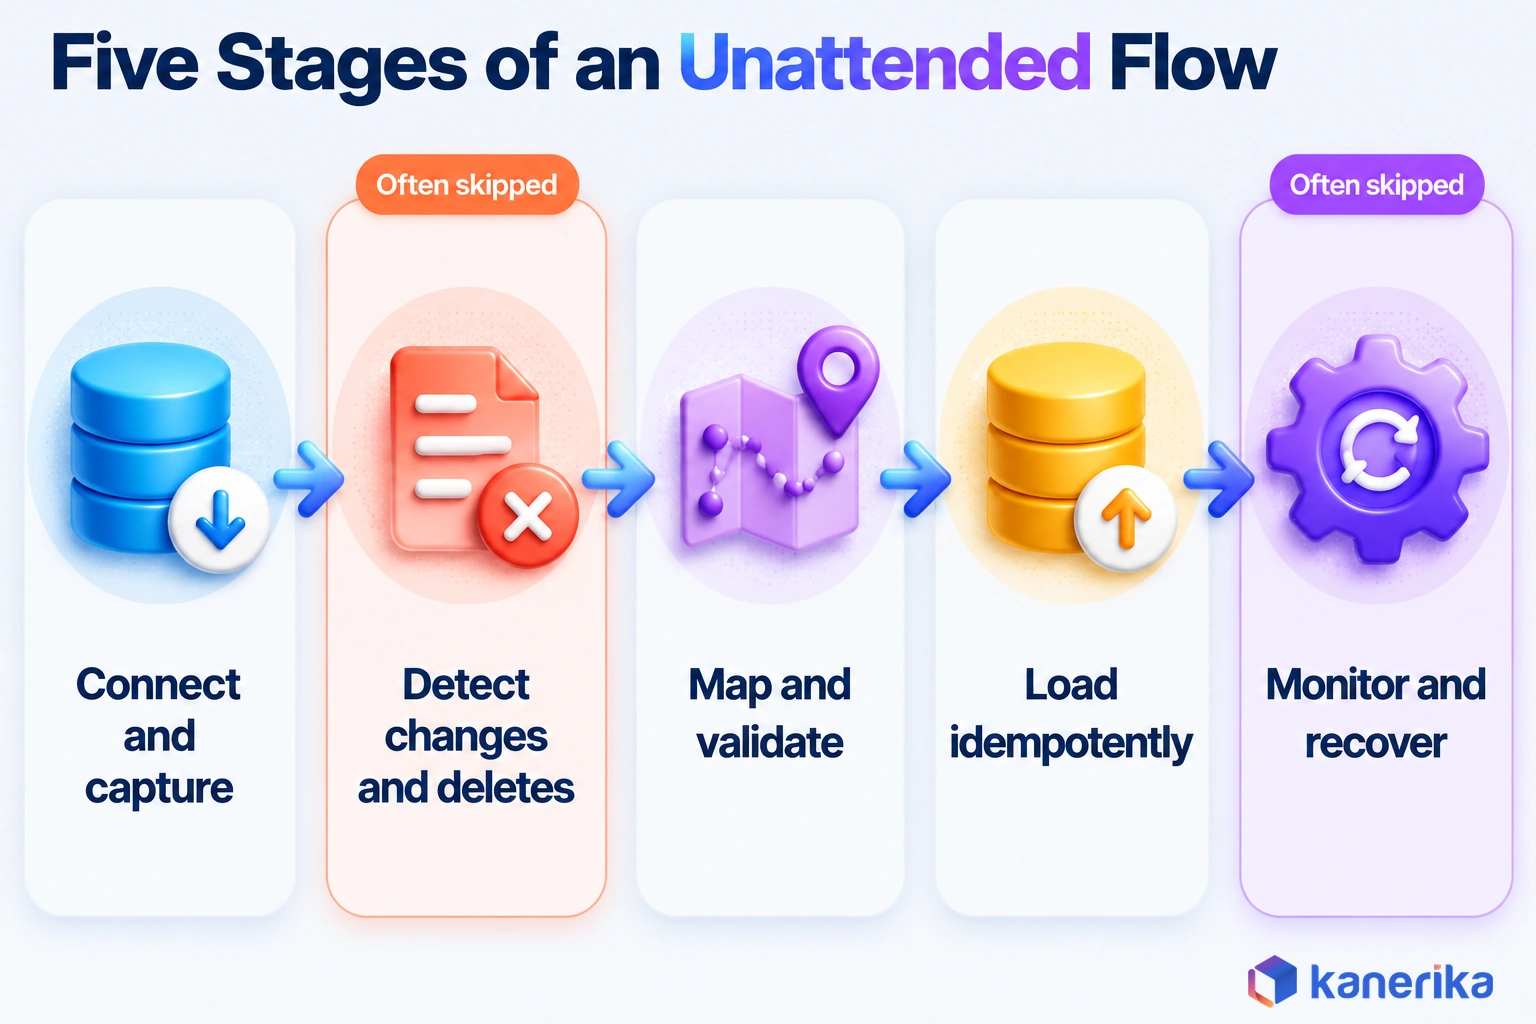
- A production flow has five stages: connect, detect changes including deletes, map and validate, load idempotently, then monitor and recover.
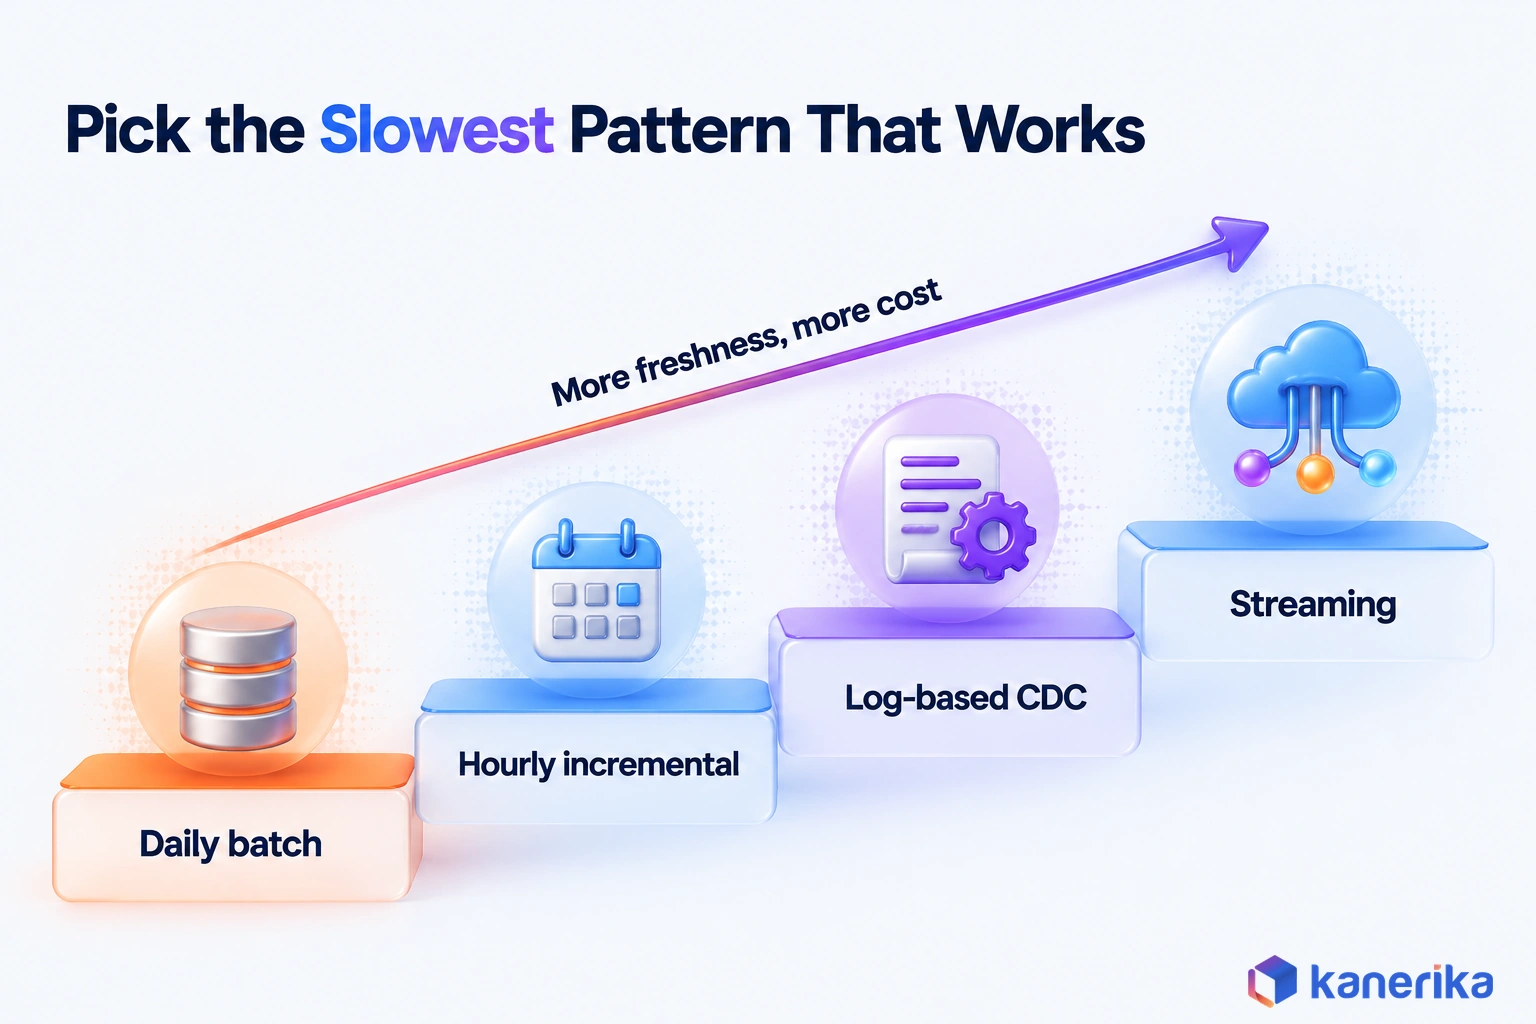
- Pick the slowest pattern the business decision tolerates, because each step toward real time adds cost and load on the source.
- Log-based change data capture (CDC) catches deletes that a “last updated” watermark misses, so reports stop quietly drifting.
- Before you choose a platform, test delete handling, schema change, failed-run restart, partial reload and cost at three times today’s volume.
- Measure freshness lag, row-count reconciliation, failed-run rate and time to recover for every flow.
Watch on YouTube
Kanerika | Transforming Data Management and Reporting for Phoenix Recycling Group | Data Integration
A Kanerika client story on transforming data management and reporting for Phoenix Recycling Group through data integration. Watch it as a real-world companion to the stages this guide breaks down.
The Monday Report That Still Counted Friday’s Write-Offs
Picture an operations lead at a regional food distributor on a Monday morning. Her stock report shows a full bay of yogurt pallets as available. Yet the warehouse wrote those pallets off on Friday when a cooler failed, and the warehouse system recorded it within the hour.
Still, every job in the pipeline reports success. The nightly sync ran on time, and no alert fired.
This fault is small and common. The sync copies inserts and updates from the warehouse system, but it never sees deletes, so a removed record stays in the report for good. Meanwhile, sales has already promised part of that stock to a customer.
That gap is what this guide is about, because integration is easy to automate and easy to get subtly wrong. First, the sections below explain how a flow works, which pattern fits which workload and what breaks. After that, they walk through a step-by-step build and the tests to run before go-live.
What Is Automated Data Integration?
Automated data integration is the practice of moving, matching and reconciling data between systems without people running the steps by hand. Jobs start on a schedule or when a source changes, and software then handles the checks, retries and alerts an engineer used to do.
Speed is only part of the point. The real goal is data you can trust without checking it yourself, because the flow proves its own counts and flags its own failures.
Consider a finance analyst who exports a ledger file every Monday and pastes it into a spreadsheet. That is integration, but it is not automated. A 6 a.m. flow that checks row counts against the source and pages someone on a mismatch is automated.
It also sits inside a wider design. Governance, master data and the platform layers around them belong to your enterprise data integration architecture. This guide stays with the mechanics that run unattended.
What Gets Automated
Seven tasks make up most of the work. Once each one is designed and tested, it runs without a person.
- Extract: pull data from databases, SaaS apps, files and APIs when a schedule or trigger fires.
- Change detection: find only the records that are new, changed or deleted since the last run.
- Mapping: match source fields to target fields, then convert types, codes and units.
- Validation: check required fields, valid ranges and duplicates before anything loads.
- Scheduling: run flows in the right order, so each one waits until its inputs are ready.
- Monitoring: track run status, row counts, freshness and cost for every flow.
- Recovery: retry failed steps, replay a window of data and reload one table while the rest stay untouched.
Automated vs Manual Integration
The difference shows most clearly in what goes wrong. Manual integration fails loudly and often, because a person forgets a step. Automated integration fails less often but quietly, unless someone designs the checks.
| Task | Manual | Automated | Risk removed |
|---|
| Pulling source data | An analyst exports a file when asked | Extract runs on a schedule or when the source changes | Missed or late exports |
| Finding changes | Full re-copy, then eyeballing the difference | Change detection or CDC, so only changes move | Double counting and missed updates |
| Matching fields | Spreadsheet lookups by hand | Versioned mapping rules | Copy-paste and lookup errors |
| Checking quality | Spot checks before a meeting | Validation rules on every run | Bad rows reaching reports |
| Handling failures | Someone notices a stale report later | Alerts, retries and replay | Silent gaps in the data |
| Documenting | Knowledge stays in one person’s head | Logged runs and data lineage | Audit questions nobody can answer |
How It Differs From ETL, Data Ingestion and Pipeline Automation
These terms overlap, and vendors also use them loosely. So the simplest way to separate them is by the question each one answers.
| Term | Question it answers | Scope |
|---|
| ETL or ELT | How is data extracted, transformed and loaded? | One method of moving data; see ETL pipeline best practices |
| Data ingestion | How does raw data land in a platform? | The first stage only, before any transformation |
| Data pipeline automation | How do pipelines trigger and run unattended? | Orchestration and triggers |
| Data warehouse automation | How is the warehouse model built and loaded? | Warehouse design, then scheduled loading |
| Automated data integration | Do the connected systems agree, with no manual work? | End to end, from capture through reconciliation and recovery |
ETL remains one of the methods inside an automated flow, and our guide to data integration vs ETL covers where the two split. What changes is who runs it and who checks it. In an automated setup, the flow detects its own changes, tests its own output and raises its own alarms.
Talk to Kanerika
Not Sure Which Flows to Automate First?
Kanerika can review your sources, freshness needs and the manual steps your team runs today, then recommend the first flow to automate and the checks it needs.
Schedule a Demo →
Why Automated Data Integration Matters in 2026
Integration used to be a reporting problem. By 2026 it is also an AI problem, because agents that act on stale or partial data make bad decisions at machine speed.
The MuleSoft 2026 Connectivity Benchmark, released on February 5, 2026, puts numbers on it. Vanson Bourne ran the survey with Salesforce, reaching 1,050 IT leaders in October and November 2025, and Deloitte Digital contributed insights. Of those leaders, 96% said AI agent success depends on seamless data integration across systems. The same report found that organizations run 12 AI agents on average and that half of them work in isolated silos, which is the integration gap the 96% figure describes.
From the data side, Gartner reached a similar conclusion. In a February 2025 press release, it predicted that through 2026, organizations will abandon 60% of AI projects unsupported by AI-ready data. The same release reported that 63% of organizations either lack or are unsure they have the right data management practices for AI.
An agent that approves a refund, reorders stock or flags a late shipment is only as good as the data it reads. When the order system and the warehouse system disagree, the agent simply picks one and acts. For this reason, AI data pipelines start with the same discipline this guide covers, which is current, connected and checked data.
There is a plainer reason too. Every new SaaS tool, plant or region adds another source to keep in step, especially once cloud data integration must reach on-premises systems too. Manual effort grows with every new source, while a tested template adds each one as configuration.
Case Study
60% Faster Data Integration for a Manufacturer with SAP
An edible oil manufacturer replaced manual syncing of SAP and non-SAP financial and HR data with automated integration, cutting data integration time by 60% and lifting productivity by 30%.
Read the Case Study →
Benefits and What Each One Changes
A benefit only counts if you can measure it. So the table pairs each one with the number to watch.
| Benefit | What changes | How to measure |
|---|
| Fresher data | Reports and agents read data that is minutes or hours old rather than days | Freshness lag per table |
| Fewer errors | Validation stops bad rows before they load | Rejected rows and reconciliation gaps per run |
| Less manual work | Engineers stop re-running exports and fixing sheets | Manual hours per month on data prep |
| Faster recovery | Failed runs retry or replay instead of needing a rebuild | Mean time to recover |
| Clear audit trail | Every run, row count and change is logged | Share of flows with lineage and run logs |
| Lower cost per source | New sources reuse a tested template | Hours to onboard a new source |
How Automated Data Integration Works: Five Stages
Every automated flow runs through the same five stages, whatever the tool. Think of them as the life of a single table moving from a source system to an analytics platform.
- Connect and capture. The flow signs in to the source, then reads data through a connector, an API, a file drop or the database log. Credentials sit in a vault rather than in the job.
- Detect new, changed and deleted records. The flow works out what changed since the last run. Most silent errors start here, because seeing deletes needs a method built to see them.
- Map, transform and validate. Source fields map to target fields, and rules reject rows that fail checks. Rejected rows then go to a quarantine table with a reason attached.
- Load idempotently. Idempotent means a re-run gives the same result as the first run. Loads use business keys and merge logic, so a retry never doubles a row.
- Monitor, alert and recover. The flow records run time, row counts and freshness. When a threshold breaks, it alerts an owner, and it can also replay a window of data.
The stages also tell you where to look when something breaks. A stale report points to stage one or five. Wrong totals point to stage two or four, while odd values point to stage three.
Stage Four in Code: An Idempotent Merge
Stage four is easiest to see in code. A merge keyed on the business key, together with an operation flag from the change feed, makes reloads safe and applies deletes. The syntax below is generic SQL, so it varies slightly by engine. On SQL Server, the MERGE reference requires the closing semicolon and returns an error when two staging rows match one target row on an update.
MERGE INTO dw.inventory AS t
USING staging.inventory_changes AS s
  ON t.sku_id = s.sku_id AND t.site_id = s.site_id
WHEN MATCHED AND s.op = 'D' THEN
  DELETE
WHEN MATCHED THEN
  UPDATE SET qty = s.qty, updated_at = s.changed_at
WHEN NOT MATCHED AND s.op <> 'D' THEN
  INSERT (sku_id, site_id, qty, updated_at)
  VALUES (s.sku_id, s.site_id, s.qty, s.changed_at);
Run it twice on the same staging data, and the target does not change. That property lets a scheduler retry a failed run without waking anyone. Still, keep only the latest change per key in staging first, or an older update can overwrite a newer one.
Which Integration Pattern Fits Your Workload?
The right pattern depends on one question: how fresh does the data need to be for the decision it feeds? A daily sales dashboard and a fraud check, for instance, need very different answers. Paying for real time that nobody acts on is a cost with no return.
Four patterns cover nearly every workload. Each one finds changes in a different way, so that choice decides whether deletes ever reach the target.
| Pattern | How it finds changes | Catches deletes? | Typical freshness | Best fit |
|---|
| Scheduled batch | Re-reads the table or a date range | Only when the table is fully reloaded | Hours to a day | Small tables and daily reporting |
| Watermark incremental | Reads rows whose “last updated” value is later than the last run | No | Minutes to hours | Append-mostly tables, as long as timestamps are reliable |
| Log-based CDC | Reads the database transaction log | Yes | Seconds to minutes | Operational tables that change all day |
| Mirroring | Platform-managed replication of changes | Yes, when the source sends them | Near real time | Live analytics copies when build time is short |
When Batch Beats Real-Time
Batch wins more often than vendors suggest. When a report is read once each morning, a nightly load is cheaper, simpler and easier to reconcile than a stream. Finance close, monthly regulatory filings and most HR reporting fit here.
Real time earns its cost only when a delay changes an outcome. Stock shown to customers, payment fraud checks and machine alerts on a factory line are good examples. Event-driven cases like these are what Real-Time Intelligence in Microsoft Fabric is built for. Unless someone acts on the data within the hour, an hourly or daily load is the honest choice.
CDC vs Watermark-Based Incremental Loads
Both patterns move only what changed, but they see different things. A watermark load asks the source for rows whose “last updated” timestamp is newer than the last run. It is simple, yet it misses every deleted row, because a deleted row leaves no timestamp behind.
Log-based change data capture reads the database’s own transaction log instead, and the Debezium documentation lists what that buys you. It captures deletes, needs no “Last Updated” column, and can capture the old state of a record next to the new one. Delete capture closes exactly the gap in the Monday stock report from the opening.
The trade-off is setup. CDC needs log access, the right database permissions and a plan for log retention. So it pays off on busy operational tables, although it is overkill on a small reference list.
CDC in Config: A Debezium Connector for PostgreSQL
Those permissions and retention choices end up in a short config file. Below is a Kafka Connect registration for the Debezium PostgreSQL connector, with property names from the Debezium PostgreSQL connector reference. Host, table and slot names are placeholders.
{
  "name": "erp-inventory-cdc",
  "config": {
    "connector.class": "io.debezium.connector.postgresql.PostgresConnector",
    "plugin.name": "pgoutput",
    "database.hostname": "erp-db.internal",
    "database.port": "5432",
    "database.user": "cdc_reader",
    "database.password": "${file:/opt/kafka/secrets/erp.properties:password}",
    "database.dbname": "erp",
    "topic.prefix": "erp",
    "table.include.list": "public.inventory,public.orders",
    "slot.name": "erp_inventory_slot",
    "publication.name": "erp_inventory_pub",
    "publication.autocreate.mode": "filtered",
    "snapshot.mode": "initial",
    "tombstones.on.delete": "true",
    "heartbeat.interval.ms": "60000"
  }
}
A few lines carry most of the weight. The default plugin.name is decoderbufs, so the config sets pgoutput, the standard logical decoding plug-in in PostgreSQL 10 and later. With publication.autocreate.mode set to filtered, the publication covers only the tables in table.include.list, and snapshot.mode initial copies them once before streaming starts.
The replication slot needs the most care. PostgreSQL keeps write-ahead log files until the connector confirms it has read them, so a stopped connector lets the log grow on the source. The heartbeat.interval.ms setting, off by default, keeps that confirmed position moving while the tracked tables are quiet.
Deletes arrive as events with op set to “d”, a before value holding the old key and a null after. Because tombstones.on.delete defaults to true, a tombstone follows so Kafka compaction can drop the key. The staging step then maps that “d” to the ‘D’ flag the merge above reads. The password comes from a Kafka Connect config provider rather than the file itself.
Mirroring and Data Virtualization
Mirroring keeps a near-live copy of a source inside your analytics platform, run by the platform rather than by your own pipeline code. Microsoft Fabric is a concrete example. Its open mirroring option lets any application write change data directly into a mirrored database in Fabric.
The change format is explicit about deletes. Each change row in the open mirroring landing zone format carries a __rowMarker__ value. That value is 0 for insert, 1 for update, 2 for delete or 4 for upsert. As a result, the missed-delete problem has a named place in the contract, and the Microsoft Fabric architecture handles the rest inside the platform.
Data virtualization goes one step further and copies nothing. Instead, queries run against the sources in place. It suits occasional cross-system questions, but it struggles when heavy dashboards hit a production database at 9 a.m.
Pattern by Business Scenario
Most estates use several patterns at once. This table maps common scenarios to the pattern that usually fits.
| Scenario | Freshness need | Pattern | Why |
|---|
| Month-end finance close | Daily | Scheduled batch | Reconciles to a fixed cut-off |
| Inventory shown to customers | Minutes | Log-based CDC or mirroring | Stock moves and deletes must show quickly |
| Multi-site ERP reporting | Under an hour | Mirroring or CDC per site | Keeps each site traceable without heavy builds |
| Customer 360 | Hours | Watermark incremental plus a daily delete check | CRM records change often but are rarely deleted |
| Clinic scheduling | Minutes | CDC from the scheduling database | Cancellations arrive as deletes or status changes |
| Ad hoc cross-system analysis | On demand | Virtualization | No copy to maintain |
What Breaks Automated Integration, and How to Catch It
Automated flows rarely fail with a crash. Instead, they fail by running perfectly and loading the wrong data, which is why job status alone tells you very little.
Six faults cause most of the trouble. Each has a symptom a business user notices first and a control that catches it before they do.
| Failure | Symptom | Control |
|---|
| Schema drift | A new or renamed column breaks a load or arrives empty | Schema checks on every run, so the flow alerts and pauses rather than dropping columns |
| Missed deletes | Reports keep records after the source removed them | Log-based CDC, or a periodic key comparison against the source |
| Duplicates on reload | Totals double after a retry | Merge on business keys so loads stay idempotent |
| Silent stalls | Data stops updating, yet no job fails | Freshness alerts per table, not only job-failure alerts |
| Late-arriving data | Yesterday’s totals change today | Reprocess a rolling window, then label provisional figures |
| API rate limits | Partial loads from SaaS sources | Backoff and retry, together with paging checkpoints and row-count checks |
The lesson across all six is the same: put checks on the data itself, which is the core idea of data observability. For example, a flow that reports success while its target table has not changed in 18 hours should page someone. The rule fits in one line: alert when max(updated_at) in the target falls more than 18 hours behind the source.
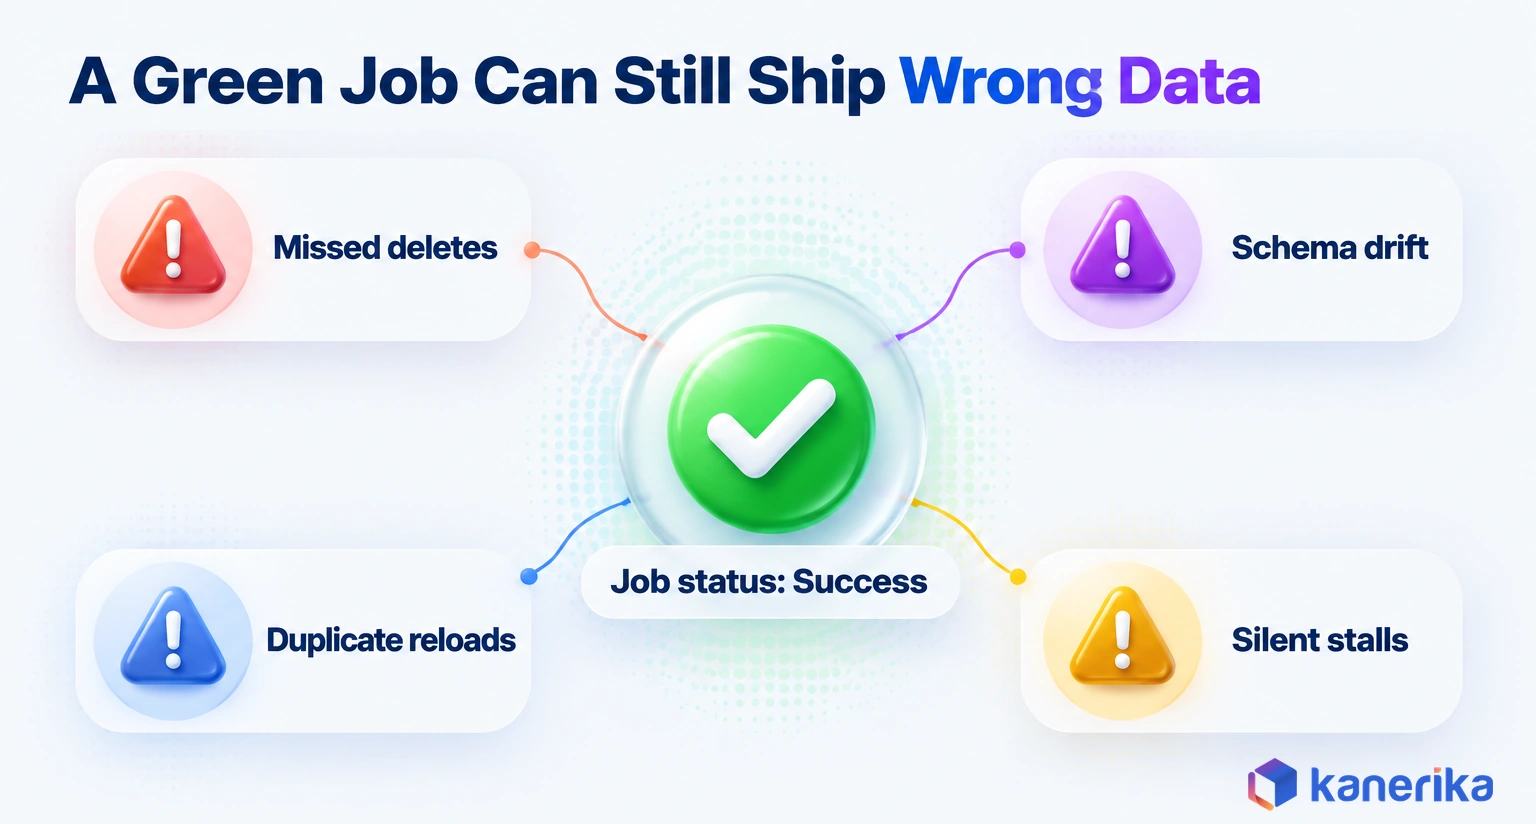
Schema drift deserves its own plan. Decide up front which changes the flow may absorb, such as a new nullable column. Then list the ones that must stop it, such as a dropped key or a changed data type, and test both lists before go-live.
Automated Data Integration Tools: Categories and Five Tests
Tools sort into five broad categories, and the category matters more than the brand. So pick the category that fits your sources and your team first, then compare vendors inside it.
| Category | What it does | Examples | Watch for |
|---|
| Managed ELT connectors | Pre-built connectors that land SaaS and database data in a warehouse | Fivetran, Qlik Talend Cloud | Usage pricing when change volumes are high |
| iPaaS | App-to-app workflows, API integration and API management | MuleSoft, Zapier | Built for app events rather than bulk analytics loads |
| Cloud platform services | Ingestion built into a data platform | Microsoft Fabric Copy job, Databricks Lakeflow Connect | Strongest when the data stays on that platform |
| Open source | Self-run connectors, CDC and orchestration | Airbyte, Debezium, Apache Airflow | You own hosting, upgrades and on-call |
| Streaming | Event transport for continuous data | Apache Kafka | Needs engineers who run streams in production |
As of October 2026, platform services cover much of this work. Microsoft’s Fabric Data Factory Copy job supports bulk copy, incremental copy and, in preview, CDC replication, without building pipelines. Our guide to Data Factory in Microsoft Fabric covers the wider service. Databricks Lakeflow Connect provides managed connectors that ingest SQL Server, MySQL and PostgreSQL through change data capture, with MySQL and PostgreSQL in preview. Unity Catalog governs those connectors, with an ingestion gateway on classic compute and the ingestion pipeline on serverless compute.
Open-source tools suit teams that run their own infrastructure. Apache Airflow 3 has been generally available since April 2025 and reached version 3.3.2 on September 17, 2026. It remains a common way to orchestrate flows built from open tools, and our data integration tools compared guide walks through each vendor.
Five Tests to Run Before You Choose a Platform
Demos show the happy path. These five tests show what happens on a bad day, and each fits into an afternoon on a trial account.
- Delete handling. Delete ten rows in the source, then confirm they disappear from the target on the next run.
- Schema change. Add one column and rename another, then check whether the flow adapts, pauses or breaks silently.
- Failed-run restart. Kill a load halfway and restart it. After that, row counts should match the source with no duplicates.
- Partial reload. Reload one table from scratch while the others and their downstream reports stay untouched.
- Cost at three times volume. Ask for the bill at three times today’s change volume rather than today’s.
A platform that passes all five on your own data is worth more than one with a longer connector list.
Where AI Helps in the Integration Layer
AI earns its place in two spots. The first is suggesting field mappings between a new source and your data model. The second is flagging unusual row counts or values that a fixed threshold would miss.
Neither replaces review. A suggested mapping that pairs “ship_date” with “order_date” looks plausible, yet it corrupts every lead-time report. A reviewer therefore checks sample rows, data types and units on both sides before approving any mapping.
Build, Buy, or Managed Service?
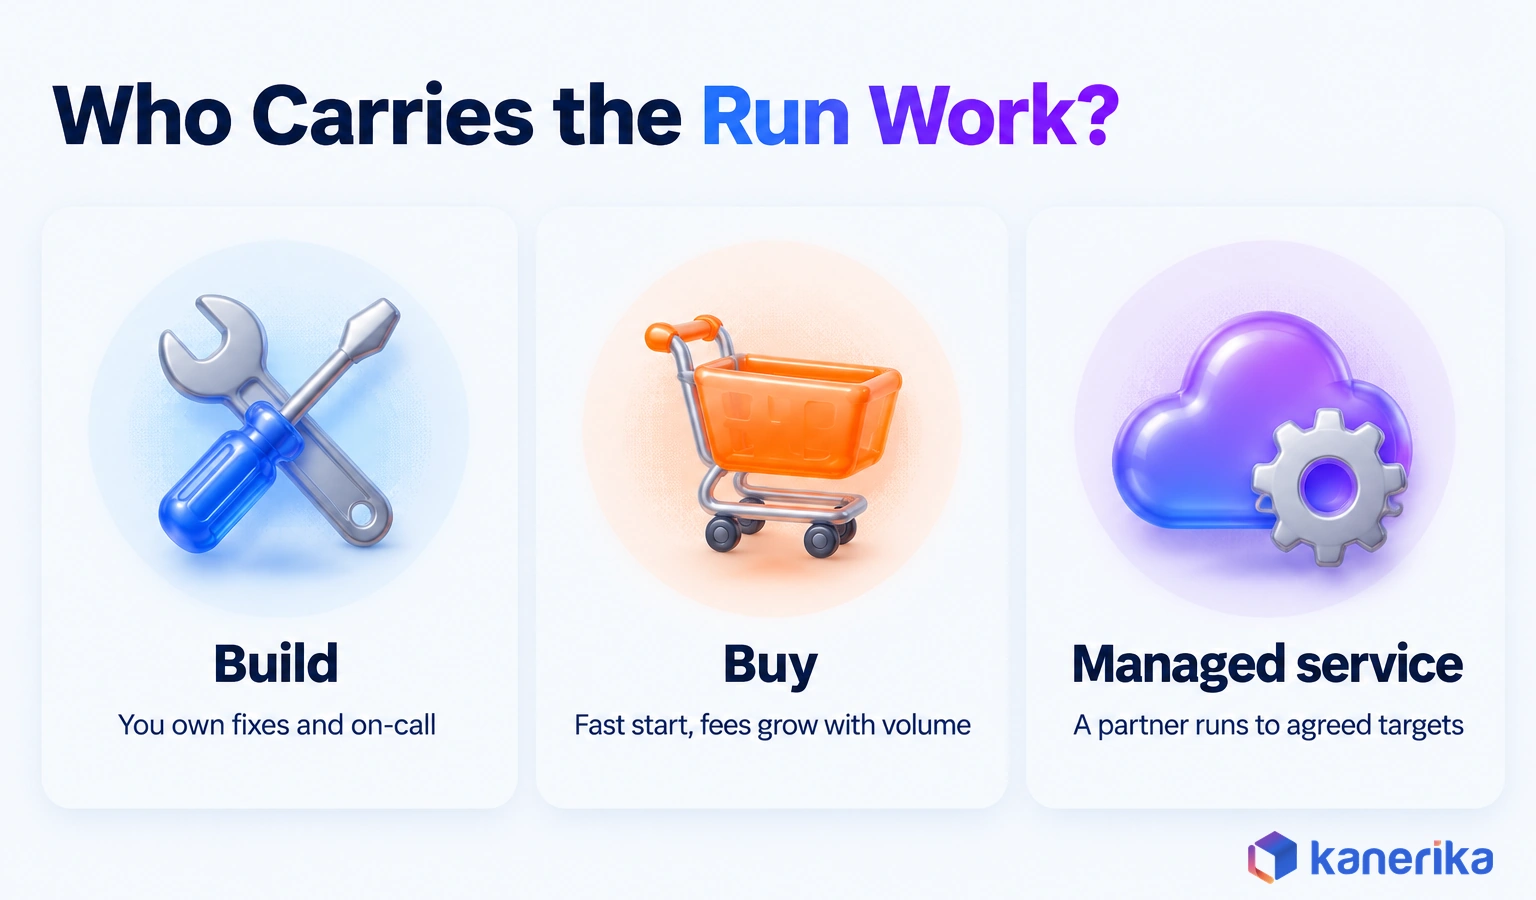
Once the pattern is clear, the next choice is who builds and runs the flows, and there are three honest options. The right one depends on how many sources you have and who will answer the alert at 3 a.m. Teams leaving a legacy ETL suite face the same question, which Informatica vs Databricks lays out.
| Option | Best when | Strengths | Trade-offs |
|---|
| Build in-house | When sources are unusual, control needs are strict and the data team is strong | Full control, with no per-row fees | You own every fix, upgrade and on-call shift |
| Buy a platform | When most sources are common SaaS apps and databases | Fast start, since connectors are maintained for you | Fees grow with volume, and edge cases are harder to control |
| Managed service | When the team is small, sources are many and targets are firm | A partner runs flows to agreed freshness and accuracy | Needs clear targets and access written into the contract |
Most enterprises end up with a mix. They buy connectors for the common sources and build for the one awkward legacy system. Then they hand monitoring to whoever can staff it around the clock.
What Drives Integration Cost
Cost comes from more than the license line. Seven drivers decide the total, but two of them usually dominate the bill: how much data changes each day and how fresh the target must be.
Compare two tables to see why. A 50 GB orders table where 2% of rows change each day moves about 1 GB of changes daily. A 5 GB pricing table rewritten every hour moves about 120 GB a day, so the smaller table costs far more to sync.
Tightening the freshness target multiplies that again. Refresh the pricing table every five minutes instead of hourly, and it moves twelve times as much data.
- Source count: the number of systems and tables in scope.
- Change volume: the rows that change each day, which matters more than table size.
- Freshness target: each step toward real time adds compute and care.
- Compute and storage: load and transformation work on the target platform.
- Licenses and usage fees: what the tools charge once you reach full volume.
- Engineering hours: the time to build, test and change flows.
- On-call and support: the people who answer alerts after go-live.
How to Estimate 12-Month Total Cost
A simple formula keeps the estimate honest. First, add tool fees at your expected change volume to platform compute for loads and transformations. Then add build hours times your loaded hourly rate, plus 12 months of run hours for monitoring, fixes and on-call.
A worked example in hours shows the method, with each assumption stated. Say analysts spend 6 hours a week on a manual export, or 312 hours a year. Building the automated flow takes 80 engineering hours, and running it takes 4 hours a month, or 48 a year.
The flow then saves a net 22 hours a month, which is 26 manual hours minus 4 run hours. At that rate the 80 build hours pay back in under four months, and the team keeps 184 hours in year one (312 minus 80 minus 48) before tool fees.
Price those hours at your loaded rate and set them against the tool fees at your change volume. When the fees outweigh the hours, start with a cheaper pattern or a higher-volume flow.
Run the same sum at three times today’s volume. If the total jumps far more than the volume does, the pricing model will hurt as you grow.
Finally, compare the 12-month figure with the manual hours the flow removes, measured before you started. That comparison tells you whether the project pays back.
How to Build Automated Data Integration Step by Step
A good build proves one flow end to end before it scales. It draws on core data engineering skills, from modeling keys to writing merges. These seven steps then take a team from a list of sources to a repeatable template.
- Define freshness and owners. For each dataset, write down how fresh it must be and who answers its alerts.
- Inventory sources and keys. List each source, its business keys and its change volume and whether it ever deletes rows.
- Pick a pattern per source. Use the scenario table above, and default to the slowest pattern the decision tolerates.
- Build one flow. Choose a table that matters and has deletes, so the hard case gets tested first.
- Add validation and reconciliation. Compare row counts and totals with the source on every run, and quarantine bad rows. The data reconciliation guide compares manual and automated matching.
- Add monitoring, alerts and replay. Alert on freshness and counts rather than only on job failure, and make replay a single command.
- Roll out by template. Turn the proven flow into a template, so each new source is configuration rather than new code.
Production Acceptance Checklist
Do not call a flow live until it passes every item below. Each one maps to a failure from the table earlier in this guide.
- Deletes in the source appear as deletes in the target.
- A re-run of the same load leaves the target unchanged.
- A schema change triggers an alert and a defined response.
- Row counts and control totals reconcile with the source on every run.
- A freshness alert fires when a table stops updating.
- One table can reload while the others stay untouched.
- Credentials sit in a vault, and access follows least privilege.
- Every flow has a named owner and a written runbook.
Checklist
Data Integration Checklist
Work through Kanerika’s Data Integration Checklist before a new flow goes live, alongside the acceptance items above.
Get the Checklist →
Five Mistakes to Avoid
These five come up again and again in failed rollouts. Each one is cheap to avoid at design time, but costly to fix once it reaches production. The wider data integration best practices cover the rest.
- Trusting job status. A green run tells you the code finished rather than that the data is right.
- Using timestamps for everything. Watermarks miss deletes and any update that skips the timestamp.
- Buying real time by default. Streams cost more to run and reconcile, so save them for places where minutes matter.
- Skipping the owner. When a flow has no named owner, whoever notices first fixes it, usually too late.
- Scaling before the template works. Ten copies of a flawed flow mean ten times the cleanup.
How to Measure Whether It Works
Good metrics describe the data itself. A dashboard that counts jobs run says nothing about whether finance can trust Tuesday’s numbers.
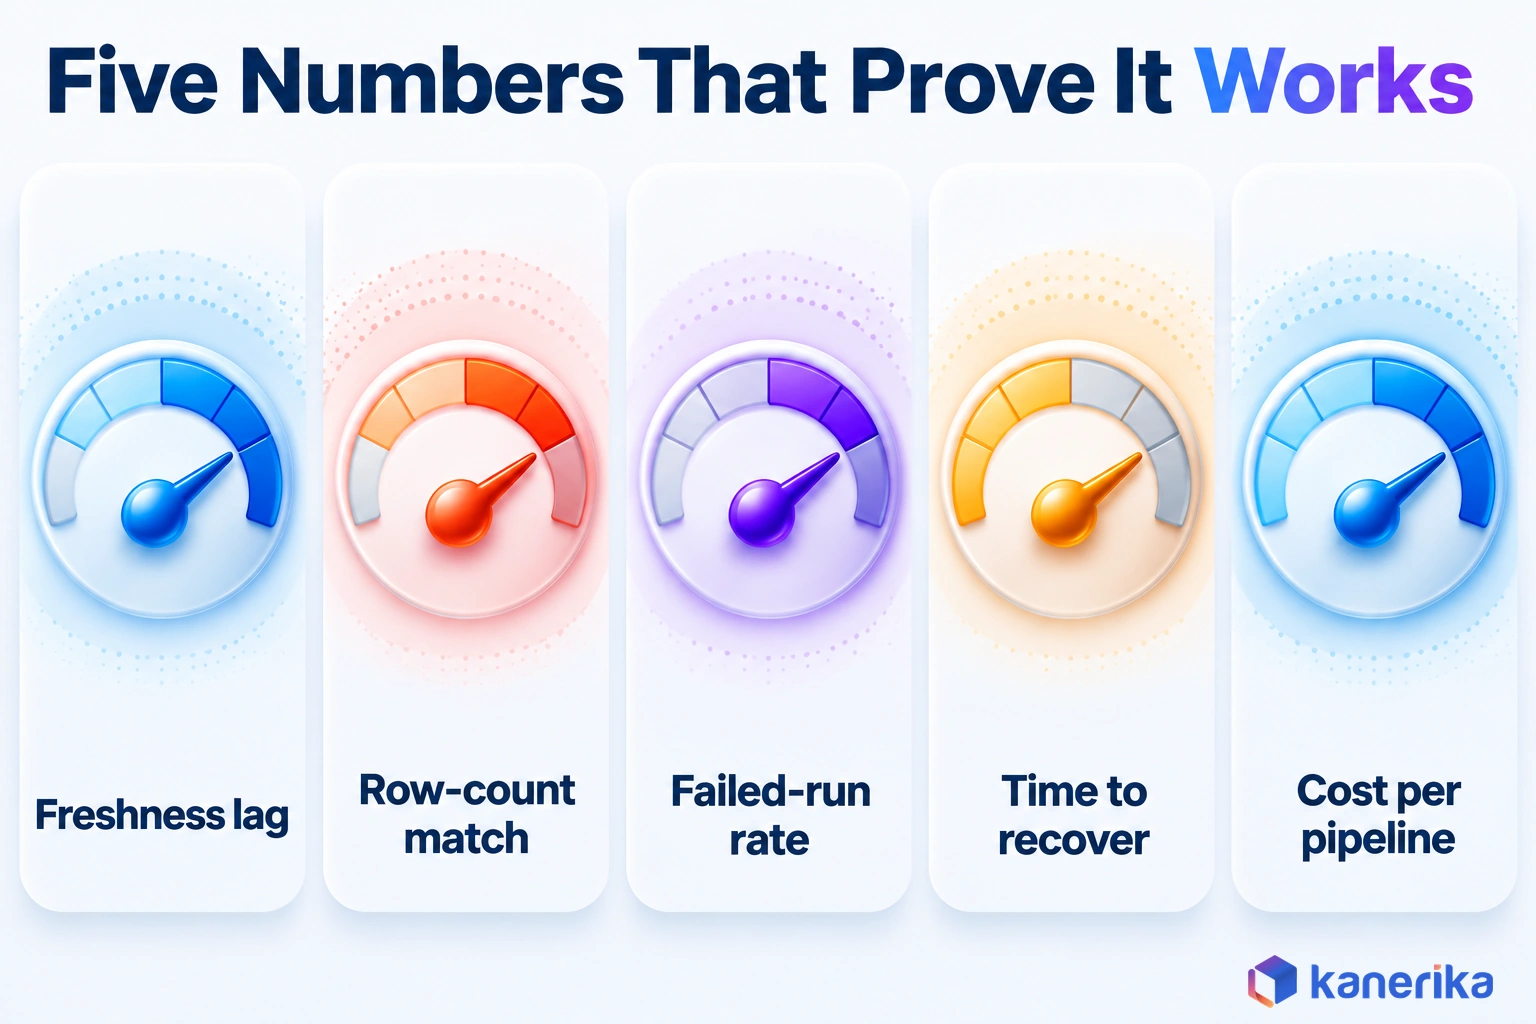
Six metrics cover most needs. Set a target for each before go-live, so you can tell later whether automation paid off.
| Metric | What it shows | Example target |
|---|
| Freshness lag | Time between a source change and its arrival in the target | Inside the agreed window for each table |
| Row-count reconciliation | Whether source and target agree | Zero unexplained gaps per run |
| Failed-run rate | Share of runs that fail or need a retry | Falling month over month |
| Mean time to recover | How fast a failure is fixed or replayed | Under one business hour for critical flows |
| Cost per pipeline | Monthly spend per flow | Stable even as volume grows |
| Manual hours saved | Prep time removed from analysts and engineers | Measured against the baseline you took before go-live |
Review these numbers monthly with the data owners. When a flow misses its freshness target twice a month, it needs a fix, a new pattern or a looser target agreed with the business.
Automated Data Integration Use Cases
The same five stages show up in very different settings. The scenario table above already pairs each case with a pattern. What it leaves out is the outcome worth tracking, which is the number that shows the flow fixed a business problem.
Finance close. The flow pulls the ERP general ledger, bank files and billing data into one reconciled view. Track days to close and the reconciliation breaks found each period. If breaks fall but close days do not, the delay probably sits outside the data flow.
Supply chain inventory. Warehouse, ERP and carrier feeds meet in the stock figure customers see. Track stock accuracy and oversold orders, since an oversold order is the price of the missed-delete fault from the opening story. Count both for a month before go-live, so any drop afterward is measured rather than assumed.
Multi-site manufacturing. Each plant often runs its own ERP instance, so group reports wait for the slowest site. Track report lag across sites, and name the slowest plant in the monthly review.
Customer 360 and healthcare scheduling. A customer view joins CRM, support desk, billing and web events, so duplicate customers and match rate show whether records truly line up. Scheduling flows join the scheduling system, EHR and call center, where open-slot and no-show accuracy show whether cancellations arrive in time.
Reporting is often the first flow to automate, because a wrong number is easy to see. In supply chains, that work often pairs with intelligent automation in the supply chain.
How Kanerika Automates Data Integration
Kanerika builds and runs automated integration flows for enterprises on Microsoft Fabric, Databricks and other platforms. That work runs through its data integration services, together with its data engineering services. Freshness targets and owners come first, then a pattern per source, then tests for deletes, reloads and schema change before go-live.
One engagement shows the manual-to-automated shift clearly. An edible oil manufacturer and distributor with nationwide reach ran SAP for major transactions, alongside non-SAP systems across many plants. Because financial and HR data were synchronized by hand, insights arrived late and carried errors.
Kanerika consolidated the SAP and non-SAP sources and then automated the integration steps people had been running manually. The published case study reports 60% less data integration time. It also reports a 30% increase in productivity and a 20% improvement in business performance.
For pipeline work at scale, Kanerika’s FLIP platform also includes a DataOps use case for automating data pipelines. Teams that want a structured start can begin with the acceptance checklist above and one flow that matters.
Kanerika Service
Data Integration Services
Kanerika designs, builds and runs automated data integration on Microsoft Fabric, Databricks and other platforms, with freshness targets, reconciliation and monitoring built into every flow.
Explore Data Integration Services
Where to Start: The Short Answer
Building automated data integration right is less about the tool than about proving one flow. Pick a table that matters and has deletes. Then set its freshness target, its owner and its reconciliation rule.
Next, run the five tests: delete handling, schema change, failed-run restart, partial reload and cost at three times volume. Once the flow passes, turn it into a template and add the next source as configuration.
That is how to build automated data integration right: choose the slowest pattern that works, catch every delete, and make the data prove itself.
Frequently Asked Questions
What is automated data integration?
Automated data integration is the practice of moving, matching and reconciling data between systems without anyone running the steps by hand. Jobs start on a schedule or when a source changes. Software then detects changed and deleted records, validates them, loads them safely and alerts an owner when something fails, so reports and AI agents read current data.
How does automated data integration work?
It runs in five stages. A flow connects to the source, detects new, changed and deleted records, then maps and validates them. It loads the data idempotently, so a re-run never duplicates rows. Finally it monitors freshness and row counts, alerts an owner when a threshold breaks and can replay a window of data after a failure.
What are the best automated data integration tools in 2026?
The best tool depends on your sources and platform. Managed connector services suit common SaaS sources, while iPaaS suits app-to-app workflows. Platform services such as Microsoft Fabric Copy job and Databricks Lakeflow Connect suit teams already on those platforms. Open-source options include Airbyte, Debezium and Apache Airflow. Test any shortlist on deletes, schema change and restarts.
Can data integration be fully automated?
The running of flows can be fully automated, including extraction, change detection, loading, alerts, retries and replay. Some decisions should stay human, such as approving new field mappings, agreeing freshness targets and choosing how to handle a breaking schema change. Well-built flows run unattended day to day and call a named owner only when a defined check fails.
How much does automated data integration cost?
Cost depends on source count, daily change volume, freshness targets, platform compute, tool fees, engineering hours and on-call time. Estimate twelve months by adding tool fees, compute and build hours to the ongoing run effort. Then repeat the sum at three times today’s volume, because usage-based pricing can rise faster than the data itself does.
What is the difference between batch and real-time data integration?
Batch integration moves data on a schedule, such as nightly or hourly, and suits reports that people read once a day. Real-time integration moves each change within seconds or minutes, using CDC, mirroring or streaming. Real time costs more to run and reconcile, so use it only where a delay changes an outcome, such as stock or fraud checks.
How does CDC work in automated data integration?
Change data capture reads changes as they happen instead of re-reading whole tables. Log-based CDC reads the database transaction log, so it sees inserts, updates and deletes and needs no last-updated column. The flow then applies each change to the target with a keyed merge. CDC needs log access, the right permissions and a log retention plan.
How do you handle schema changes in automated pipelines?
Decide in advance which changes a flow may absorb and which must stop it. A new nullable column can usually pass through, while a dropped key or a changed data type should pause the load and alert the owner. Check the schema on every run, keep mappings under version control, and test both cases before go-live.
How do you keep automated integration accurate and monitored?
Put checks on the data itself. Reconcile row counts and control totals with the source on every run, set a freshness alert for each table, and send rejected rows to a quarantine table with a reason. Track the failed-run rate and mean time to recover every month, and give each flow a named owner and runbook.
What are the biggest risks of automated data integration?
The biggest risks are silent ones. Missed deletes, duplicates after a retry, schema drift and stalled flows can all pass with a green job status. Others include API rate limits, late-arriving data and credentials stored inside jobs. Each has a known control, such as CDC, keyed merges, schema checks, freshness alerts and a secrets vault.
Is Microsoft Fabric suitable for automated data integration?
Yes, for teams building analytics on Fabric. Its Data Factory Copy job supports bulk copy, incremental copy and, in preview, CDC replication, without building pipelines. Open mirroring lets applications write change data, including deletes, directly into a mirrored database. Fabric fits best when the data will be analyzed there, and other sources can still feed it through connectors.
How long does it take to implement automated data integration?
The timeline depends on source count, change patterns, data quality and how quickly teams grant access. Plan to prove one production flow first, with validation, monitoring and the five failure tests, before scaling. Once that flow becomes a template, each further source mostly needs configuration and testing, so later sources move much faster than the first.
How do you automate data integration between two systems?
Start by naming the business keys in both systems and how fresh the target must be. Choose a change pattern such as CDC or a scheduled incremental load. Build one flow with validation, a merge on the keys and row-count reconciliation. Add freshness alerts and a replay command, test deletes and restarts, then schedule it to run unattended.
What is the difference between ETL and automated data integration, and will it replace ETL?
ETL is a method for extracting, transforming and loading data. Automated data integration is the wider practice of keeping systems in agreement without manual work, and ETL or ELT often runs inside it. It will not replace ETL. It changes who runs and checks the jobs, adding change detection, reconciliation, alerts and recovery around the transformation logic.
What is AI data integration?
AI data integration uses machine learning inside the integration layer. The most common uses are suggesting field mappings for a new source and flagging unusual row counts or values that fixed rules would miss. The term also covers feeding AI agents with current, connected data. In both cases a person should still approve mappings before they reach production.
What are the types of data integration?
The main types are scheduled batch loads, watermark-based incremental loads, log-based change data capture, mirroring, streaming and data virtualization. At the system level, teams also separate app-to-app integration through APIs from analytics integration into a warehouse or lakehouse. Most enterprises use several types at once, choosing each one by how fresh the data must be.
What is the difference between data integration and automation?
Data integration is the outcome, systems that hold consistent and connected data. Automation is the method, software that runs the steps without people. You can integrate data manually with exports and spreadsheets, and you can automate tasks that have nothing to do with data. Automated data integration combines the two, so data stays consistent without hand-run jobs.
What is an example of automated data integration?
A distributor’s warehouse system writes off damaged stock. Log-based CDC picks up the delete within minutes, and the flow validates it, merges it into the analytics copy and updates the inventory report. If the row counts disagree with the source, an alert reaches the data owner. Nobody exports a file or edits a spreadsheet at any point.
What is the difference between API integration and data integration?
API integration connects applications so one can call another in real time, for example creating an invoice when an order closes. Data integration moves and reconciles data sets for reporting, analytics and AI. APIs are often one of the sources a data integration flow reads, but bulk loads, CDC and reconciliation sit outside what API integration alone covers.
What is automated data management?
Automated data management applies the same idea to the whole data lifecycle. Beyond integration, it covers automated data quality checks, metadata and lineage capture, access policies, retention and archiving. Automated data integration is usually the first piece, because every later step depends on data arriving complete, current and reconciled with its source systems.