On September 30, 2025, Walmart’s CEO, Doug McMillon, said that AI will “change literally every job” in retail. The company is already using AI tools to train staff, optimize inventory, and improve customer service. From voice assistants like Ask Sam to automated fulfillment bots like Alphabot, Walmart is embedding business intelligence into daily operations. Retail business intelligence goes beyond technology upgrades—it leverages data to transform operations, from store floors to supply chain management.
Retail BI tools are expected to reach $7.7 billion by 2029, with predictive analytics and cloud-based platforms leading the way. Nearly 70% of retailers now rely on BI tools for tasks like demand forecasting, customer segmentation, and pricing optimization. From inventory forecasting to dynamic pricing, BI tools are helping retailers reduce waste, improve margins, and personalize customer experiences.
In this blog, we’ll break down how retail business intelligence works, the leading tools in the market, and how companies are utilizing data to stay competitive. Continue reading to explore real-world use cases, trends, and tips for choosing the right BI solution.
Key Takeaways
- Retail BI helps optimize inventory, forecast demand, and personalize customer experiences using real-time data.
- Key metrics include sales per store, customer lifetime value, inventory turnover, and average transaction value.
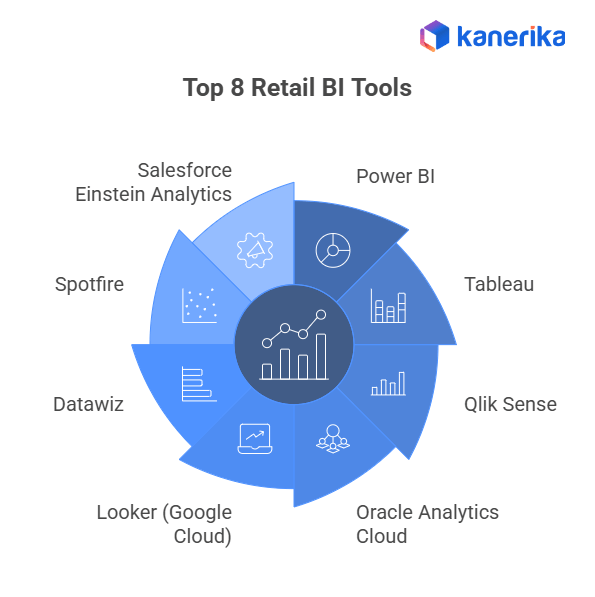
- Top tools for analytics and reporting include Power BI, Tableau, Qlik, Looker, and Salesforce Einstein.
- Use cases span pricing optimization, loyalty programs, fraud detection, supply chain management, and marketing insights.
- Major benefits are faster decisions, reduced costs, higher profitability, and stronger customer retention.
Experience The Future Of Business Intelligence With AI Insights
Partner with Kanerika for Expert AI implementation Services
What is Retail Business Intelligence
Retail business intelligence (BI) is the process of collecting, integrating, and analyzing retail data to make better decisions. It helps retailers understand customer behavior, track sales trends, manage inventory, and improve store performance.
BI pulls data from multiple sources — point-of-sale systems, e-commerce platforms, CRM tools, inventory software, and even foot traffic sensors. This data is then cleaned, merged, and visualized using dashboards and reports.
Retailers use BI to:
- Spot which products are selling fast or lagging
- Adjust pricing based on demand and competitor activity
- Personalize offers using customer purchase history
- Forecast demand and avoid stockouts
- Monitor store layout effectiveness using heatmaps and sensors
BI replaces guesswork with facts. Instead of reacting late, retailers can act early — restocking trending items, launching targeted promotions, or adjusting staffing based on foot traffic. For example, analyzing seasonal sales data allows stores to stock high-demand products in advance, while customer segmentation helps in delivering personalized offers. Retail BI transforms raw data into actionable insights, enabling retailers to stay competitive in a fast-changing market.
Key Components of Retail Business Intelligence
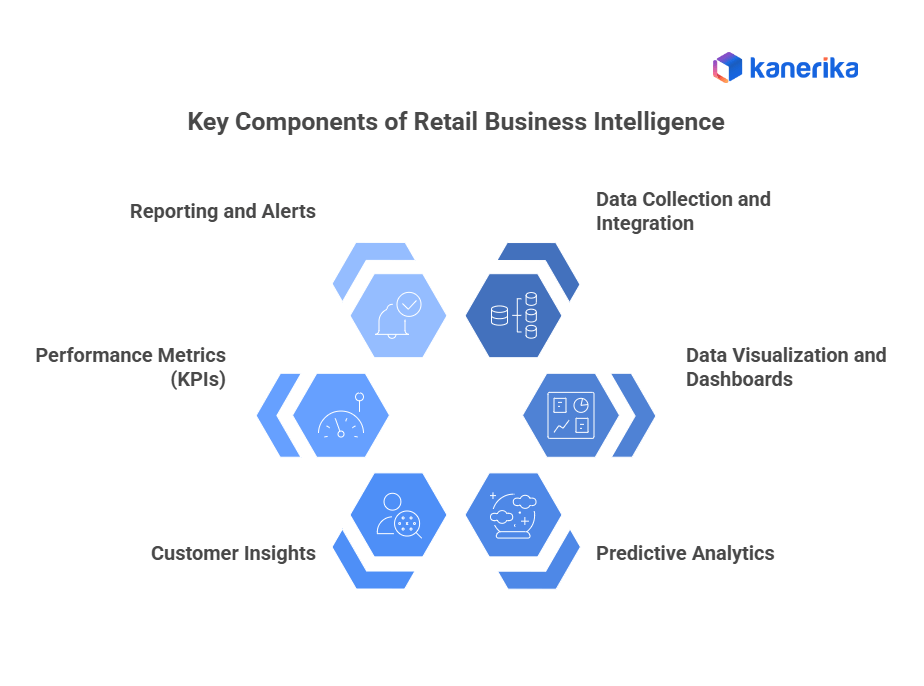
Retail BI systems rely on several core components that work together to deliver insights:
- Data Collection and Integration – Gathering data from POS systems, ERP, CRM, online platforms, and social media, then integrating it into a central data warehouse.
- Data Visualization and Dashboards – Interactive dashboards (using tools like Power BI or Tableau) present sales trends, customer demographics, and inventory status in real time.
- Predictive Analytics – Using historical data and machine learning models to forecast demand, identify cross-selling opportunities, and reduce stockouts.
- Customer Insights – Tracking behavior such as purchase frequency, average spend, and preferences to design targeted promotions.
- Performance Metrics (KPIs) – Monitoring sales per store, customer retention rates, inventory turnover, and profit margins.
- Reporting and Alerts – Automated reports and alerts help managers respond quickly to sales drops, supply chain disruptions, or fraud risks.
What Are the Key Metrics in Retail BI?
1. Sales per Category/Store
This metric indicates which product categories or store locations generate the most revenue. It helps retailers understand customer preferences across regions or formats. If one category consistently performs well, it may deserve more shelf space or marketing. If a store underperforms, it may need layout changes, staff training, or local promotions.
2. Average Transaction Value (ATV)
ATV is calculated by dividing total revenue by the number of transactions. It shows the average amount customers spend per visit. A rising ATV often means successful upselling or bundling. If ATV drops, it may signal pricing issues or a weak product mix. Retailers use this to test promotions and adjust product placement.
3. Customer Lifetime Value (CLV)
CLV estimates the revenue a customer will generate throughout their entire relationship with the brand. It’s key for loyalty programs, retention strategies, and marketing spend. A high CLV indicates that customers are engaged and likely to return. Retailers use this to segment audiences and prioritize high-value customers.
4. Gross Margin Return on Investment (GMROI)
GMROI measures the profit earned for every rupee spent on inventory. It combines margin and turnover to show inventory efficiency. A high GMROI indicates that the retailer is making informed purchasing decisions. A low GMROI may mean overstocking or poor pricing. It helps retailers decide which products to keep, discount, or drop.
5. Inventory Turnover Ratio
This tracks how often inventory is sold and replaced. It’s a sign of how well the stock is managed. High turnover means products are moving fast, reducing holding costs. Low turnover may lead to dead stock and wasted space. Retailers use this to adjust order quantities and improve demand forecasting.
6. Basket Analysis
Basket analysis examines which products are frequently purchased together. It helps retailers understand buying patterns and create bundles or cross-promotions to enhance customer experiences. For example, if customers often buy chips with soda, placing them near each other can boost sales. It also helps with store layout and personalized recommendations.
7. Customer Retention Rate
This metric shows the percentage of customers who return after their first purchase. High retention indicates strong loyalty and a positive customer experience. Low retention may indicate poor service, subpar product quality, or a lack of engagement. Retailers use this to improve post-purchase communication and loyalty programs.
8. Sell-Through Rate
The sell-through rate measures the percentage of available stock that is sold within a specified time period. It helps retailers track product performance and adjust inventory levels. A low rate may mean overstocking or poor demand. A high rate may signal understocking or missed sales. It’s useful for seasonal planning and product launches.
Top 10 Business Intelligence Tools: Features, Benefits & How to Choose
Explore top business intelligence tools, their features, and benefits for smarter decision-making.
What Are the Best Retail BI Tools?
1. Power BI
Microsoft’s BI platform is widely used in retail for its tight integration with Excel, Azure, and other Microsoft tools. It supports real-time dashboards, custom reports, and strong data modeling.
Retailers use Power BI to track sales trends, monitor inventory, and visualize store performance. It’s ideal for businesses already using Microsoft 365, and it scales well from small chains to large enterprises.
Best for: Real-time reporting, Excel users, Microsoft ecosystem
Strengths: Affordable, easy to learn, strong community support
2. Tableau
Tableau is known for its drag-and-drop interface and rich visualizations. It helps retail teams explore data without requiring coding.
Retailers use Tableau to analyze customer behavior, compare store performance, and build interactive dashboards for marketing and operations teams. It’s especially useful for visual storytelling and executive reporting.
Best for: Visual analytics, non-technical users
Strengths: High-quality visuals, flexible dashboard creation, strong data blending
3. Qlik Sense
Qlik uses associative data modeling, which lets users explore relationships between data points intuitively. It’s fast, flexible, and supports self-service analytics.
Retailers use Qlik to analyze multi-source data — POS, CRM, inventory — and uncover hidden patterns. It’s ideal for teams that require in-depth control over data exploration.
Best for: Complex data relationships, self-service BI
Strengths: Fast performance, strong data discovery, scalable architecture
4. Oracle Analytics Cloud
Oracle’s BI suite is built for enterprise-scale operations. It includes predictive analytics, machine learning, and natural language queries.
Retailers with large footprints use it to forecast demand, optimize supply chains, and manage multi-brand portfolios. It’s suited for businesses with deep reporting needs and multiple business units.
Best for: Large retailers, predictive analytics
Strengths: Enterprise-grade security, AI-powered insights, strong integration with Oracle ERP
5. Looker (Google Cloud)
Looker is a modern BI tool built for cloud scalability and customization. It integrates well with Google Ads, BigQuery, and other cloud services.
Retailers use Looker to track customer journeys, campaign performance, and product-level analytics. It’s ideal for digital-first brands and e-commerce platforms.
Best for: Cloud-native retailers, marketing analytics
Strengths: Customizable data models, strong API support, real-time data access
6. Datawiz
Datawiz is built specifically for retail analytics. It offers tools for promotion tracking, shelf management, and customer behavior analysis.
Mid-sized retailers use it to monitor store KPIs, optimize product placement, and improve campaign ROI. It’s a plug-and-play solution with retail-focused dashboards.
Best for: Mid-sized retailers, shelf and promo analytics
Strengths: Retail-specific features, fast setup, intuitive interface
7. Spotfire
Spotfire excels in geospatial analysis and advanced modeling. It’s used by retailers with multiple locations to analyze regional trends and optimize store placement.
It supports real-time data streams and complex visualizations, making it useful for logistics, supply chain, and location planning.
Best for: Multi-location analysis, advanced modeling
Strengths: Strong mapping tools, real-time analytics, deep statistical capabilities
8. Salesforce Einstein Analytics
Einstein Analytics is part of the Salesforce ecosystem. It’s designed for CRM-driven insights, helping retailers track customer journeys, loyalty, and engagement.
Retailers use it to personalize offers, measure campaign impact, and improve retention. It’s best for businesses already using Salesforce for customer management.
Best for: CRM insights, customer engagement
Strengths: AI-powered recommendations, seamless Salesforce integration, mobile-friendly dashboards
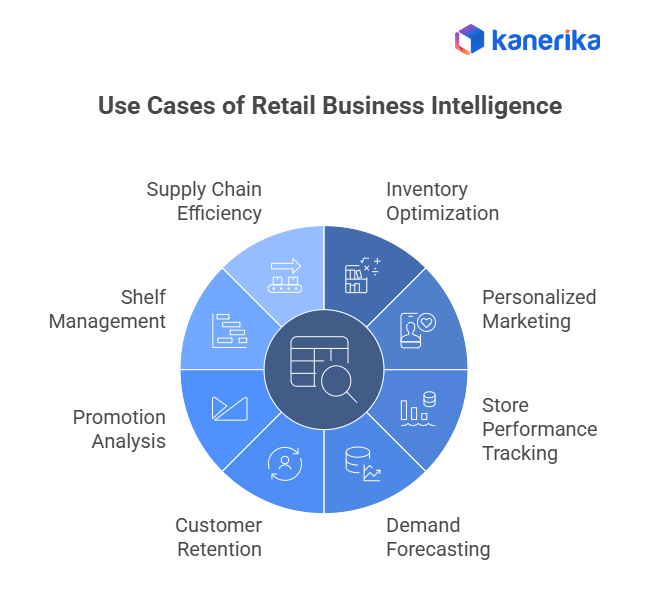
Use Cases of Retail Business Intelligence
1. Inventory Optimization
Retailers rely on data to manage stock levels, reduce waste, and improve product availability. Predictive models help forecast demand, automate restocking, and balance inventory across locations.
Example: Walmart’s Self-Healing Inventory system in Mexico City automatically reroutes excess stock to stores with higher demand. This system helped reduce waste by over $55 million.
2. Personalized Marketing
Customer segmentation and behavioral analysis allow retailers to tailor promotions, product recommendations, and communication. This improves engagement and increases repeat purchases.
Example: Sephora upgraded its digital architecture with commercetools to deliver real-time personalized experiences across channels. This supports targeted campaigns and loyalty engagement.
3. Store Performance Tracking
Retailers monitor key metrics, such as foot traffic, conversion rates, and revenue per store, to identify underperforming locations and adjust their operations accordingly.
Example: Target implemented predictive modeling to reduce inventory-not-found (INF) rates and improve fulfillment accuracy. This helped streamline store operations and improve customer satisfaction.
4. Demand Forecasting
Sales history, social trends, and regional data help retailers predict future demand and plan inventory, staffing, and production accordingly.
Example: Zara’s agile supply chain enables it to design, produce, and deliver new fashion items in just 15 days, compared to the industry average of 6 months. This speed is driven by real-time demand tracking.
5. Customer Retention
Retailers analyze customer behavior to improve loyalty programs, personalize offers, and increase repeat visits.
Example: Starbucks rolled out AI-powered inventory counting across stores, increasing check frequency eightfold. This reduced stockouts and improved customer experience.
6. Promotion Analysis
Campaign performance is tracked to measure impact on sales, margins, and customer behavior. Retailers test different strategies and optimize timing.
Example: Best Buy’s “My Ads” platform gives brand partners real-time campaign data. This improvement in targeting and promotional ROI benefited participating vendors.
7. Shelf Management
Retailers analyze product movement and customer interaction to optimize shelf space and placement.
Example: Tesco adjusted shelf layouts in Slovakia based on insights into seasonal demand. Toy sales rose by over 50% after repositioning high-interest items.
8. Supply Chain Efficiency
Data helps retailers monitor supplier performance, delivery times, and logistics costs to streamline operations.
Example: Amazon’s supply chain service improved seller sales by an average of 20%, reduced stock requirements by 20%, and accelerated delivery times.
Benefits of Retail Business Intelligence
1. Faster Decision-Making: BI tools provide real-time insights. Retailers can respond quickly to trends, stock issues, or customer feedback. For example, if a product starts trending on social media, stores can increase stock before demand peaks.
2. Better Inventory Management: BI helps balance stock levels, reduce waste, and avoid stockouts. Retailers can track slow-moving items and adjust their orders accordingly. This reduces holding costs and improves cash flow.
3. Improved Customer Experience: Retailers use BI to personalize offers, improve service, and build loyalty. For example, sending birthday discounts or recommending products based on past purchases.
4. Increased Profitability: By optimizing pricing, promotions, and product mix, BI helps boost margins. Retailers can identify high-margin products and focus their marketing efforts on these products.
5. Smarter Marketing: BI tracks campaign performance and customer response. Retailers can test different messages, channels, and timing to improve ROI. For example, email campaigns may be more effective for older customers, while younger ones tend to respond better to Instagram ads.
6. Operational Efficiency: BI highlights bottlenecks and inefficiencies. Retailers can streamline processes across stores, warehouses, and supply chains. For example, reducing delivery times or automating restocking.
7. Competitive Advantage: Retailers using BI can respond faster to market changes and customer needs. This helps them stay ahead of competitors who rely on manual reporting or gut instinct.
8. Unified View of Business: BI integrates data from POS, CRM, inventory, and marketing tools. Retailers get a full picture of their operations in one place, making it easier to align teams and strategies.
Predictive Analytics in Retail: 10 Real-World Use Cases You Need to know
Discover 10 real-world use cases of predictive analytics in retail to enhance customer experience.
Case Study: Retail Inventory and Demand Optimization for a Fuel Distribution Company
A leading fuel distribution company faced challenges with fragmented inventory data, delayed stock updates, and inefficient demand forecasting. These issues resulted in frequent stockouts in high-demand areas and overstocking in low-demand zones, leading to increased operational costs and customer dissatisfaction.
Kanerika’s Solution
Kanerika implemented a real-time analytics platform that unified inventory, sales, and logistics data. Using AI-driven forecasting models, the system predicted demand spikes based on historical usage patterns, weather conditions, and regional consumption trends. Moreover, the solution also automated stock replenishment workflows and provided live dashboards for supply chain teams.
Impact
- Reduced stockouts by 30% in high-demand zones
- Improved inventory turnover by 22%
- Cut manual reporting time by 40%
- Enabled real-time visibility across 100+ distribution points
This transformation helped the client shift from reactive inventory management to proactive, data-driven decision-making.
Transforming Retail with Kanerika’s Business Intelligence Framework
At Kanerika, we help businesses turn scattered data into clear, actionable insights. Our business intelligence services cover the full stack — from data integration and governance to real-time dashboards and advanced analytics. We work across various platforms, including Power BI, Microsoft Fabric, and Databricks, and every solution is tailored to meet your specific goals. Whether you’re trying to improve reporting, cut down manual work, or speed up decision-making, we focus on results that actually move the business forward. Our BI adoption framework follows a phased, low-risk approach that matches your data maturity.
We begin by assessing your current systems and business needs, then proceed to design, implementation, and optimization. This method has helped clients across industries improve reporting speed, reduce effort, and gain better visibility. We bring deep technical skills and industry knowledge across healthcare, logistics, finance, and manufacturing. Our team comprises certified experts who possess a deep understanding of both the tools and the business context. Every solution is built with strong data governance to ensure accuracy, compliance, and long-term value. If you’re ready to get more from your data, we’re prepared to help.
Transform Your Business with AI-Powered Solutions!
Partner with Kanerika for Expert AI implementation Services
FAQs
1. What is retail business intelligence?
Retail business intelligence uses data analytics and reporting tools to provide insights into sales, inventory, and customer behavior. It helps retailers make informed decisions by showing which products sell best, which locations perform well, and how trends affect demand, enabling smarter planning and improved customer experiences.
2. How does business intelligence help retailers?
Business intelligence turns raw data into actionable insights, helping retailers forecast demand, personalize offers, and optimize operations. By identifying inefficiencies in supply chains and store performance, BI reduces costs, improves productivity, and allows retailers to adapt quickly to changing market and customer needs.
3. What are the key metrics in retail BI?
Key metrics include sales per store or category, customer lifetime value (CLV), inventory turnover, and average transaction value (ATV). Tracking these helps retailers understand customer behavior, manage stock efficiently, and align business decisions with growth and profitability goals.
4. Which are the best retail BI tools?
The most popular retail BI tools include Power BI, Tableau, Qlik Sense, Looker, and Salesforce Einstein Analytics. These platforms help retailers visualize data, track sales trends, forecast demand, and personalize customer experiences. Choosing the right tool depends on business size, technical expertise, and specific analytics needs.
5. What are the benefits of retail business intelligence?
Retail business intelligence provides faster, data-driven decision-making, improved inventory management, and better customer engagement. It helps optimize pricing, marketing campaigns, and supply chains, ultimately boosting profitability and giving retailers a competitive edge in a fast-paced market.

