TL;DR
Decision intelligence designs and improves business decisions, using rules for stable logic and models for forecasts. It works as a seven-step loop: frame, gather data, model options, predict the impact, act, record the outcome and learn. Pick plain rules when the logic rarely changes and must be explained to an auditor. Pick predictive or optimization models when the choice depends on a forecast or many trade-offs. Keep a human sign-off for rare or regulated decisions, and automate only frequent, low-risk ones. Start with one owned, repeatable decision, then measure its speed, lift and override rate.
Key Takeaways
- Decision intelligence treats a business decision as something you design, run and improve, so data, models, rules and human judgment work together.
- It works as a seven-step loop, and the last two steps, capturing outcomes and then learning from them, are the ones teams skip.
- Rules, predictive models, optimization, simulation and human judgment each fit a different kind of decision, while one decision often uses several.
- BI stays the input layer: it reports what happened, while decision intelligence turns those facts into a repeatable choice and checks whether it worked.
- A 90-day pilot on one frequent, measurable decision with a named owner proves value faster than a platform-first program.
- Automated decisions need governance, such as an audit trail, override capture, explainable models and human oversight where GDPR and the EU AI Act apply.
Three Dashboards and No Answer by Friday
Picture a pricing manager at a fashion retailer on a Monday morning. She has a sales dashboard, a competitor price feed and a demand forecast. Her director wants one answer by Friday: should we cut the price on these slow-moving SKUs this week?
Each tool shows part of the picture. Sell-through has slowed on the dashboard, and the competitor feed shows a rival running a 15% promotion. Yet the forecast expects demand to recover after a holiday weekend. None of them says what to do, how much margin is at risk, or who decides when the numbers disagree.
So the call gets made the way it was made last quarter, in a meeting and from memory. Two weeks later nobody can say whether the price cut worked, because nobody wrote down what was expected.
That gap between insight and action is what decision intelligence closes. This guide explains what it is and how the decision loop works. It also covers which modeling methods fit which decisions, then walks through a worked example and shows how to measure and govern the results.
What Is Decision Intelligence?
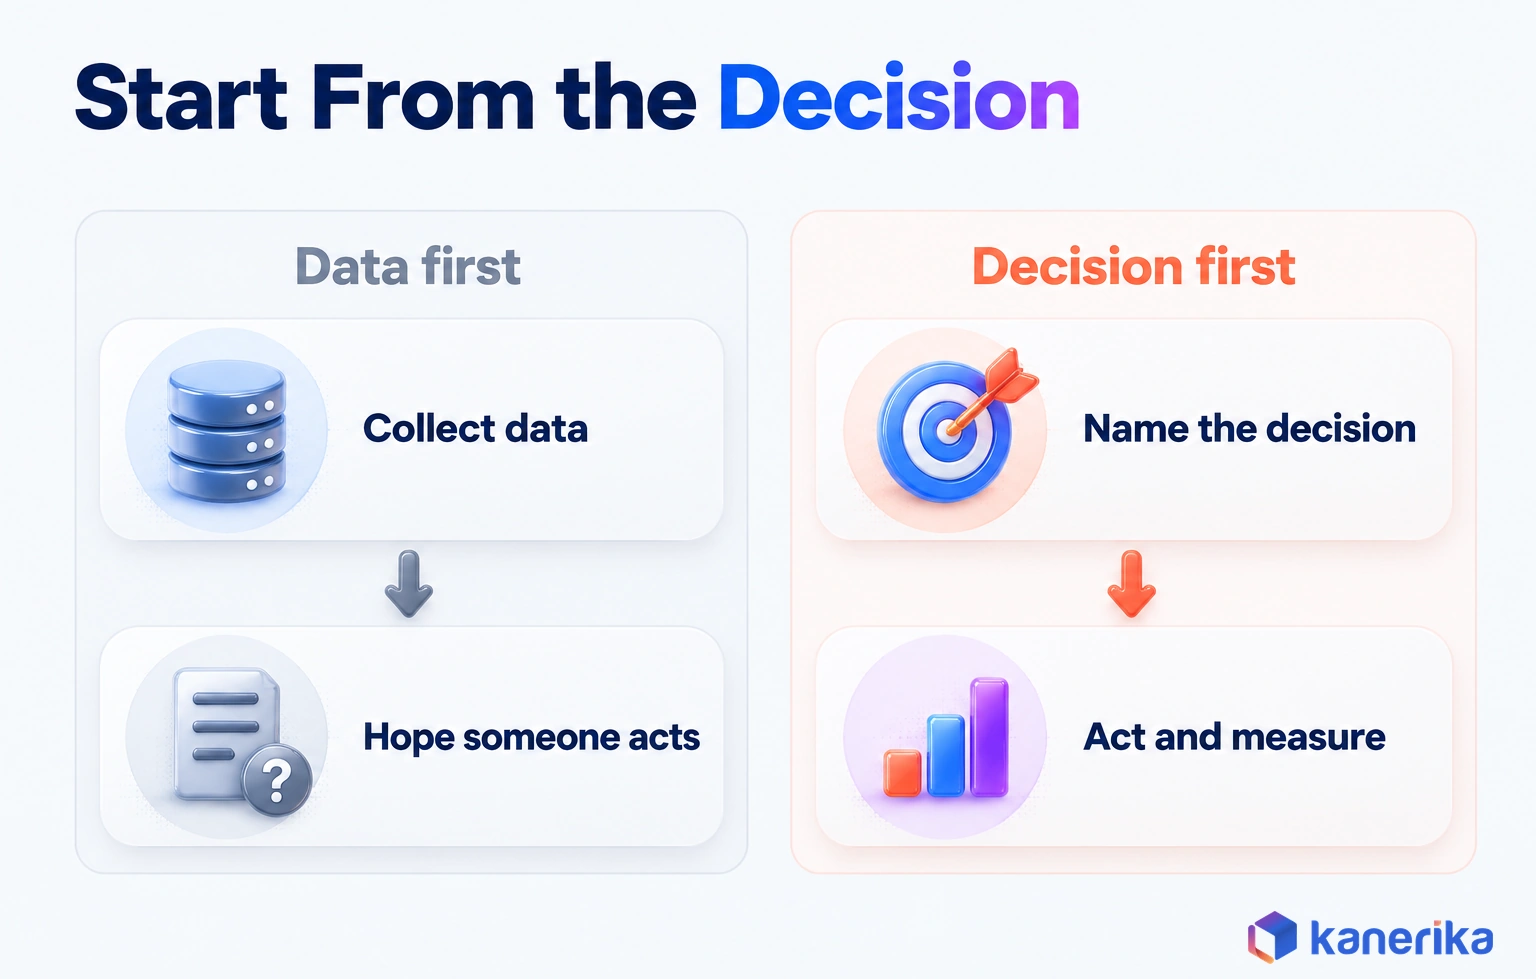
Decision intelligence (DI) is the practice of treating a business decision as something you design, run and improve. It combines data, models, business rules and human judgment around one specific choice. Typical examples are whether to approve a loan or how much stock to reorder.
Gartner describes DI as a practical discipline for engineering how decisions are made and improved. That word engineering matters, because it means the decision gets a written design, testable logic and a way to measure whether it worked. Otherwise the logic lives in someone’s head.
The real shift is in the unit of work. A reporting team ships dashboards and measures how often people open them. A DI team, by contrast, ships decisions and measures outcomes. It tracks how fast each decision was made, how often it was right, and what it earned or saved compared with the old way.
Take claims triage at an insurer. Without DI, adjusters receive a risk score and apply it with personal judgment. Two adjusters can then reach opposite answers on the same claim. With DI, the decision has a design that lists the inputs, thresholds, model, review cases and the outcome to track. Every adjuster works from the same logic, so the logic itself can be tested and improved.
Decision Support, Augmentation and Automation
How much a machine should decide depends on how often the decision happens, how much is at stake and how easily it can be reversed. DI usually describes three levels of machine involvement.
| Level | What the system does | Who signs off | Example |
|---|
| Decision support | Supplies data and forecasts, then leaves the choice to people | A person, once the analysis is ready | Planning capacity before each quarter |
| Decision augmentation | Recommends one option, then explains why | A person, who can also override it | Repricing slow sellers when sales stall |
| Decision automation | Decides and acts on its own, but only within set limits | The system acts, while a named owner sets the rules and reviews exceptions | Holding a card payment when it looks like fraud |
Augmentation is a sensible place to start, because a person stays accountable while the model earns trust. Our guide to augmented intelligence covers that human-in-the-loop model in more depth.
Case Study
30% Faster Decision-Making in Insurance Claims
Kanerika combined generative AI with better data integration for an insurance client, cutting claim processing time by 37% and making decisions 30% faster.
Read the Case Study →
Why Decision Intelligence Matters Now
For a large enterprise, the hard part is turning a forecast into a timely, consistent action that someone owns and can explain later.
Three problems show up again and again. Decisions are slow, since they wait for a meeting or a sign-off chain. They are inconsistent when two regional managers facing the same facts make different calls. They are also hard to audit, because the reasoning lives in email threads and memory rather than in a system.
DI addresses all three by writing the decision down and running it the same way every time. That fixes speed, since routine calls move from a weekly meeting to a same-day recommendation. It fixes consistency too, because similar cases get similar answers whoever handles them.
The audit problem eases as well. Each decision carries a record of inputs, logic, owner and result, so an auditor can trace any decision without rebuilding it from email threads. Those recorded outcomes then feed back into the rules and models, so the next decision improves.
A Buying Category Since January 2026
The market has noticed. Gartner published its first Magic Quadrant for Decision Intelligence Platforms in January 2026. That report turned DI from an analyst idea into a category that buyers compare and budget for.
For a buyer, the useful signal is the category itself rather than any vendor ranking. A DI platform should be judged on how it models a decision, connects to the systems where action happens and records outcomes. How well it displays data is the smaller question.
AI Agents Raise the Stakes
An AI agent does more than recommend. It can open a ticket, change a price or release a payment on its own. Once software acts, the decision behind the action needs what a human decision-maker would need: a clear brief, limits, an owner and a record.
That is why DI and agentic AI fit together so well. The decision model defines what the agent may decide, while the guardrails define what it may not. After that, the outcome log shows whether its choices worked. Without that design, an agent simply automates guesswork faster.
Watch on YouTube
How Enterprise AI Agents Are Designed for Real Business Decisions
Kanerika’s view on designing enterprise AI agents around real business decisions. Watch it alongside this section on giving every automated decision a design, limits and an owner.
How Decision Intelligence Works: The Decision Loop
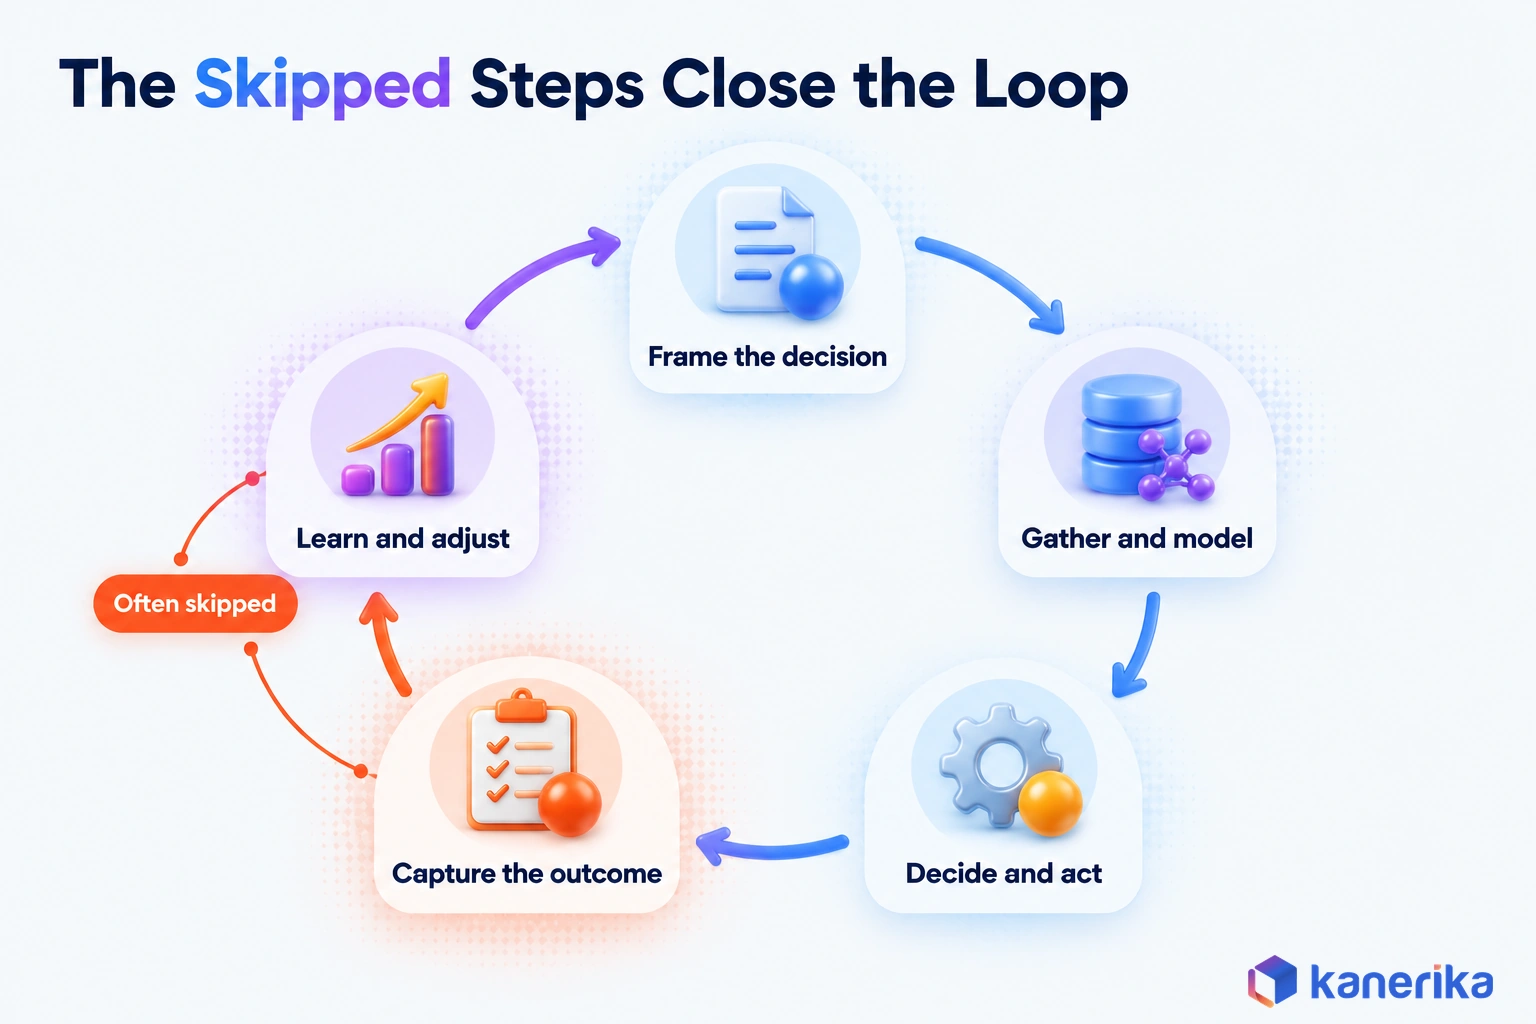
DI works as a loop rather than a one-off project. Each pass makes the next decision a little better, because the outcome of the last one becomes evidence for the next. Here is the loop for a single decision, with the question each step answers.
- Frame the decision. Name the choice, the owner, the options, the deadline and the objective. “Approve, decline or refer this claim within 24 hours” is a framed decision, but “improve claims” is not.
- Gather data and context. Pull the facts the decision depends on, plus context that rarely sits in one system, such as policy terms or a supplier’s lead time.
- Model the options. Apply rules, predictions or optimization so each option gets a score against the objective.
- Predict the impact. Estimate what each option will do to revenue, cost or risk, especially on the downside.
- Decide and act. A person or a system picks an option, then the choice is written into the system where the work happens.
- Capture the outcome. Record what was decided, why, by whom, and what happened next.
- Learn and adjust. Compare outcomes with predictions, then retune the rules, the model or the thresholds.
Steps 6 and 7 are the ones teams skip, yet they are what make the loop intelligent. A pricing team that logs every override and its result will learn within a quarter whether the model or the manager was right more often.
The loop also clarifies who does what. Data engineers own step 2, while data scientists own steps 3 and 4. A named business owner frames the decision, makes the final call and signs off on any change in step 7.
Decision Modeling Methods: Which One Fits Your Decision
A decision model is the logic that turns inputs into a choice. Which method fits depends on how stable the logic is, whether the choice depends on a forecast, and how many options compete at once.
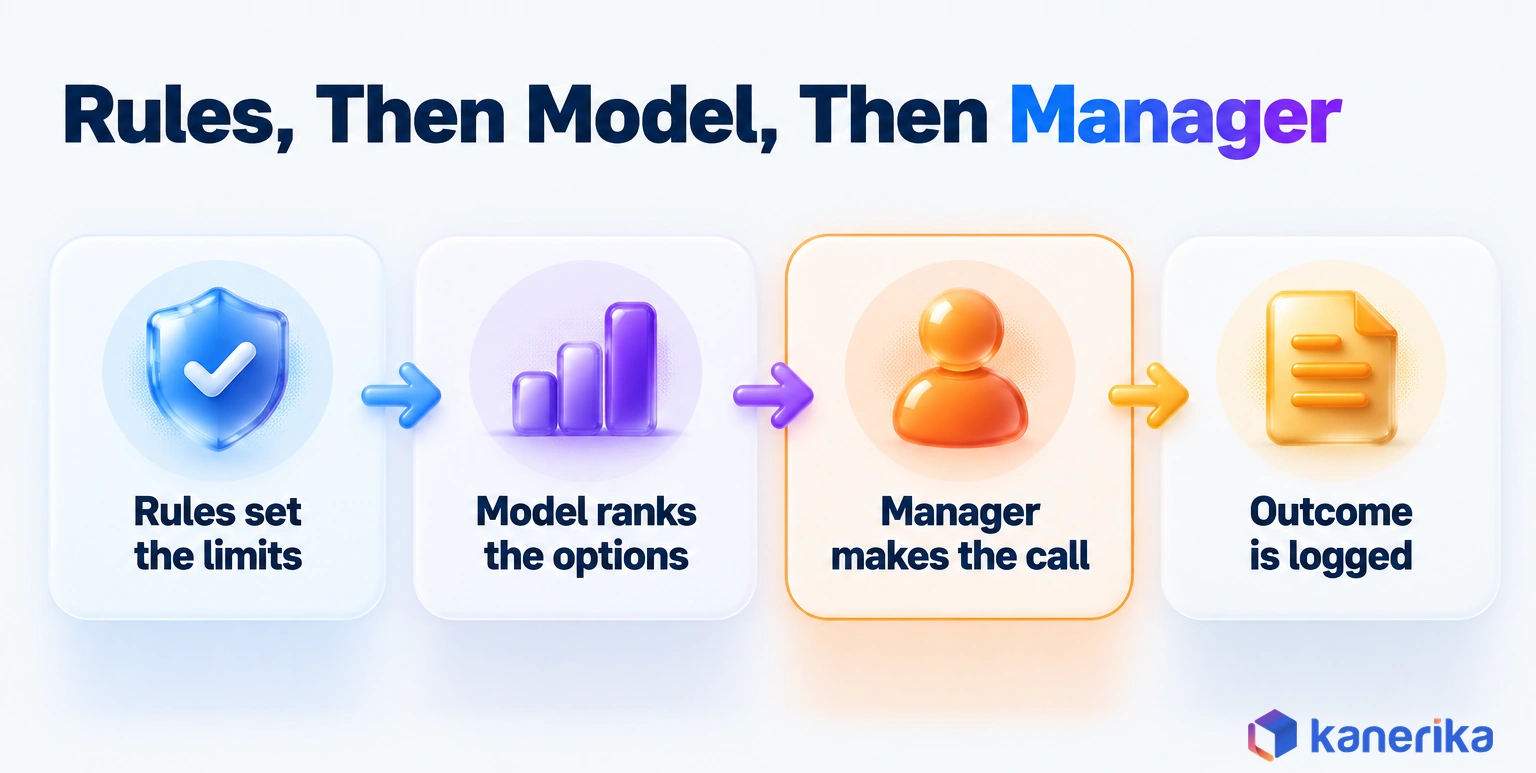
Consider small-business lending at a bank. Eligibility, such as minimum years trading and no recent default, is fixed policy, so a rule handles it. Because the chance of default is uncertain, a predictive model scores it. The interest rate trades risk against the chance of winning the loan, so an optimization model sets it. Even then, a credit officer still reviews large or unusual applications.
That is one decision using four methods, each doing the part it does best. The table below shows when each method fits.
| Method | Best for | Example | Watch out for |
|---|
| Business rules | Stable logic that must also be explained | Eligibility checks, such as approval limits | Rules that multiply until they conflict |
| Predictive models | Choices that depend on a forecast rather than a fixed rule | Default risk, churn and demand, for example | Drift when customer behavior changes |
| Optimization | Many options competing under constraints, such as budget | Pricing, scheduling and stock allocation | A wrong objective that still gives a confident answer |
| Simulation and what-if | Testing options before acting | A new shift pattern before rollout | Assumptions that hide inside the model unless documented |
| Human judgment | Rare or novel calls, especially high-stakes ones | An acquisition or a crisis response | Bias and inconsistency when nothing is recorded |
Writing Decision Logic With DMN
For the rules layer, the Object Management Group’s Decision Model and Notation (DMN) standard gives teams a shared way to write decision logic. It defines a graphical notation and an expression language, including decision tables and decision requirements diagrams. DMN was also designed to work alongside BPMN process models.
Because DMN models can be exchanged as XML, a business analyst can draw the logic and an engineer can run it without retyping it. That shared format also gives auditors something concrete to review, which matters once decisions are automated.
Worked Example: A Weekly Repricing Decision
The easiest way to see DI in action is to follow one decision from start to finish. The numbers below are illustrative, so they show the mechanics rather than a real client result.
Go back to the pricing manager from the opening, and run her Friday question through the loop. Every Monday, her team decides whether to cut the price of each slow-moving SKU, and by how much, before the weekend. Each step maps directly onto the decision loop above.
The Decision, Step by Step
- Frame it. A regional pricing manager owns the call. She can hold, cut 10% or cut 20%. Her objective is the highest gross margin over four weeks, while staying above a 35% margin floor.
- Gather inputs. The team pulls eight weeks of sales by store, current stock, competitor prices and the markdown calendar.
- Apply the rules. Never cut a limited-edition SKU in its first six weeks, and never price below the margin floor.
- Run the model. A demand model predicts units sold at each price for one SKU that costs $110 and sells at $200.
- Test a what-if. The manager asks what happens if a competitor matches the cut, so the model reruns with lower predicted demand.
- Decide, or override. The system recommends an option, and then the manager accepts it or overrides it with a logged reason.
- Feed back. Four weeks later, actual units and margin are recorded against both the recommendation and the final decision.
What the Model Recommends, and Why the Manager Overrode It
Here is what the model returns for that one SKU. Gross margin is the margin per unit multiplied by predicted units over four weeks.
| Option | Price | Predicted units | Margin per unit | Gross margin | Margin rate |
|---|
| Hold | $200 | 30 | $90 | $2,700 | 45.0% |
| Cut 10% | $180 | 42 | $70 | $2,940 | 38.9% |
| Cut 20% | $160 | 50 | $50 | $2,500 | 31.3% (below floor) |
On these numbers the model recommends the 10% cut, because it adds $240 of margin over holding the price. A 20% cut sells the most units but earns the least, and it also breaks the margin floor. So the rule removes it before anyone has to argue about it.
The what-if changes the picture. If a competitor matches the cut, predicted units at $180 fall to 36, so gross margin drops to $2,520. That is below the $2,700 from holding. Since the manager knows a rival promotion is planned for that weekend, she holds the price and logs the reason.
That logged override is the most useful data point in the whole example. After a quarter of decisions like this one, the team can see whether overrides beat the model, and in which situations. From then on, the rules and the model improve from real outcomes instead of opinion.
Decision Intelligence vs BI, Predictive Analytics and AI
These terms overlap, so the clearest way to separate them is by the question each one answers. BI looks backward, while predictive analytics looks forward, and AI supplies techniques that both can use. DI is the discipline that combines them to make one specific choice and then checks whether that choice worked.
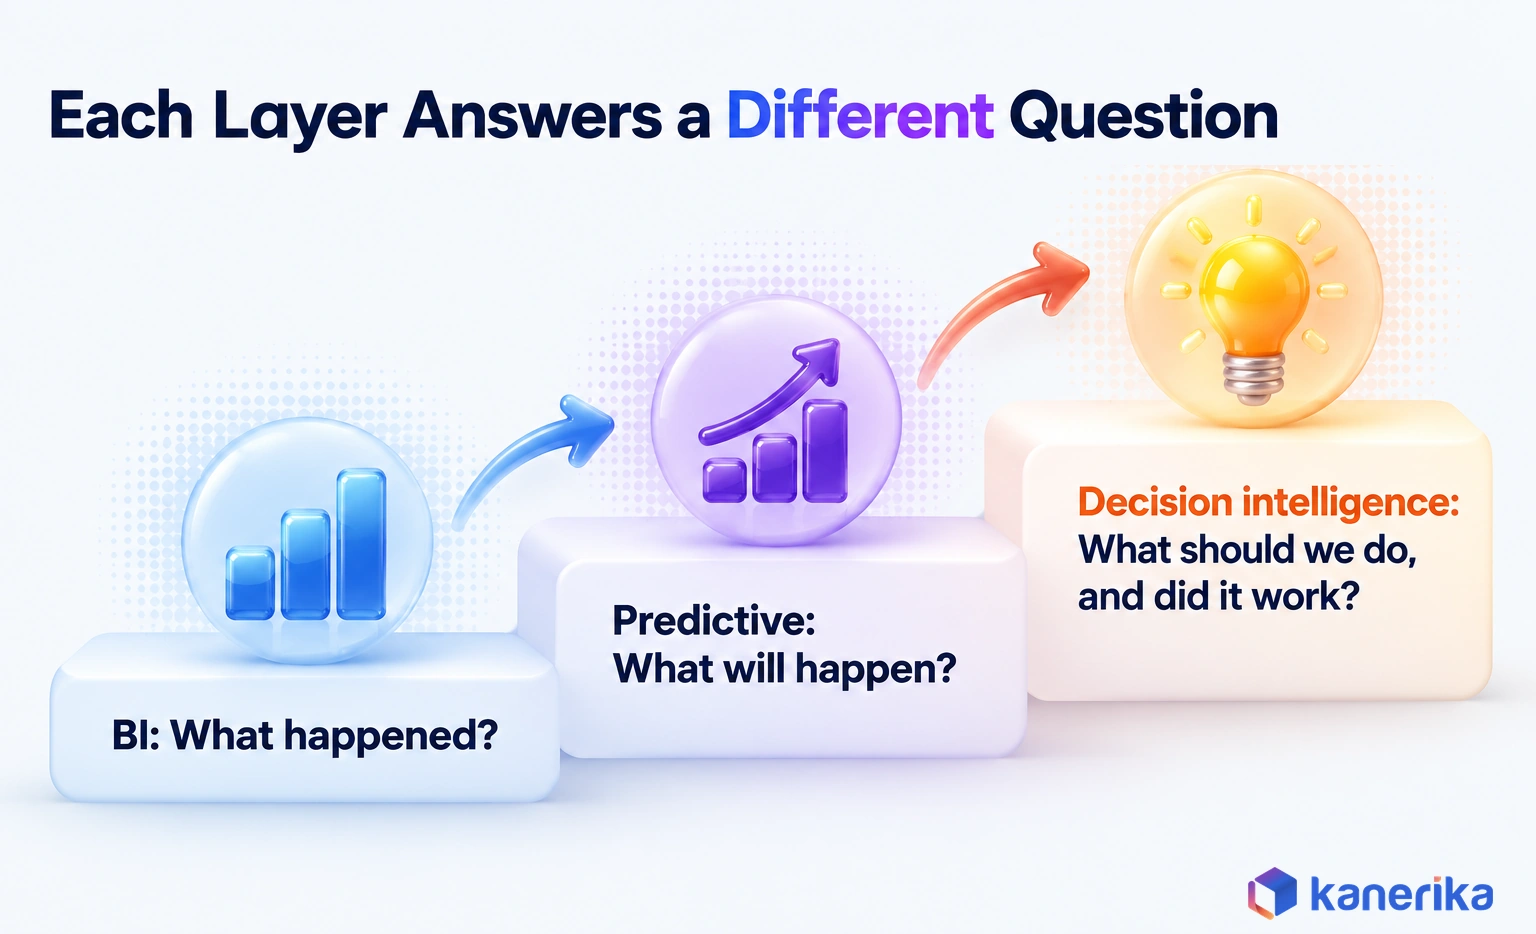
A simple test helps. If the output is a chart, it is BI. When the output is a probability, it is predictive analytics. Once the output is an action with an owner and a measured result, you are looking at DI.
| Discipline | Main output | Typical owner | Measured by |
|---|
| Business intelligence | Reports and dashboards that describe the past | BI or analytics team | Adoption and data accuracy |
| Predictive analytics | Forecasts and risk scores, such as churn risk | Data science team | Model accuracy rather than business results |
| Artificial intelligence | Models, agents and generated content | AI and engineering teams | Task performance, such as accuracy on a test set |
| Decision intelligence | Decisions that are designed, then measured | A named business decision owner | Decision speed and outcomes |
AI is one ingredient of DI, and an optional one. A DI program can run on simple rules with no machine learning at all. On the other hand, an AI model with no decision design around it is just a prediction waiting for someone to act on it.
Does Decision Intelligence Replace Business Intelligence?
No. BI stays the input layer: the governed metrics, definitions and dashboards that tell people what is happening. DI then sits on top and turns those facts into a designed, repeatable choice.
A weak BI foundation makes DI worse, not better, because a model trained on inconsistent metrics automates the inconsistency. If definitions still differ between teams, fix that first with a clear business intelligence strategy. Only then build decisions on top of it.
A quick readiness test takes one afternoon. Pick the metric your decision depends on, such as gross margin, and ask three teams how they define it. If you get three different answers, the BI layer needs work before any decision model can rely on it.
Predictive analytics plays the middle role. It supplies the forecasts that many decision models depend on, such as next month’s demand or a customer’s chance of leaving. The podcast episode below looks at how predictive analytics and BI work together.
Decision Intelligence Use Cases by Industry
DI pays off where a decision is frequent, high in value and measurable. The pattern repeats across industries: a recurring choice, a mix of rules and models, and an outcome you can track.
Supply chain replenishment shows the pattern well. A distributor decides every day how much of each item to reorder for each warehouse. Rules enforce supplier minimums, while a demand model forecasts usage. An optimizer then balances stock-outs against holding cost, so planners review only the orders the system flags as unusual.
| Industry | Decision | Methods | Metric to track |
|---|
| Retail | Markdowns and repricing, especially for slow sellers | Rules and a demand model, then optimization | Gross margin, sell-through |
| Supply chain | Replenishment quantities per warehouse | Demand forecast, then optimization | Stock-out rate and days of inventory |
| Banking | Credit approval and limits | Rules and a risk model, then human review | Approval time, default rate |
| Banking | Fraud holds when a payment looks unusual | Anomaly model plus rules | False-positive rate as well as fraud loss |
| Insurance | Claims triage | Rules, then a classification model | Cycle time and claims leakage |
| Manufacturing | Maintenance scheduling before a failure | Failure prediction, then scheduling optimization | Unplanned downtime |
| Healthcare | Bed and staff capacity during peaks | Demand forecast and simulation | Wait times as well as occupancy |
Notice that every row names a metric. If you cannot say how a decision’s outcome will be measured, it is not ready for DI yet. Start instead with the reporting that makes the outcome visible.
Kanerika Service
Data Analytics and AI Services
Kanerika builds the governed data, semantic models and predictive models that decision intelligence runs on, so each recurring decision has trusted inputs and a measurable outcome.
Explore Data Analytics Services
Architecture and Tools: What an Enterprise DI Stack Needs
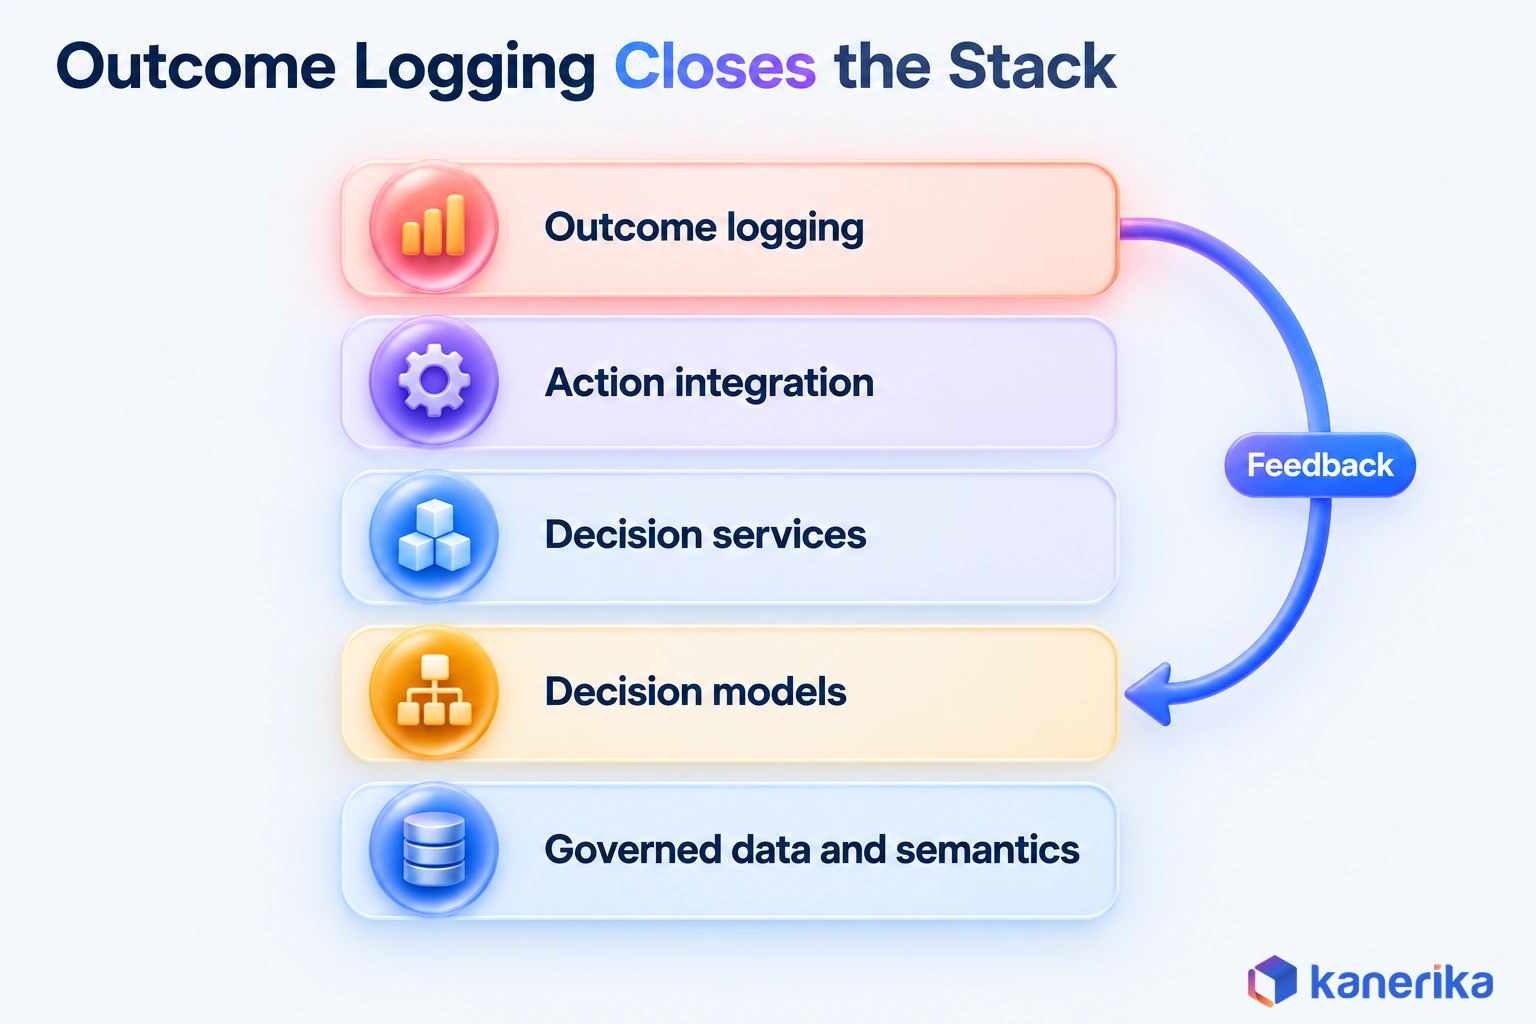
A DI stack is less a single product than a chain of six components. Each one can come from a dedicated platform or be built on the data platform you already run.
Follow one repricing recommendation through the stack to see how they connect. Price history comes from governed data, while gross margin comes from the semantic layer, so finance and merchandising agree on the number. The rules and model run in a decision service. After that, the approved price flows into the pricing system and the outcome is logged against the decision.
| Component | What it does | Example technology |
|---|
| Governed data | Trusted, current inputs, so lineage is clear | A lakehouse or warehouse, such as Microsoft Fabric, Databricks or Snowflake |
| Semantic layer | One shared definition of each metric, so teams agree | Power BI semantic models or metric stores |
| Decision models | Rules, predictions and optimization | DMN rule engines, ML models and solvers |
| Decision services | Run the model when a decision is due | APIs and workflow engines |
| Action integration | Write the decision back, so work actually changes | ERP, CRM, pricing or claims systems |
| Outcome logging | Record each decision, then its result | Decision log tables or an audit store |
Build or Buy?
The build-or-buy choice comes down to where your gaps are. Dedicated DI platforms bundle modeling, simulation and decision logging in one product. Building on Microsoft Fabric, Databricks or Power BI gives more control and reuses governed data you already pay for. In that case, though, your team must assemble the decision service and the outcome log.
A practical middle path keeps data and semantics on the existing platform. Teams then add decision modeling only where the gap is largest, often starting with the outcome log, because nothing else on the stack records it.
What to Check Before Buying a DI Platform
Vendor demos tend to open with dashboards and chat interfaces. Ask instead to see one of your own decisions modeled end to end, and check these points as you watch:
- Decision modeling: rules, predictive models and optimization in one place, ideally with DMN support.
- Explainability: a plain reason for every recommendation, so a reviewer can follow it.
- Audit trail: inputs, model version, recommendation and final decision stored together.
- Integration: the ability to write decisions back into ERP, CRM or case systems rather than just display them.
- Override capture: every human override stored with its reason, then matched to its later outcome.
- Simulation: what-if analysis on real data before a change goes live.
- Cost model: clear pricing per user, per decision or per unit of compute.
If a platform cannot show where an override is stored, it cannot tell you whether the model or the person was right. That single question filters out many tools that are really dashboards with a recommendation widget.
How to Implement Decision Intelligence: A 90-Day Path
The fastest route to value is narrow: one decision, one owner, one baseline. A 90-day pilot is long enough to collect real outcomes, but short enough to keep a sponsor’s attention.
Process mining often comes first, and our guide to process intelligence covers it in depth. Process mining shows how work actually flows and where it waits, which points to the decision steps worth redesigning. DI then takes one of those steps and decides what should happen there.
- Days 1 to 15, pick and frame. Score candidate decisions with the table below, then name the owner and write the decision in one sentence.
- Days 16 to 30, baseline. Measure current speed, outcomes and consistency from historical data before changing anything.
- Days 31 to 50, model. Start with rules, then add a predictive or optimization model only where rules fall short.
- Days 51 to 75, pilot with people in the loop. The system recommends while people decide, and every override is logged with a reason.
- Days 76 to 90, measure and choose. Compare pilot outcomes with the baseline, then scale, retune or stop.
Scaling means reusing the same data products, semantic layer and outcome log for the next decision. That reuse is why the second decision should take less time than the first. The data analytics checklist is a useful way to confirm the foundation is ready before you widen the scope.
Checklist
Data Analytics Checklist
Check data readiness, metric definitions, ownership and reporting before you scale a decision pilot, so the second decision reuses a solid foundation.
Get the Checklist →
Which Decision Should You Model First?
Choose a decision that can show results inside the pilot. Score each candidate from 1 to 5 on the five criteria below, then start with the highest total.
| Criterion | Score 5 when | Score 1 when |
|---|
| Frequency | Made daily or weekly | Made once a year, so data is thin |
| Value at stake | Each decision moves revenue, cost or risk | The outcome barely matters, so gains are small |
| Data availability | Inputs already sit in governed systems | Inputs still live in spreadsheets or in people’s heads |
| Clear owner | One named person is accountable | Nobody owns it, so it drifts |
| Measurable outcome | Results show up within weeks | Results stay unclear until years later |
Weekly repricing, daily replenishment and claims triage usually score well. A once-a-year acquisition, however, scores badly on frequency and measurability, so it stays a supported human decision.
Measuring Decision Intelligence ROI
DI is measured at the level of the decision, not the dashboard. Page views and model accuracy still matter, but a CFO asks a simpler question. Are we making this decision faster, more consistently and with better results than before?
Five measures answer that question. Track them from the baseline phase onward, so the pilot has something honest to compare against.
| Measure | What it shows | How to calculate it |
|---|
| Decision latency | Time from trigger to action | Action timestamp minus trigger timestamp |
| Outcome lift | Improvement over the baseline | Pilot outcome minus baseline outcome, per decision |
| Override rate | How often people reject a recommendation | Overrides divided by recommendations |
| Consistency | Whether similar cases get similar decisions | Share of matched cases that received the same decision |
| Cost per decision | Effort and compute behind each decision | Running cost divided by decisions, tracked monthly |
A simple formula keeps the business case honest. ROI = (outcome lift per decision × decisions per year − annual running cost) ÷ annual running cost. Count only lift you measured against the baseline, rather than lift you expect.
Here is an illustrative calculation that reuses the repricing example. Suppose the pilot’s measured lift averages $240 per SKU decision, the same size as the predicted gain in the example above. Across 2,000 SKU decisions a year, that gives $480,000. Against an assumed running cost of $150,000, ROI = ($480,000 − $150,000) ÷ $150,000 = 2.2, or 220%.
Read the override rate with care. A very high rate means either people distrust the model or the model is wrong. A rate near zero can mean people approve without looking, which is automation bias, so both deserve a review.
AI Assessment
How Ready Is Your Data for Automated Decisions?
Score your data, governance and AI maturity in a few minutes, and see which decisions you could model now and which need groundwork first.
Start Your AI Assessment →
Risks and Governance for Automated Decisions
An automated or AI-assisted decision carries a risk that a report does not, because it acts. Governance is the set of controls that keeps those actions explainable, reversible and owned.
What the Regulations Require
Regulation already reaches some of these decisions. Article 22 of the GDPR gives people the right not to be subject to a decision based solely on automated processing. That right covers decisions with legal or similarly significant effects. Its safeguards also include human intervention and the right to contest the decision.
The EU AI Act goes further for high-risk systems. Its Article 14 requires high-risk AI systems to be designed so that people can oversee them effectively. For credit scoring, life and health insurance pricing or hiring, that means a named person who understands the system and can stop it. Under the EU’s AI Omnibus agreement, these obligations apply to stand-alone high-risk systems from December 2, 2027, instead of August 2, 2026.
Two related topics deserve their own reading. Opaque models make decisions hard to defend, so explainable AI techniques belong in any regulated decision. Where decision data and models are hosted also matters, which is the subject of sovereign AI.
Common Risks and the Controls for Each
| Risk | What goes wrong | Control |
|---|
| Automation bias | People approve recommendations without checking | Track the override rate, then sample approved decisions |
| Opaque models | Nobody can explain a decision when asked | Explainability reports, plus interpretable models for regulated calls |
| Missing audit trail | No record of why a decision was made | Log inputs and model version, as well as the final decision and reason |
| Automated decisions about people | GDPR Article 22 rights are not honored | A human review path, so people can contest |
| High-risk AI oversight | EU AI Act Article 14 expectations are missed | Named overseers who can stop the system when needed |
| Data residency | Data or models sit in the wrong jurisdiction | Region-bound hosting and access controls |
| Unclear ownership | Nobody owns the outcome | One decision owner and a RACI per decision |
A short RACI per decision closes the ownership gap. The business owner is accountable for the outcome, while data science is responsible for the model and data engineering for the inputs. Risk or compliance is consulted on thresholds, and the AI governance checklist covers the remaining controls.
Checklist
AI Governance Checklist
Review oversight, explainability, audit trails and accountability for every AI-assisted decision before it reaches customers or regulators.
Get the Checklist →
How Kanerika Helps Enterprises Put Decision Intelligence to Work
Kanerika builds DI around a client’s own decisions. Work starts with the data foundation through its data analytics services, then adds models, agents and decision logging where they pay off. The luxury retail engagement below follows the same loop this guide describes.
Case Study: 39% Faster Price Changes for Luxury Retail
A prestigious fashion retailer had inconsistent pricing across regions and slow manual repricing. It also lacked actionable insight for its limited-edition SKUs, where a pricing mistake costs the most.
Kanerika built a machine learning pricing engine that drew on demand, competitor data and customer lifetime value. Pricing managers then used Karl, Kanerika’s data analytics AI agent, to run what-if price scenarios in plain language. Meanwhile the FLIP analytics layer kept each pricing decision traceable and auditable.
The published case study reports 24% higher profit margins on top SKUs, a 39% faster price change cycle time and 100% auditability. In loop terms, the engine modeled the options and Karl handled the what-if step. FLIP, in turn, captured each decision for review.
Karl works across data stacks and is also available as a Microsoft Fabric workload. Teams can therefore ask questions of governed data where it already lives. For pricing decisions specifically, AI pricing optimization packages the same approach.
Talk to Kanerika
Ready to Model Your First Decision?
Kanerika runs a short working session to score your candidate decisions, set a baseline and plan a 90-day pilot with outcome logging built in.
Schedule a Demo →
Bottom Line
Decision intelligence is the discipline of designing, running and measuring a business decision, with a named owner and a recorded outcome. It works through a seven-step loop of framing, gathering data, modeling, predicting the impact, acting, capturing the outcome and then learning from it.
Start with one repeatable decision that has an owner and a baseline, such as weekly repricing or claims triage. Use rules where logic is stable, and models where forecasts or trade-offs drive the choice. Keep people in charge when the stakes are rare and high. As AI agents take on more actions, the same design becomes their guardrail. That is what decision intelligence is, and how it actually works: one decision, made on purpose and proven by its outcome.
Frequently Asked Questions
What is decision intelligence in simple terms?
Decision intelligence is a way of treating a business decision as something you design, run and improve. It combines data, analytical models, business rules and human judgment around one specific choice, such as approving a loan or reordering stock. The decision gets written logic, a named owner and a measured outcome, so it can get better over time.
How does decision intelligence work?
Decision intelligence works as a loop. A team frames the decision, gathers the data and context it depends on, models the options and predicts their impact. A person or system then decides and acts, the outcome is recorded, and the rules or models are adjusted. Each pass through the loop makes the next decision better informed.
What is an intelligent decision?
An intelligent decision is one made with relevant data, a clear objective and an explicit method, then checked against its result. It weighs options using rules, forecasts or optimization rather than habit, records why the choice was made and who made it, and feeds the outcome back so the next similar decision is made with better evidence.
Can decision intelligence automate business decisions?
Yes, for frequent and low-risk decisions within set limits, such as holding a suspicious card transaction. Higher-stakes decisions usually stay augmented, with a person approving or overriding a recommendation. GDPR Article 22 gives people the right not to be subject to decisions based solely on automated processing with legal or similarly significant effects. A human review path is safer there.
How do companies implement decision intelligence?
A practical start is one frequent, measurable decision that has a named owner. They baseline its current speed and outcomes, model it with rules first and add predictive or optimization models where rules fall short. A pilot then runs with people approving recommendations and logging overrides, and the results decide whether to scale, retune or stop.
How do you measure decision intelligence ROI?
Measure the decision, not the dashboard. Track decision latency, outcome lift against a baseline, override rate, consistency across similar cases and cost per decision. A simple ROI formula multiplies the measured lift per decision by decisions per year, subtracts the annual running cost, then divides the result by that running cost to get a return ratio.
What is the future of decision intelligence?
The future of decision intelligence is closely tied to AI agents that act on their own, such as changing a price or releasing a payment. Each agent will need a designed decision, guardrails that limit what it may do, a named owner and an outcome log. Decision intelligence supplies that design, so agents act within limits people can audit.
What does a decision intelligence consultant do?
A decision intelligence consultant helps a company pick the decisions worth redesigning and then builds them. The work covers scoring candidate decisions, setting baselines, choosing between rules, predictive models and optimization, connecting the decision to operational systems, and setting up outcome logging and governance. A good engagement ends with a measured pilot and a plan to scale it.
What is an example of decision intelligence?
A retailer deciding every week whether to cut the price of slow-moving products is a common example. Rules protect a margin floor, a demand model predicts sales at each price, and a what-if test checks competitor reactions. The pricing manager accepts or overrides the recommendation, and the result is logged so the team learns which choices worked.
What is the difference between decision intelligence and business intelligence?
Business intelligence reports what happened through dashboards and governed metrics. Decision intelligence uses those facts, plus forecasts and rules, to make a specific choice and then checks whether that choice worked. BI is measured by adoption and data accuracy, while decision intelligence is measured by decision speed and outcomes. The two work together, with BI as the input layer.
Is decision intelligence the same as artificial intelligence?
No. Artificial intelligence is a set of techniques, such as machine learning models and agents, while decision intelligence is a discipline for designing and improving decisions. A decision intelligence program can run on simple business rules with no machine learning at all. AI becomes one ingredient when a decision depends on a prediction, a classification or a generated answer.
Why is decision intelligence important?
The hard part for an enterprise is turning data into fast, consistent and auditable decisions. Decision intelligence addresses all three by writing each decision down, running it the same way every time and recording the result. That makes routine choices faster, keeps similar cases consistent and gives auditors a clear trail, while outcomes feed back into better rules and models.
What is a decision intelligence platform?
A decision intelligence platform is software for modeling, running and tracking business decisions. Typical tools combine decision modeling for rules and predictions, simulation for what-if analysis, decision services that return recommendations, integration that writes choices into operational systems, and outcome logging. Each piece can come from a dedicated platform or be built on the data platform a company already runs.
What is the decision intelligence layer?
The decision intelligence layer sits between governed data and the systems where work happens. It holds the decision models, rules and services that turn facts into recommendations or automated actions, plus the log that records each outcome. It reads from the data platform and semantic layer, and it writes decisions back into tools such as ERP, CRM or claims systems.
What is decision intelligence according to Gartner?
Gartner describes decision intelligence as a practical discipline for engineering how decisions are made and improved. In that view, a decision is designed deliberately, with its logic, data and outcomes made explicit, rather than left to habit. Gartner treats it as a category in its own right and published a Magic Quadrant for decision intelligence platforms in January 2026.
What types of decisions can decision intelligence support?
Decision intelligence supports strategic, tactical and operational decisions, though it pays off most on frequent ones. Operational choices such as repricing, replenishment, credit approval, fraud holds and claims triage happen often and are easy to measure. Strategic decisions such as an acquisition happen rarely, so they usually stay human decisions supported by analysis and scenario modeling.