You’ve got dashboards, reports, and raw data, but you’re still unsure what’s helping you make better decisions. Is it business intelligence or data analytics? Most teams use both, but they often don’t know the difference.
Business intelligence is about tracking what has already happened. It helps you monitor KPIs, build reports, and spot trends in structured data. Data analytics goes deeper. It looks at patterns, runs models, and predicts what is likely to happen next. According to IDC, over 70% of enterprises now use both BI and analytics tools, but only 40% have a clear strategy for how they work together. That gap leads to duplicated efforts, missed insights, and slower decisions.
In this blog, we will break down the real differences between business intelligence and data analytics, show where each fits into your enterprise stack, and help you decide how to use them more effectively together.
What Is Business Intelligence?
Business Intelligence (BI) is the process of collecting, organizing, and visualizing business data to improve decision-making. It emphasizes descriptive reporting—helping organizations understand what has happened and what is happening now. BI relies on structured data and presents it through dashboards, charts, and automated reports that are easy for business users to interpret.
Key Features of BI Tools
BI tools are built for ease of use. They connect to multiple data sources and present information in a visual format. Key features include:
- Interactive dashboards
- Scheduled and ad hoc reporting
- Data visualization (charts, graphs, maps)
- Drag-and-drop interfaces
- Role-based access and sharing
These tools are designed for business users who want quick insights without needing to code.
Common Use Cases in Business
Companies use BI to:
- Track sales and revenue trends
- Monitor marketing campaign performance
- Analyze customer behavior
- Measure operational efficiency
- Create executive-level dashboards
Examples of BI Platforms
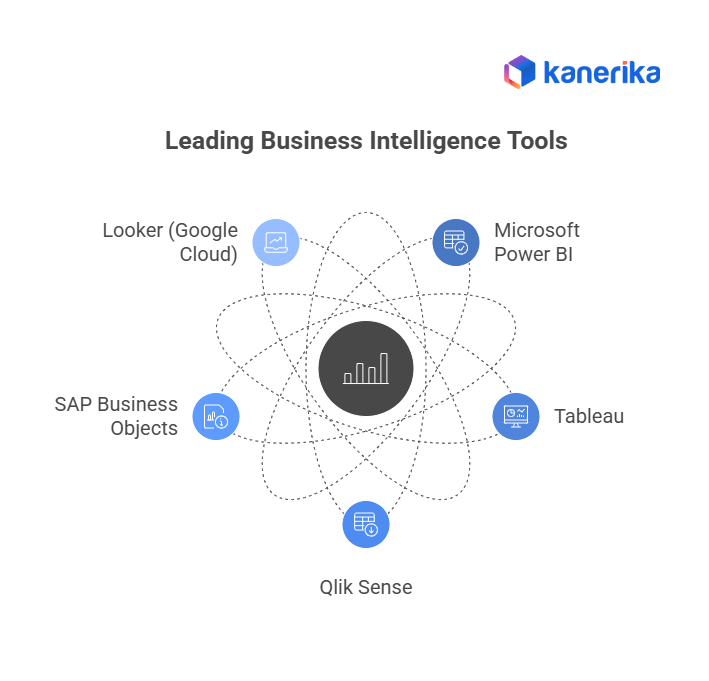
Some of the most widely used BI platforms include:
- Power BI: Microsoft’s tool for building dashboards and reports
- Tableau: Known for strong visualizations and ease of use
- Qlik Sense: Offers associative data modeling and self-service analytics
- Looker: A Google Cloud tool focused on embedded analytics
- SAP BusinessObjects: Enterprise-grade reporting and analysis
Transform Operations with Intelligent Insights!
Partner with Kanerika to implement intelligent data solutions.
What Is Data Analytics?
Data Analytics involves applying statistical analysis, machine learning, and advanced modeling techniques to raw data to identify patterns, correlations, and predictions. Unlike BI, which examines what has happened, analytics focuses on why it happened and what is likely to happen next. It often requires technical expertise and works with both structured and unstructured data.
Types of Data Analytics
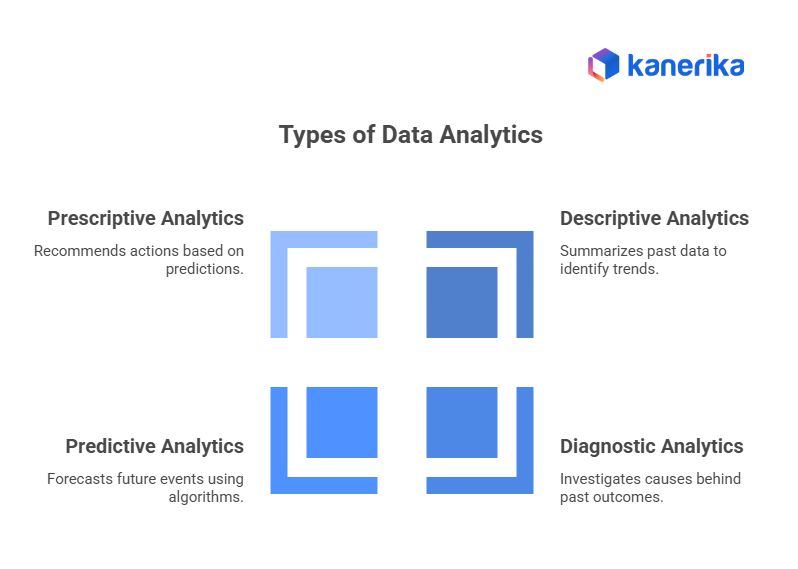
There are four main types of analytics:
1. Descriptive Analytics – What happened?
Reviews historical data to identify trends and summarize past performance.
Example: Monthly sales reports showing revenue across regions.
2. Diagnostic Analytics – Why did it happen?
Investigates underlying reasons and root causes behind outcomes.
Example: Analyzing customer churn to understand why users stopped subscribing.
3. Predictive Analytics – What will happen next?
Uses algorithms, statistical models, and machine learning to forecast future events.
Example: Demand forecasting for seasonal products.
4. Prescriptive Analytics – What should we do?
Provides actionable recommendations based on predictive outcomes to guide decision-making.
Example: Optimizing pricing strategies to maximize profit.
Each type builds on the previous one, moving from simple summaries to advanced decision-making.
Tools Used in Data Analytics
Data analytics often requires more technical tools than BI. Common ones include:
- Python and R for statistical modeling and machine learning
- SQL for querying structured data
- Jupyter Notebooks for interactive analysis
- Excel for basic analysis
- Apache Spark and Hadoop for big data processing
- SAS and SPSS for enterprise analytics
These tools are used by data analysts, engineers, and scientists.
Where Analytics Fits in Business Strategy
Data analytics supports long-term planning and innovation. It helps businesses:
- Predict customer churn
- Optimize supply chains
- Personalize marketing
- Improve product development
Analytics is used when businesses want to go beyond “what happened” and ask “what’s next” or “what if.”
Business Intelligence vs Business Analytics: How to Choose the Right Strategy?
Explore BI vs Business Analytics: understand differences, benefits & choose the right strategy.
Business Intelligence vs Data Analytics: Key Differences
Business intelligence and data analytics are often used together, but they serve different purposes. BI is focused on monitoring and reporting. It helps teams understand what’s happening in the business right now using dashboards and visual summaries. It’s fast, visual, and easy to use.
Data analytics is more technical and deeper. It’s used to explore data, find patterns, and make predictions. It often requires coding and statistical knowledge. While BI helps with day-to-day decisions, analytics supports long-term strategy and innovation.
| Feature | Business Intelligence | Data Analytics |
| Main Goal | Track and report business performance | Explore data and predict future outcomes |
| Data Type | Structured, historical | Structured and unstructured, real-time |
| Tools | Power BI, Tableau, Qlik | Python, R, SQL, Jupyter |
| User Skill Level | Low to medium | Medium to high |
| Output | Dashboards, reports | Models, predictions, statistical insights |
| Use Case | Sales tracking, executive reporting | Customer churn prediction, fraud detection |
| Decision Support | Helps with operational decisions | Helps with strategic planning |
| Speed of Insight | Fast, visual | Slower, deeper |
| Collaboration | Easy sharing across teams | Often siloed in data teams |
| Setup Time | Quick setup with pre-built connectors | Longer setup with custom pipelines |
Data Analysis Vs Data Science: The Ultimate Guide
Discover the key differences between data analysis and data science, plus choose the right path.
How Business Intelligence and Data Analytics Work Together
When comparing Business Intelligence vs Data Analytics, it’s easy to assume they operate in silos. In reality, they are complementary. Business Intelligence (BI) translates data into accessible dashboards and reports that show what is happening, while Data Analytics uncovers deeper patterns and provides predictions about what will happen next. Businesses that combine both approaches gain not only visibility into operations but also foresight into future outcomes.
Business Intelligence in Action: Everyday Scenarios
Business Intelligence tools are designed to simplify access to data, allowing decision-makers to quickly evaluate performance. Here are some common ways BI is used:
1. Daily and Weekly Performance Dashboards
BI platforms consolidate data from sales, finance, HR, and operations into real-time dashboards. For example, a sales manager can log in and see daily revenue trends, conversion rates, and pipeline updates without waiting for manual reports.
2. Monitoring KPIs Across Departments
Executives use BI dashboards to track performance indicators across multiple business units. HR may monitor attrition rates, finance can track expense ratios, and operations may track supply chain delays—all in a single, integrated view.
3. Financial and Operational Reporting
BI automates recurring reporting tasks, from monthly P&L statements to compliance audits. This saves hours of manual work while ensuring accuracy and consistency. In regulated industries, BI reports are particularly valuable for audit readiness.
Data Analytics in Action: Advanced Scenarios
Data Analytics pushes beyond reporting into pattern recognition, forecasting, and optimization. Its methods reveal why something happened and what could happen next.
1. Predicting Customer Churn
Analytics models can analyze user behavior—such as logins, purchases, and support tickets—to predict which customers are at risk of leaving. Businesses can then launch retention campaigns to reduce churn.
2. Personalizing Marketing Campaigns
With analytics, marketing teams can segment customers and predict which products they are likely to buy. Personalized offers improve engagement and conversion rates compared to one-size-fits-all campaigns.
3. Forecasting Demand and Revenue
Machine learning algorithms process historical sales data, seasonality patterns, and market signals to forecast demand. This helps retailers avoid overstocking or stockouts. Similarly, revenue forecasts support budgeting and investor reporting.
4. Risk Analysis and Fraud Detection
Financial institutions use analytics to detect anomalies in transaction data. Suspicious activity, such as repeated high-value transactions, can be automatically flagged for investigation, thereby minimizing financial and reputational risk.
When to Use Business Intelligence vs Data Analytics
Businesses often ask whether BI alone is sufficient or if analytics should be added to the mix. The answer depends on the goals.
Choose BI when you need transparency, monitoring, and quick access to performance metrics. It is ideal for executives who want straightforward reporting without diving into technical complexity.
Choose Analytics when you need deeper insights, such as understanding customer behavior, predicting future trends, or identifying opportunities for optimization and improvement.
Use Both Together when your organization wants both real-time visibility and advanced forecasting. For example, an e-commerce company may use BI to track daily orders and analytics to personalize recommendations.
Choosing the Right Approach for Your Business
Selecting between Business Intelligence vs Data Analytics depends on your company’s goals, resources, and maturity in handling data.
Key Questions to Ask Before Deciding
- Are we primarily looking to monitor performance or to predict outcomes?
- Do we already have skilled analysts, or do we need a tool for business users to utilize?
- What level of decision-making do we want to support—operational, tactical, or strategic?
- How much historical vs real-time data do we rely on?
- What ROI are we expecting from investing in BI or analytics?
Industry-Specific Considerations
Retail: BI provides daily sales visibility; analytics predict customer demand and optimize inventory.
Healthcare: BI supports compliance and patient reporting, while analytics forecasts disease outbreaks and patient risks.
Finance: BI ensures KPI tracking and compliance; analytics enhances fraud detection and investment modeling.
Manufacturing: BI monitors production efficiency, while analytics predict machine breakdowns to enable preventive maintenance.
Transform Your Business with AI-Powered Solutions!
Partner with Kanerika to build scalable BI and analytics solutions.
Common Misconceptions About BI and Analytics
“Business Intelligence is just dashboards.”
While dashboards are a core feature, BI tools are far more robust. They support data integration from multiple systems, automated reporting, drill-down analysis, and ad-hoc querying. In short, BI is not just about visualization—it is about empowering business users to make informed decisions.
“Analytics is only for data scientists.”
It’s true that advanced analytics requires technical expertise, but modern tools are changing the game. Many platforms now offer low-code or no-code analytics solutions that allow non-technical users to perform predictive analysis. As a result, analytics is no longer limited to highly skilled data scientists.
Understanding the difference between Business Intelligence vs Data Analytics helps organizations leverage the right tools for insights. BI focuses on reporting and dashboards, while analytics enables deeper predictive and prescriptive insights.
Real-World Examples of BI and Analytics
Case Study 1 – Business Intelligence in Retail: LEAFIO
LEAFIO, a retail automation platform, works with mid-sized retailers to improve inventory planning and assortment decisions. One client used LEAFIO’s BI tools to analyze product performance across store locations. By identifying slow-moving items and optimizing shelf space, they reduced stockouts and improved gross margins.
The BI system helped track KPIs like turnover ratio, shrinkage, and profitability. It also supported dynamic pricing strategies based on demand and competitor activity. After implementation, the retailer saw faster decision-making and better alignment between store managers and central teams.
Case Study 2 – Data Analytics in Healthcare: UCSF Health + GE Healthcare
UCSF Health partnered with GE Healthcare to build a predictive analytics platform for ICU monitoring. Using real-time data from electronic health records and vital signs, the system flagged early signs of patient deterioration, such as sepsis or cardiac arrest.
This proactive approach led to fewer ICU deaths and shorter hospital stays. Doctors could intervene earlier, improving outcomes without changing treatment protocols. The platform utilized GE’s Mural Critical Care software, which was trained on historical data to identify patterns that human teams might miss.
Case Study 3 – Combining BI and Analytics in E-commerce: Zara & Nordstrom
Zara, the fashion retailer, uses BI dashboards to monitor store traffic and sales in real time. They combine this with heat map visualizations to optimize store layouts. After redesigning based on customer movement data, Zara saw a 7% increase in conversion rates.
Nordstrom uses customer journey analytics to connect online and offline experiences. By analyzing how users move between channels, they improved cross-channel purchases by 15%. BI helps track performance, while analytics powers personalization and experience design.
AI in Robotics: Pushing Boundaries and Creating New Possibilities
Explore how AI in robotics is creating new possibilities, enhancing efficiency, and driving innovation across sectors.
Transform Your Business with Kanerika’s Business Intelligence and Analytics Solutions
Kanerika is the premier choice for businesses seeking to innovate, enhance operations, and scale through advanced business intelligence (BI) and analytics services. We craft personalized solutions tailored to meet each organization’s unique needs, utilizing cutting-edge analytics techniques to deliver actionable insights.
With our comprehensive business intelligence tools, organizations can automate data handling and analysis, optimizing costs and resources while significantly improving operational efficiency. Our BI solutions provide real-time reporting, dashboards, and data visualization, empowering teams to make informed decisions based on accurate and timely information. This thereby adds tangible value to your business operations.
In addition to business intelligence, we provide robust analytics capabilities that enable businesses to uncover hidden trends, drive performance improvements, and inform strategic planning. Our expertise in data governance ensures that your data is accurate, reliable, and compliant with industry standards.
Case Study 1: Strengthening Business Intelligence with Cloud Integration
Client
A leading industrial steel mill services provider operating across North America and expanding globally.
Challenge
The client was using a legacy system that was slow, complex, and expensive to maintain. It lacked drag-and-drop features, supported limited encryption, and required heavy processing power. Real-time analysis was inefficient, and decision-making was delayed. The system also posed risks to data security and compliance.
Solution
Kanerika helped the client modernize their BI setup using Microsoft Dynamics AX, Azure, and Power BI. The team:
- Organized and optimized data for better access
- Built interactive dashboards for real-time insights
- Integrated Azure Data Lake for secure, scalable storage
- Used Power BI to enable faster, visual decision-making
Impact
- 45% improvement in process efficiency
- 25% reduction in storage costs using Azure’s pay-as-you-go model
- 2.5% increase in revenue through better decision-making
- 40% boost in productivity by reducing manual reporting tasks
This transformation helped the client shift from manual data manipulation to intelligent, insight-driven operations.
Case Study 2: Centralized Data Analytics Platform Modernization
Client
A global pharmaceutical company with over 500 SKUs and operations in 55+ countries.
Challenge
The client’s data was scattered across various systems, including Model N, SQL Server, SAP, and isolated databases. This fragmentation caused delays in decision-making, data inconsistencies, and missed market opportunities. Teams were duplicating efforts, and strategic planning lacked reliable insights.
Solution
Kanerika built a centralized data platform using Microsoft Fabric Data Lakehouse and Power BI. The solution:
- Unified data from multiple sources into one structured lakehouse
- Ensured data integrity and streamlined access
- Created custom Power BI dashboards for real-time reporting
- Enabled scalable architecture for future growth
Impact
- 36% faster decision-making with real-time insights
- 78% reduction in data errors by eliminating duplication
- 41% increase in data processing speed across departments
- Improved strategic planning and operational efficiency
This modernization enabled the client to transition from fragmented reporting to a unified, analytics-driven approach.
Partner with Kanerika to explore Business Intelligence vs Data Analytics, transform your data into actionable insights, and boost decision-making.
Accelerate Growth Through Intelligent Automation!
Partner with Kanerika to build scalable BI and analytics solutions.
FAQs
1. What is the main difference between business intelligence and data analytics?
Business intelligence focuses on tracking and reporting on past and present data through dashboards, reports, and KPIs. Data analytics goes beyond reporting by uncovering patterns, correlations, and predictions to explain why things happened and what is likely to happen next.
2. Can a company use both BI and data analytics together?
Yes, most companies benefit from using both. Business intelligence helps leaders monitor real-time performance, while data analytics provides predictive insights for future planning. Together, they create a more complete decision-making framework.
3. Do I need technical skills to use BI tools?
Not always. Platforms like Power BI, Tableau, and Qlik are designed for business users with easy-to-use interfaces. However, advanced data analytics often requires technical knowledge in areas like SQL, Python, R, or machine learning.
4. Is BI only about creating dashboards?
No, business intelligence is not limited to dashboards. While dashboards are a common feature, BI also includes automated reporting, data integration from multiple sources, KPI tracking, and generating insights that support performance improvement.
5. How do data analytics tools add value beyond BI?
Data analytics tools allow businesses to forecast demand, optimize pricing strategies, detect fraud, and personalize marketing campaigns. Unlike BI, which mainly shows what is happening, analytics explains why it happened and what is likely to happen in the future.
6. Which is better for my business: BI or data analytics?
The answer depends on your business needs. BI is useful for gaining visibility into current operations, while analytics is better for predicting trends and shaping future strategies. In practice, businesses achieve the best results when they use both approaches together.


