“Without data, you’re just another person with an opinion.” – W. Edwards Deming
Among the many business intelligence tools out there — Tableau, Qlik, Looker — Power BI continues to lead because of its deep integration with Microsoft services, cost-effectiveness, and flexibility. According to the 2024 Gartner Magic Quadrant for Analytics and BI Platforms, Power BI holds a Leader spot for the 16th time, praised for its scalability and accessibility across skill levels.
With the March 2025 update, Microsoft added a major feature: the ability to create Direct Lake Semantic Models directly in Power BI Desktop — and across multiple lakehouses or warehouses. This means you can build and analyze large-scale models without constantly refreshing data or juggling manual steps.
In this blog, you’ll learn how to turn on the Direct Lake feature, connect multiple lakehouses in a single model, create calculated measures, and build reports — all inside Power BI Desktop. We’ll also cover how this method stacks up against traditional import and DirectQuery modes.
What is a Direct Lake Semantic Model in Power BI?
A Direct Lake Semantic Model is a Power BI feature introduced in the March 2025 update. It allows users to build semantic models directly on top of Microsoft Fabric’s OneLake storage system. Instead of importing data or relying on refresh-heavy connections, this model reads live data straight from lakehouses or warehouses — even across multiple sources.
You’re no longer limited to a single data source or dependent on scheduled refreshes. Power BI reads the data directly from where it’s stored, keeping your model up to date without duplication or delay.
Key Features of Direct Lake Semantic Models in Power BI
- Model Creation in Power BI Desktop: You can build and manage your semantic model fully inside the desktop app, without needing to jump into the Power BI Service.
- Multiple Lakehouse Connections: Combine data from more than one lakehouse or warehouse. Earlier Direct Lake models were limited to a single source.
- No Data Import Required: Models run on live data — which means no duplication, no manual syncing, and no size bloating.
- Fast Performance: It directly queries OneLake, the model loads faster and reacts quicker during report generation.
- Auto-Version Tracking: Any changes made to the model can be tracked over time, useful for debugging and collaboration.
- Full Integration with Fabric Workspaces: Once created, your semantic model is immediately saved to your Fabric workspace, making it available in the Power BI Service for reuse.
Move Beyond Legacy Systems and Embrace Power BI for Better Insights!
Partner with Kanerika Today.
Steps to Enable Direct Lake Semantic Model Support in Power BI
Before you can start building a Direct Lake Semantic Model, you need to turn on a specific preview feature in Power BI Desktop. This setting unlocks the ability to create models that pull data live from multiple lakehouses or warehouses using Direct Lake mode.
Follow these steps to enable it:
Step 1: Launch Power BI Desktop
Make sure you’re using the latest version of Power BI Desktop. The feature is part of the March 2025 release, so older versions won’t have this option.
Step 2: Go to Options
Once Power BI Desktop is open, click on the File tab in the top-left corner, then choose Options and Settings, and click on Options.
Step 3: Find the Preview Features Section
In the Options window, look on the left-hand side and scroll down to Preview Features.
Step 4: Enable the Feature
Look for the checkbox labeled:
“Create semantic models in Direct Lake storage mode from one or more Fabric artifacts”
Tick this box to enable it.
Step 5: Save and Restart
Click OK to save the setting. Then close and reopen Power BI Desktop. This step is essential — the feature won’t take effect until Power BI restarts.
This isn’t just a minor switch. Enabling this feature changes how Power BI Desktop behaves, giving you access to a more powerful modeling experience. Without it, the Direct Lake model creation option simply won’t show up in your interface.
How to Connect to Your First Lakehouse in Power BI
Now that you’ve enabled the preview feature, you’re ready to build your first Direct Lake Semantic Model. In this section, you’ll connect Power BI Desktop to a lakehouse in Microsoft Fabric and create your base model using live data.
Here’s how to do it:
Step 1: Open Power BI Desktop
Launch Power BI Desktop after enabling the preview feature. You’ll land on a blank report canvas.

Step 2: Access the OneLake Catalog
On the Home ribbon, click the OneLake Data Hub or find the OneLake Catalog pane. This is where your available lakehouses and warehouses are listed.

Step 3: Choose a Lakehouse
From the list of available resources, select your target lakehouse. For example, choose lake01 under a workspace like 01GA fabric.

Step 4: Click Connect
Once you select the lakehouse, click the arrow next to the Connect button. You’ll see two options:
- Connect to OneLake
- Connect to SQL Endpoint
Choose Connect to OneLake.

Step 5: Name Your Semantic Model
You’ll be prompted to give your semantic model a name. Use something simple and meaningful like:
SemanticModel_Desktop_01

Step 6: Select Your First Table
A list of tables from the selected lakehouse will appear. Pick a starting table — for example, Item.

Step 7: Click OK
Once the table is selected, click OK to confirm. Power BI will now create your semantic model in Direct Lake mode.

Steps to Add Tables from Multiple Lakehouses in Power BI
You might have sales data in one lakehouse, product info in another, and regional insights stored separately. In the past, this meant merging all of it before analysis — either through ETL processes or workarounds that slowed you down.
With Direct Lake Semantic Models in Power BI, you don’t need to do that anymore. You can pull data from multiple lakehouses or warehouses, combine them into one model, and work on it live — all from Power BI Desktop.
Let’s look at why these matters and how to do it step by step.
Step 1: Stay Inside Your Current Model
Make sure you’re still in the model you created earlier in Power BI Desktop. You don’t need to start a new file.
Step 2: Open the OneLake Catalog Again
On the left pane, go to the OneLake catalog. This shows all the available lakehouses and warehouses you have access to.
Step 3: Pick a Second Lakehouse
Select a different lakehouse (e.g., lake04). This can be from the same workspace or another one, as long as you have permission.
Step 4: Connect and Select a Table
Click the arrow next to Connect, then choose Connect to OneLake. Pick the table you need — for example, Sales — and confirm.
Step 5: Check That It’s Added
The new table will now appear in your model view, alongside the table from the first lakehouse (e.g., Item).
Step 6: Create Relationships
To link the data:
- Drag a common field (e.g., Item ID in Sales) to its counterpart in the other table (Item).
- In the dialog that opens, set the relationship as:
- Many-to-One
- Single Direction
- Make it Active
Then click OK.
Step 7: Save Your Model
Save the changes. The model is now live and supports querying across lakehouses.
Why Add Tables from Multiple Lakehouses?
- Cross-domain analysis: Connect sales with product, customer, and supply chain data in one place.
- Faster decision-making: Avoid manual joins or exports from different teams or tools.
- Cleaner architecture: No ETL or staging layers needed just to combine two sources.
- Modular modeling: Keep data domains separate but use them together when needed.
How to Verify and Use Your Direct Lake Semantic Model in Power BI
After building your Direct Lake Semantic Model in Power BI Desktop, it’s essential to verify its successful deployment in the Power BI Service. This step ensures that your model is accessible for collaboration, report creation, and further analysis within your organization.
Step 1: Open Power BI Service
Navigate to Power BI Service in your web browser and sign in with your organizational credentials.
Step 2: Access Your Workspace
In the left-hand navigation pane, click on Workspaces and select the workspace where you saved your semantic model, such as 01GA fabric.
Step 3: Locate the Semantic Model
Within the workspace, go to the Datasets + Dataflows tab. Here, you should see your newly created semantic model listed, for example, SemanticModel_Desktop_01.
Step 4: Open the Semantic Model
Click on the semantic model name to open it. This action allows you to view the model’s structure, including tables, relationships, and measures.
Step 5: Create a New Report
From the semantic model view, click on Create Report. This option opens a new report canvas where you can start building visualizations using the data from your Direct Lake Semantic Model.
Step 6: Build Visualizations
In the report canvas:
- Drag fields from your model into the Values, Axis, and Legend areas to create visuals.
- Use slicers and filters to interact with your data dynamically.
- Customize visuals to suit your analytical needs.
Step 7: Save and Share the Report
Once your report is ready:
- Click on File > Save to store the report within the workspace.
- Use the Share option to distribute the report to colleagues or stakeholders, ensuring they have the necessary permissions to view it.
Cognos vs Power BI: A Complete Comparison and Migration Roadmap
A comprehensive guide comparing Cognos and Power BI, highlighting key differences, benefits, and a step-by-step migration roadmap for enterprises looking to modernize their analytics.
Building Reports Using Your Direct Lake Semantic Model
Once you’ve created your Direct Lake Semantic Model and connected data from one or more lakehouses, the next step is where the real magic happens — building reports.
With traditional Power BI workflows, you often had to wait for data imports, manage refresh cycles, or pre-process data to make reports possible. Now, with Direct Lake, you can query data live, right from OneLake, and build interactive visuals without delay.
Here’s how to get started with your first report, using the model you just built.
Step 1: Open a New Report
In Power BI Desktop, open a new blank report. This report will connect to the semantic model you just created — not start from scratch.
Step 2: Connect to the Semantic Model
Go to Home → Get Data → Power BI datasets (or OneLake catalog, if you prefer).
Look for your semantic model, named something like SemanticModel_Desktop_01.

Step 3: Choose Connection Mode
When prompted, choose the default read-only mode. This is ideal for building reports without making changes to the model itself.
Tip: If you do want to edit the model again later, use the edit mode. But for reporting only, read-only is perfect.
Step 4: Add Visuals
Start dragging fields into the canvas:
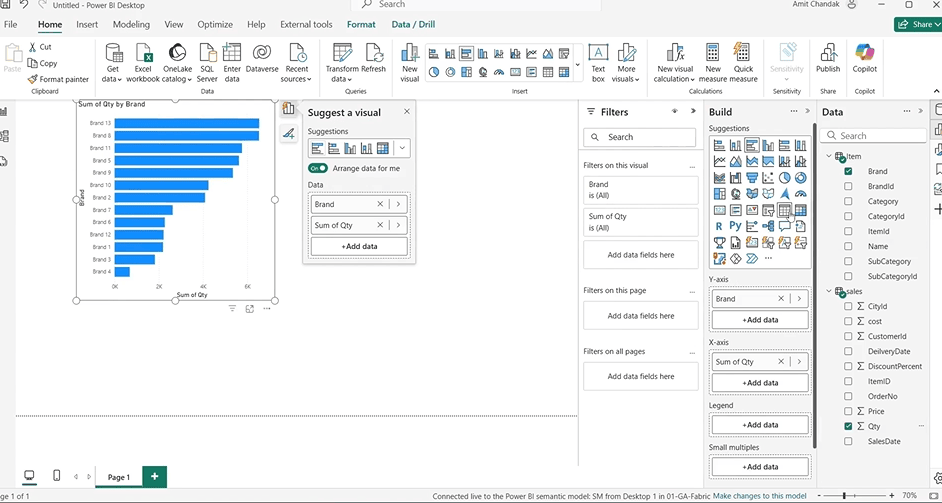
- From Item table, drag in a column like Brand
- From Sales, drag in a metric like Quantity
Power BI will automatically detect relationships and visualize the data.
Step 5: Format and Customize
Change the visual type to suit your needs — e.g., table, bar chart, or matrix. Add filters, slicers, or formatting options to make the data easier to read.
Step 6: Save the Report
Once done, save the report as a .pbix file. You can also publish it to Power BI Service if you want to share it with others.
Creating a Central Measure Table in Power BI
Once your model is set up and your tables are connected, the next step is to calculate meaningful metrics — like Gross Sales, Profit, or KPIs. But instead of scattering measures across different fact tables, it’s cleaner and more scalable to store them in a dedicated measure table.
This is a common Power BI best practice. It keeps your model organized and your report-building process smoother.
Let’s walk through how to set this up — especially in Direct Lake mode, where a few traditional options (like Enter Data) aren’t available.
Step 1: Use the “New Table” Option
Since “Enter Data” is not available in Direct Lake models, go to the Home ribbon and click on New Table.
Step 2: Define a Dummy Table
Use a basic table expression that creates a placeholder row. Example:

You’ll now see a table named MeasureTable with one row and one column called KPI.
Step 3: Add a New Measure
Click on the MeasureTable, and then click New Measure.
For example, to calculate Gross Sales:

This measure will now live inside the MeasureTable, separate from your data tables.
Step 4: Hide the Placeholder Column
To clean things up, right-click on the KPI column and select Hide in Report View. This keeps your model tidy and focused only on usable fields.
How to Use Your Measures in Power BI Reports
Now that you’ve created a dedicated measure table and added some DAX calculations like Gross, it’s time to use those measures in your reports.
This step confirms that your Direct Lake Semantic Model is not only functional, but also ready for business use — live, fast, and accurate.
Let’s walk through how to bring your new measures into a Power BI report.
Step 1: Return to Your Open Report
Go back to the report file you created earlier that’s already connected to your semantic model.
Step 2: Refresh the Model
Click Refresh from the toolbar. This ensures any new objects — like your MeasureTable or added DAX measures — appear in the fields pane.
Step 3: Locate Your Measure Table
In the fields pane on the right, find the MeasureTable. If you hid the placeholder column earlier, you’ll only see the actual measures inside.
Step 4: Add a Measure to a Visual
Drag the measure — for example, Gross — into a visual like:
- A table
- A card
- A column chart
Combine it with dimensions from other tables (e.g., Brand from the Item table or Region from the Sales table) to get segmented insights.
Step 5: Confirm Output
Power BI should render the results immediately. Since this is Direct Lake mode, the query is sent live to OneLake — no waiting, no refresh required.
If your measure references fields that don’t exist or relationships aren’t set properly, Power BI will throw an error. Double-check your table links if anything seems off.
Real-World Example: Bringing It All Together
Let’s say you’re building a sales dashboard for your company. You’ve already connected two tables:
- Item (from one lakehouse), which includes product details like Brand and Item ID
- Sales (from another lakehouse), which includes Quantity and Price
You’ve also created a custom measure:

This measure calculates Gross Sales by multiplying quantity sold by price — row by row — and summing the result.
Now you want to see gross sales by brand. Here’s how:
- In your report, add a Table visual.
- Drag Brand (from the Item table) to the rows.
- Drag the Gross measure (from your MeasureTable) to the values.
Power BI now shows a clean breakdown of gross sales per brand — live, accurate, and instantly calculated using data from two different lakehouses. No refresh needed. No data copy. Just smart modeling.
Direct Lake vs Import vs DirectQuery: Which Power BI Mode Should You Use?
Power BI now supports three main data access modes — and choosing the right one can make or break your model’s performance, flexibility, and maintenance effort.
Here’s a side-by-side comparison to help you decide:
| Feature | Import Mode | DirectQuery | Direct Lake (New) |
| Data Refresh Needed | Yes | No | No |
| Performance | Fast (cached data) | Can be slow (live calls) | Fast (live from OneLake) |
| Multi-source Modeling | Possible but messy | Limited and rigid | Yes, built-in support |
| Transformation Support | Full via Power Query | Limited | None (for now) |
| Offline Availability | Yes | No | No |
| Data Duplication | Yes | No | No |
| Data Size Limits | File-based constraints | Backend limits apply | Unlimited (live model) |
Key Takeaways
- Use Import Mode if you need full transformation control and don’t mind managing refreshes.
- Use DirectQuery when connecting to real-time systems like SQL Server — but expect some performance trade-offs.
- Use Direct Lake when your data is in Microsoft Fabric (OneLake) and you want speed, simplicity, and zero refresh cycles.
Direct Lake isn’t a replacement for every scenario, but it’s now the best fit for live reporting across Fabric-based storage.
Direct Lake Semantic Models: Real-World Scenarios
Understanding the technical “how” is important — but just as crucial is knowing when and why to use Direct Lake Semantic Models in your actual business environment.
Below are real-world examples that show how organizations across different industries are applying this feature to streamline reporting, reduce manual work, and get faster insights.
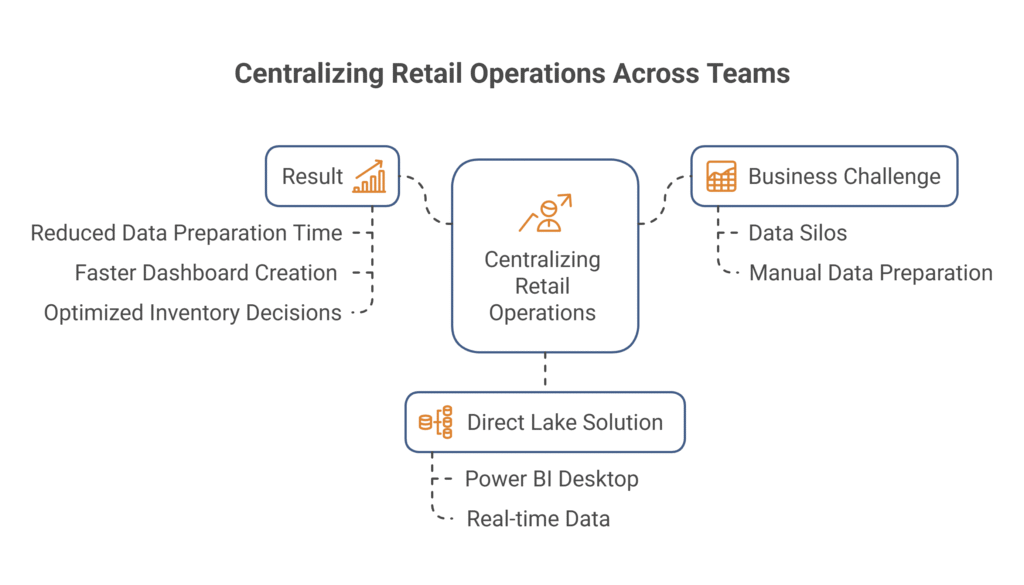
Scenario 1: Centralizing Retail Operations Across Teams
Business Challenge:
In retail, different teams manage data in silos — sales in one lakehouse, inventory in another. As a result, analysts often spend hours manually exporting, merging, and cleaning datasets before they can start reporting.
How Direct Lake Helps:
With a Direct Lake Semantic Model, both sources can be connected in Power BI Desktop — live and in one model. Analysts can track real-time sales against stock levels, flag out-of-stock issues quickly, and optimize reorder cycles without needing IT support or nightly refresh jobs.
Result:
The company reduces data preparation time, speeds up dashboard creation, and makes faster pricing and inventory decisions.
Scenario 2: Unifying Production and Shipping Data in Manufacturing
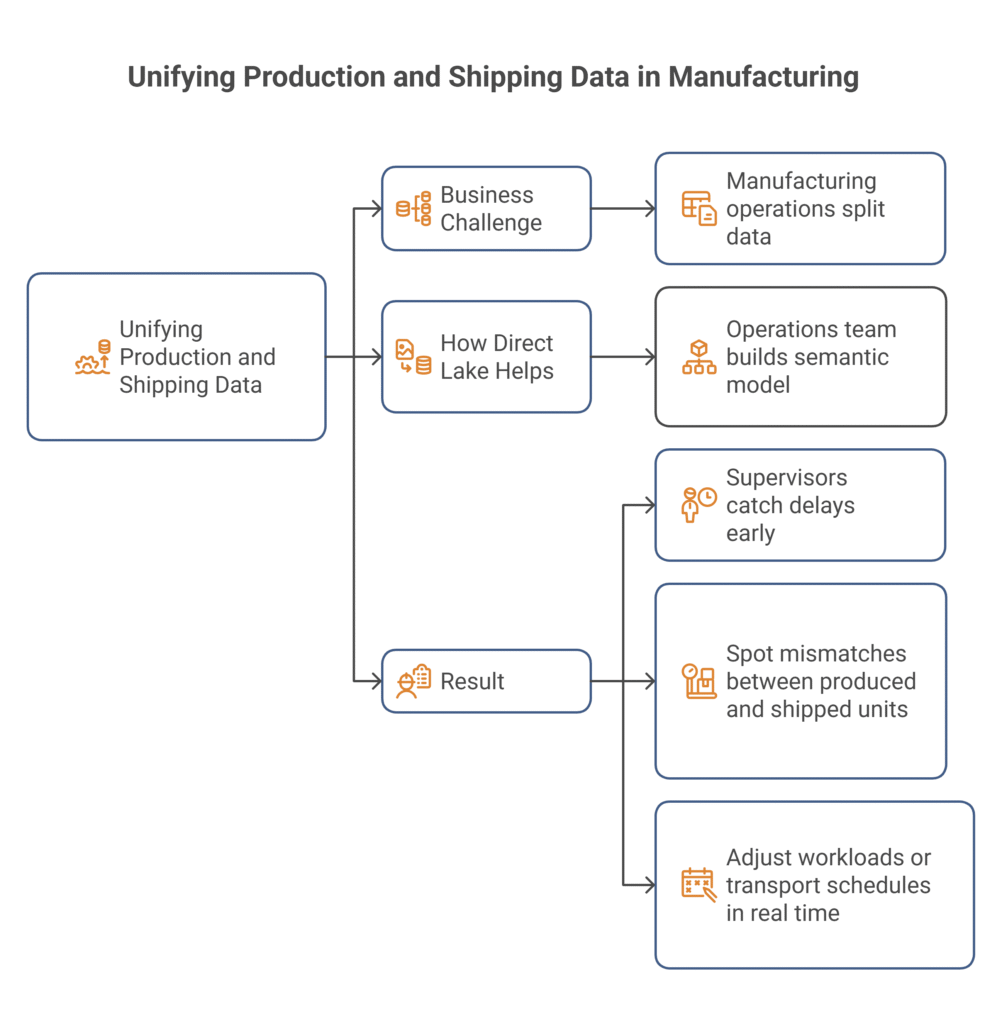
Business Challenge:
Manufacturing operations often split data between systems — production logs in a structured warehouse, and shipping/tracking details in a separate lakehouse. Visibility across this pipeline is difficult and often delayed.
How Direct Lake Helps:
By using Direct Lake mode, the operations team builds a semantic model that combines live data from both sources. They create dashboards showing production timelines next to shipping ETAs — updated instantly.
Result:
Supervisors can catch delays early, spot mismatches between produced and shipped units, and adjust workloads or transport schedules in real time.
Scenario 3: Real-Time Financial Oversight in Multi-Region Organizations
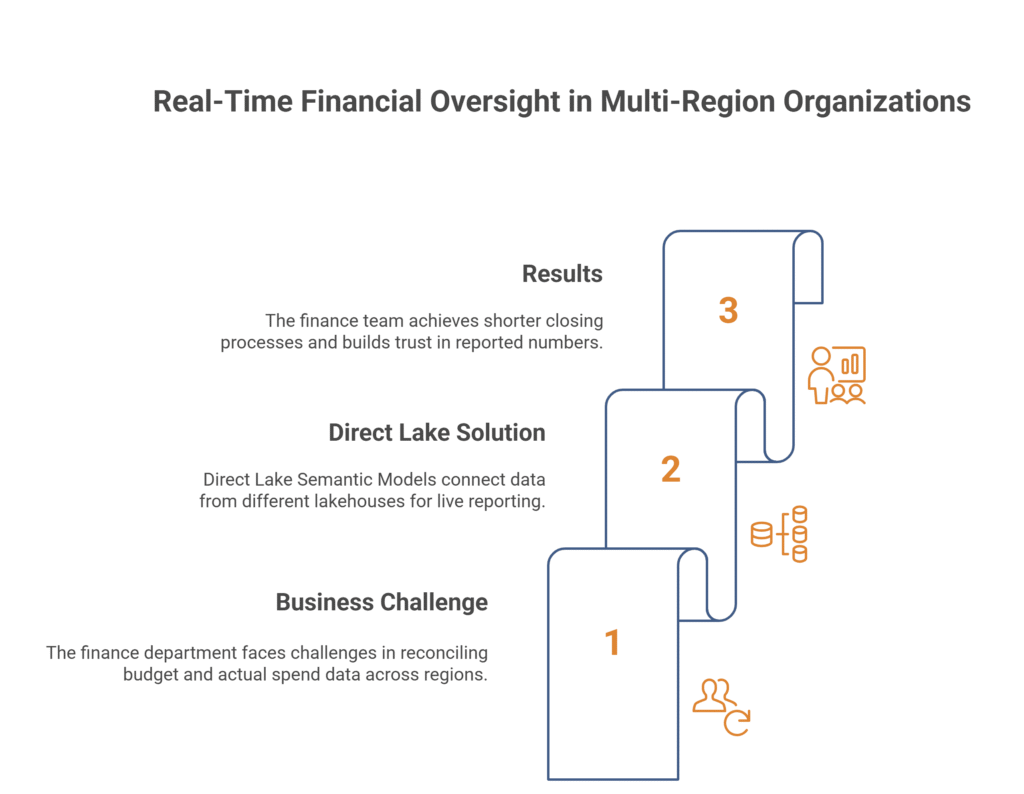
Business Challenge:
The finance department of a multinational company manages budget planning in one data store and actual spend across regional teams in others. Reconciling both for reports involves offline exports, Excel hacks, and coordination between teams.
How Direct Lake Helps:
Direct Lake Semantic Models let them connect both budget and actual spend tables from different lakehouses, building a single live report that shows performance against plan, per region — without duplicating data.
Result:
The finance team shortens month-end closing processes, improves accuracy, and builds trust in the numbers being reported.
Stay Ahead of the Competition with Kanerika’s Advanced Analytics Solutions
Kanerika is a premier data and AI solutions company that helps businesses unlock the full potential of their data with cutting-edge analytics solutions. Our expertise enables organizations to extract fast, accurate, and actionable insights from their vast data estate, empowering smarter decision-making.
As a certified Microsoft Data and AI solutions partner, we leverage the power of Microsoft Fabric and Power BI to develop tailored analytics solutions that solve business challenges and optimize data operations for better efficiency, performance, and scalability.
Whether you need real-time insights, AI-driven analytics, or advanced BI capabilities, Kanerika delivers customized solutions that drive growth and innovation. Our deep expertise in data engineering, visualization, and AI ensures that your business stays ahead in an increasingly data-driven world.
Partner with Kanerika today and transform your data into a strategic advantage for long-term success!
FAQs
How to create a direct lake semantic model?
You use the Fabric portal to create a Direct Lake semantic model in a workspace. It’s a simple process that involves selecting which tables from a single lakehouse or warehouse to add to the semantic model. You can then use the web modeling experience to further develop the semantic model.
How to enable direct lake in Power BI?
Enable preview feature
Live editing semantic models in Direct Lake mode with Power BI Desktop is enabled by default. You can disable this feature by turning off the Live edit of Power BI semantic models in Direct Lake mode preview selection, found in Options and Settings > Options > Preview features.
How to create a semantic data model in Power BI?
Steps to Create a Semantic Model
- Import Data. The first step in building a semantic model in Power BI is importing data from various sources. …
- Define Relationships. After importing data, the next step is to define relationships between tables.
- Create Measures and Calculate Columns.
- Build Hierarchies.
- Publish Model.
What is the difference between semantic model and direct lake?
Semantic models provide a logical and user-friendly structure for data analysis. Direct Lake mode complements this structure by offering quick and direct access to data. In essence, Direct Lake is a fast track to load source data directly into the Power BI engine, ready for analysis.
What is the difference between Delta Lake and Direct Lake?
The main difference is the storage format. Direct Lake can directly read Delta files from OneLake! The Delta storage format is mainly based on top of Parquet. Parquet is a columnar-based storage format which is quite similar to the proprietary one used by Microsoft for Import Mode.
How do you create a data lake in Power BI?
- Connect to Azure Data Lake Storage from Connect Cloud
- Log into Connect Cloud, click Connections and click Add Connection.
- Select “Azure Data Lake Storage” from the Add Connection panel.
- Enter the necessary authentication properties to connect to Azure Data Lake Storage.
- Click Create & Test.


