Power BI stands out as the top data visualization tool, with over 6 million users worldwide. Almost 97% of Fortune 500 companies rely on Power BI to democratize access to valuable data insights – as per Gartner. It is a comprehensive analytics tool developed by Microsoft that offers robust data visualization and business intelligence capabilities, including creating Power BI paginated reports.
Power BI goes beyond simple data visualization tools. It allows you to connect to various data sources, build interactive dashboards, and uncover hidden patterns that can inform strategic decisions. And for those who need highly formatted reports for printing or sharing, Power BI offers the robust functionality of Power BI Paginated Reports, allowing for precise control over layout and design.
Key Takeaways
- Power BI paginated reports deliver print-ready, precisely formatted documents that maintain their layout across different formats
- These reports work best for financial statements, invoices, and regulatory documents where consistent formatting matters
- You can export paginated reports to PDF, Excel, Word, and other formats while preserving the original design
- Organizations use paginated reports to automate scheduled delivery, meet compliance requirements, and create professional customer documents
- Power BI Report Builder now connects to 100+ data sources including Snowflake, Databricks, and AWS Redshift through Power Query integration
Move Beyond Legacy Systems and Embrace Power BI for Better Insights!
Partner with Kanerika Today.
What Are Power BI Paginated Reports?
Power BI paginated reports are a specific type of report within the Power BI ecosystem designed for users who need highly formatted, print-ready outputs. These reports are called “paginated” because they are formatted to fit perfectly on a page, ensuring that the content is organized and easy to read on paper. In contrast to the interactive dashboards and reports created in Power BI Desktop, paginated reports excel at presenting data in a structured, controlled layout ideal for traditional reports like:
- Invoices
- Financial Statements
- Inventory Reports
- Detailed Sales Reports
Effective reporting with Power BI paginated reports allows for detailed, print-ready layouts that can communicate complex information in a structured and easily digestible manner. These reports are particularly valuable when you need precise control over report page layout, making them ideal for financial statements, operational reviews, and regulatory documentation. By leveraging the power of Power BI paginated reports, organizations can ensure that their stakeholders are always well-informed, facilitating smarter, quicker decision-making across all.
Differences Between Power BI Paginated Reports and Power BI Reports
| Criteria | Power BI Paginated Reports | Power BI Reports |
| Purpose | Designed for creating printable, pixel-perfect reports often used for operational reporting. | Focused on interactive data exploration and real-time data visualization. |
| Interactivity | Limited interactivity; mainly used for viewing data and exporting. Parameters can be used to filter data. | Highly interactive with capabilities like drill-through, filtering, and slicing data dynamically. |
| Format & Layout | Fixed layout with precise control over pagination, orientation, and formatting. Suitable for print-ready outputs. | Dynamic layout that adjusts based on the data and user interactions. Not optimized for printing. |
| Data Refresh | Typically set to run on a schedule, not in real-time. Refresh cycles depend on the report configuration. | Can be real-time, with direct queries to live data sources. Supports more frequent refreshes. |
| Export Options | Supports multiple formats like PDF, Word, Excel, and more, maintaining layout and formatting. | Exports are usually in Excel or PowerPoint, and the format might change based on the interactive elements. |
| Visualizations | Limited types of visuals compared to Power BI reports. Focuses on tabular or chart-based visuals that fit well on printed pages. | Supports a wide range of visuals, including advanced chart types and custom visuals from the marketplace. |
| Usage Scenario | Ideal for financial statements, invoices, and other reports where format consistency is crucial. | Best for dashboards and daily business intelligence needs where interaction and data discovery are required. |
| Development Tool | Created using Power BI Report Builder, a separate tool designed specifically for paginated reports. | Created directly in Power BI Desktop or Power BI Service, utilizing a broad set of data modeling and report design features. |
Key Features That Make Power BI Paginated Reports Unique
Power BI paginated reports offer a unique set of features designed to meet specific reporting needs, especially where detailed, well-structured documentation is required. Here are the key features that set them apart:
Power BI paginated reports offer specific features for detailed, structured reporting needs. Here’s what sets them apart.
1. Print Optimization
Paginated reports are designed for printing with pixel-perfect layout control. The format stays consistent when printed, with exact control over page layout, margins, and orientation. Content scales to fit printable pages, which matters for reports that need physical distribution or paper archiving.
- Fixed page sizes that maintain layout integrity across different output formats
- Repeating headers and footers on each page for professional documentation
- Precise positioning of report elements for formal business documents
2. Precise Formatting Control
These reports handle data differently than typical Power BI reports, retrieving data from various sources through queries at runtime. Users control nearly every aspect of appearance, from page sizes and margins to exact positioning of elements.
- Control over page orientation, margins, and report item positions down to the pixel
- Expression-based visibility rules for conditional content display
- Fixed layouts suitable for financial statements and regulatory reports
3. Power Query Integration
Power BI Report Builder now supports connecting to 100+ data sources such as Snowflake, Databricks and AWS Redshift using the Get Data experience. This was made generally available in September 2024.
- Direct connections to cloud data platforms without requiring semantic models
- Transform and filter data using M queries before report generation
- Access to web services and modern data sources previously unavailable
4. Azure Maps Support
Starting with the September 2025 release, paginated reports now use Azure Maps instead of Bing Maps by default. This migration provides enhanced mapping capabilities and long-term support.
- Geographic visualization with updated mapping technology
- Support for multiple map types including road, aerial, and hybrid views
- Integration with spatial data from SQL Server, ESRI shapefiles, and Azure Maps tiles
5. Multiple Export Options
Power BI paginated reports support extensive export formats including PDF, Excel, Word, PowerPoint, and more. The exported reports preserve formatting like alignments, fonts, and colors, so documents look identical across platforms.
- Format preservation across PDF, Excel, Word, and PowerPoint exports
- Consistent appearance regardless of where files are opened
- Support for scheduled email delivery and subscriptions
How Organizations Can Benefit from Power BI Paginated Reports
Power BI paginated reports solve specific business reporting challenges that standard interactive reports can’t handle. Here’s how organizations use them.
1. Generate Detailed Financial Reports
Finance teams need reports that show every transaction, account line, or expense entry. Paginated reports display all data across multiple pages without cutting anything off. Monthly financial statements, balance sheets, and audit reports maintain their structure when printed or exported to PDF. The format stays consistent, which matters for compliance and record keeping.
2. Meet Regulatory Compliance Requirements
Regulated industries need to produce standardized documents for audits and regulatory submissions. Healthcare organizations create HIPAA-compliant patient reports. Financial institutions generate reports for SEC filings or internal audits. The pixel-perfect formatting means every report looks identical, meeting strict documentation standards that regulatory bodies require.
3. Create Professional Invoices and Statements
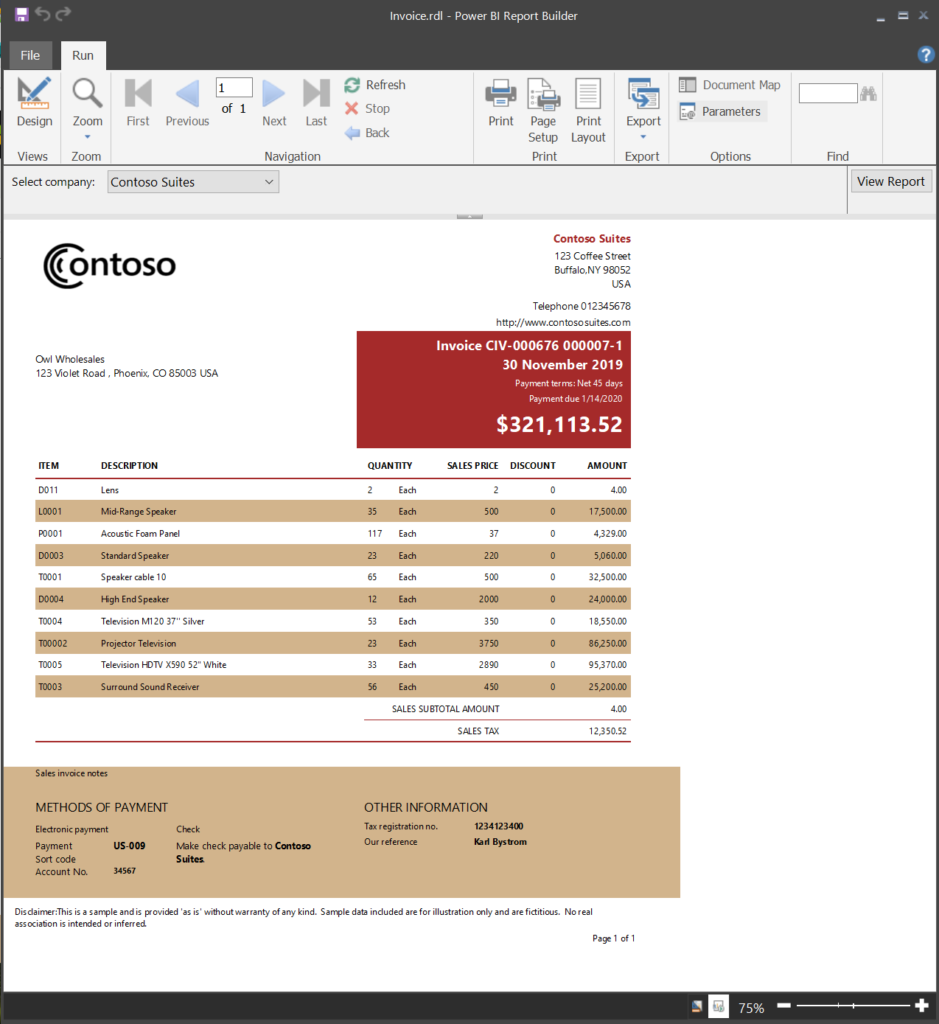
Businesses that send invoices, shipping labels, or customer statements to clients need consistent formatting. Paginated reports let you add company logos, specific layouts, and precise spacing. Each invoice prints correctly with proper page breaks. You can parameterize these reports so they pull data for specific customers or date ranges, then export directly to PDF for distribution.
4. Print Multi-Page Operational Reports
Operations teams often need complete datasets printed for field work, warehouse operations, or offline review. Inventory lists, shipping manifests, and production schedules can run dozens of pages. Paginated reports handle large datasets and split them across pages properly. Headers and footers repeat on each page, making thick printed reports easier to navigate.
5. Automate Report Distribution via Email
Organizations can schedule paginated reports to generate and email automatically. Sales teams receive territory reports every Monday. Executives get weekly performance summaries delivered to their inbox. The subscription feature sends reports to multiple recipients in their preferred format, whether that’s PDF, Excel, or Word. This reduces manual work and keeps stakeholders informed on schedule.
6. Integrate with Legacy Systems and Data Sources
Many organizations still run on older databases or ERP systems. Paginated reports connect directly to SQL Server, Oracle, SAP, and other enterprise data sources. With Power Query integration now available, you can also pull from modern cloud platforms like Snowflake, Databricks, and AWS Redshift. This flexibility means you can create reports without building complex semantic models first.
7. Support Data Exports for External Partners
When sharing data with vendors, partners, or government agencies, organizations need structured exports. Paginated reports export to Excel with proper formatting intact. You can create CSV files for data exchange or Word documents for formal communications. The export maintains data integrity, making it reliable for downstream processing or analysis by external parties.
8. Provide Pixel-Perfect Customer-Facing Documents
Customer-facing documents need to look professional every time. Service companies generate maintenance reports for clients. Real estate firms create property listings with photos and detailed specs. Educational institutions produce transcripts and certificates. Paginated reports give you full control over how these documents appear, ensuring your brand presentation stays consistent.
A Guide to Creating Paginated Reports Using Power BI
Power BI paginated reports offer a powerful tool for crafting highly formatted, print-ready reports that complement the interactive dashboards of standard Power BI reports. This guide will walk you through the steps involved in creating paginated reports using Power BI:
1. Prerequisites
Before diving in, ensure you have the necessary tools:
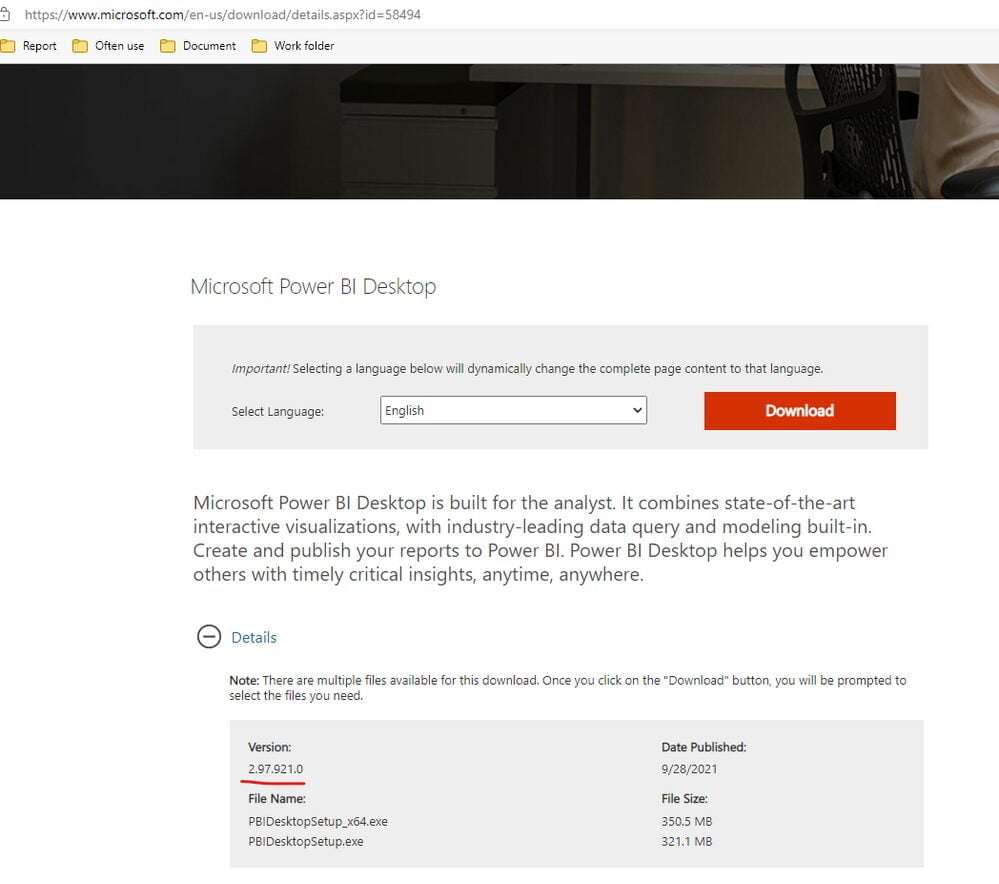
Power BI Desktop: Download and install the latest version of Power BI Desktop.
Power BI Report Builder: While you can create basic paginated reports directly in Power BI Desktop, for advanced features and customization, it’s recommended to download and install Power BI Report Builder. You can find the download link within Power BI Desktop.
2. Creating a New Paginated Report
There are two ways to create a paginated report:
Within Power BI Desktop:
- Open your desired Power BI report.
- Go to the Insert tab.
- In the Visualizations pane, scroll down to the Other section and select Paginated report.
- A window will prompt you to Connect to report or Create a new report. Choose Create a new report.
- This will launch Power BI Report Builder (if installed) with a basic report structure linked to your Power BI data model.
Using Power BI Report Builder:
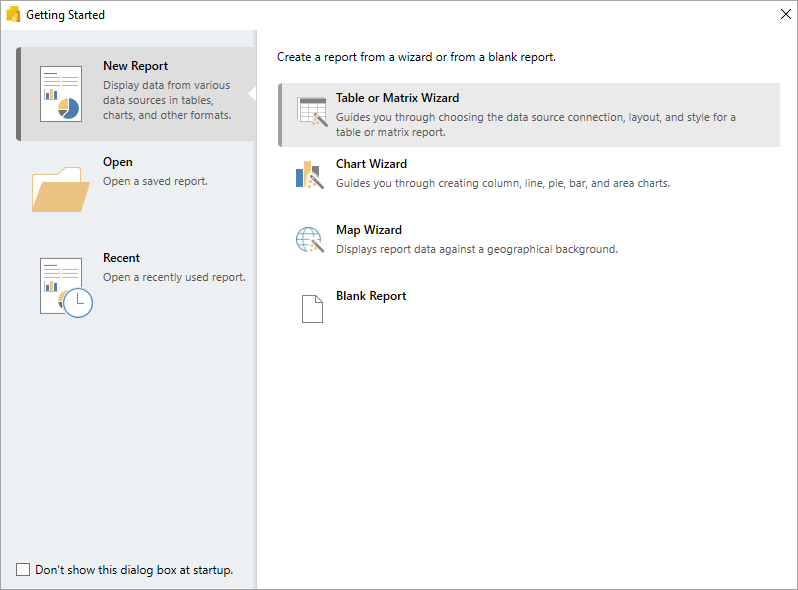
- Open Power BI Report Builder as a standalone application.
- Go to File > New to create a new report.
- In the New Report Wizard, choose the Connect to a Microsoft Power BI Dataset option.
- Select your desired Power BI dataset and click Next.
- Define any necessary filtering options and click Finish.
3. Building Your Report Layout
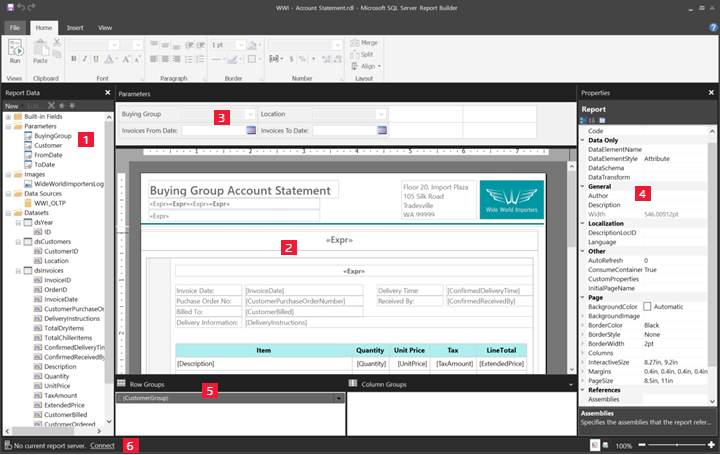
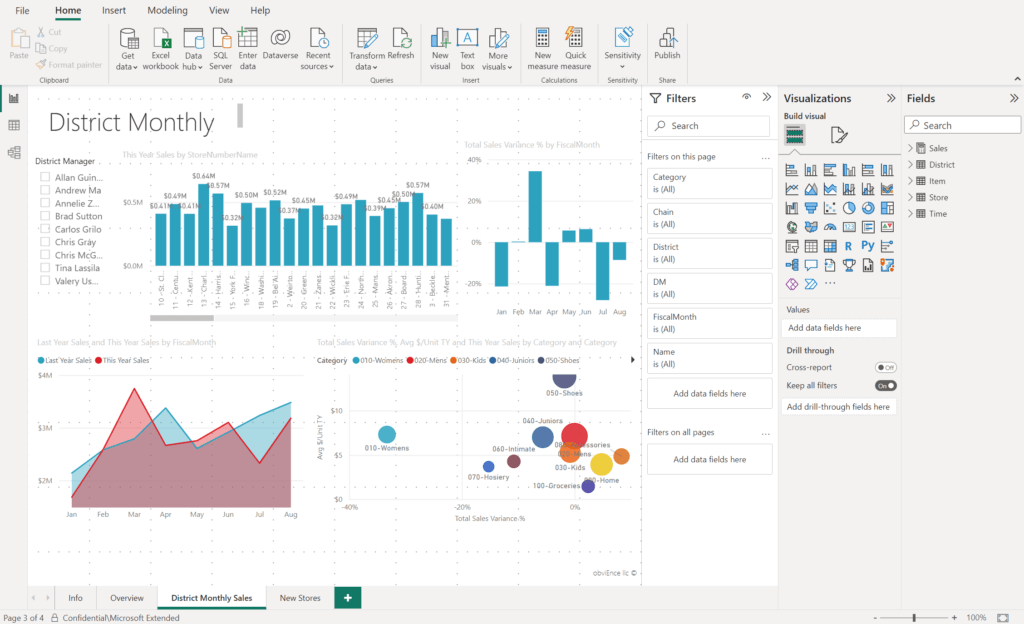
Now comes the heart of creating your report: designing the layout. Power BI Report Builder offers a drag-and-drop interface for adding various elements:
Data Regions: These include tables, matrices, and charts to visually represent your data. You can drag and drop fields from your Power BI dataset into these regions to populate them with data.
Text Boxes: Add static text elements like titles, headers, or labels to provide context and guide the reader.
Images: Embed logos or other relevant images to enhance the visual appeal of your report.
Lines and Shapes: Use lines and shapes to create visual separators or highlight specific sections of your report.
4. Formatting and Design
Once you’ve positioned your elements, customize the look and feel of your report:
Font Styles and Colors: Choose fonts and colors that align with your branding or create a visually appealing aesthetic.
Backgrounds and Borders: Apply backgrounds and borders to visually separate sections or highlight key information.
Conditional Formatting: Use conditional formatting to highlight specific data points or trends within your reports, drawing attention to crucial insights.
5. Publishing and Sharing
Once your report is finalized, you can:
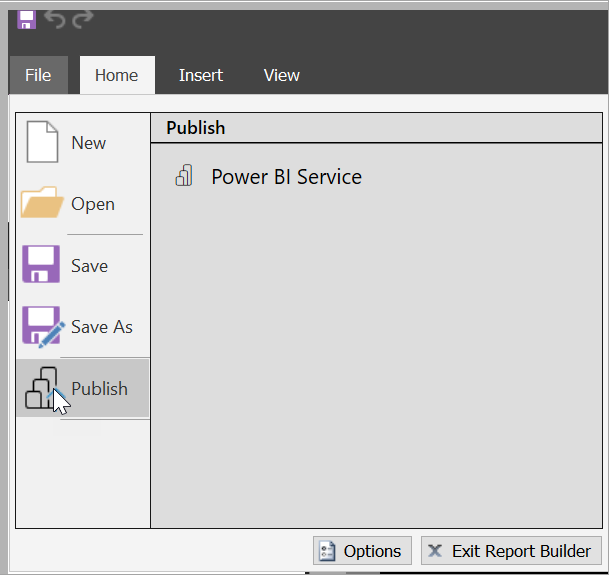
Save the report file (typically .rdl format) for future editing or sharing offline.
Publish the report to the Power BI service (requires a Premium capacity) to share it with colleagues and enable them to view it within the Power BI service.
Interacting with Power BI Paginated Reports
Interacting with paginated reports in Power BI involves several functionalities that enhance the user experience by making navigation, printing, exporting, and setting up subscriptions.
1. Navigating Paginated Reports
Navigating through paginated reports in Power BI is designed to be intuitive, allowing users to easily browse through data pages. The key features include:
Parameter Selection: Users can interact with reports by selecting or entering parameters that filter data, such as dates or regions, which dynamically alter the content displayed.
Page Navigation: Paginated reports come with built-in controls to move between pages. Users can jump to specific pages, move to the next or previous page, or navigate to the first or last page, making it easy to browse large reports.
2. Printing Paginated Reports
Printing is a fundamental feature of paginated reports, given their optimized design for print-readiness:
Print Preview: Before printing, users can preview the report to ensure it appears as expected. This helps in verifying that the formatting and content alignment are correct.
Print Setup: Power BI allows customization of print settings like orientation, page size, and margins, ensuring that the printed report matches the intended layout.
3. Exporting Paginated Reports
Exporting paginated reports allows users to share and utilize reports outside of Power BI in various formats:
Supported Formats: Common export formats include PDF, Excel, Word, PowerPoint, and CSV. Each format serves different needs, from formal presentations (PowerPoint) to data analysis (Excel).
Maintaining Formatting: When exporting reports, Power BI preserves the visual layout and formatting. For instance, exporting to PDF retains the exact visual style, while exporting to Excel maintains the data structure for further analysis.
4. Setting Up Subscriptions for Automated Report Delivery
Subscriptions automate the delivery of paginated reports at scheduled times, improving the efficiency of report distribution:
Email Subscriptions: Users can set up subscriptions to receive reports via email. This can be configured to send reports daily, weekly, monthly, or based on specific triggers.
Attachment Options: Depending on the setup, the report can be attached in various formats like PDF or Excel, allowing recipients to view the report directly from their email without needing to log in to Power BI.
Manage Subscriptions: Users can manage their subscriptions, adjusting frequency, format, and recipients as needed to ensure stakeholders receive the most relevant and up-to-date information.
Power BI Paginated Reports: Advanced Features and Customization
While Power BI paginated reports excel at static, formatted outputs, they offer a surprising array of advanced features and customization options to enhance report usability, engagement, and functionality:
1. Filtering and Interactivity
Filters: Go beyond basic data selection within your Power BI dataset. Create report-level filters that users can interact with to dynamically adjust the report’s view. This allows them to focus on specific subsets of data without needing to modify the underlying dataset.
Parameters: Take user interactivity a step further by defining report parameters. These act as variable inputs that users can set when viewing the report. For example, a parameter could allow users to select a specific date range or department, and the report would adjust the data accordingly.
Drill-Downs: Enhance user exploration by enabling drill-down functionality within tables or charts. Clicking on specific data points can reveal underlying details or navigate users to a more granular view of the data within the same report.
2. Layout and Design Customization
Master Pages: Create reusable page layouts that define the overall structure and branding elements for your reports. This ensures consistency across multiple reports and saves time during development.
Groups and Sorting: Organize your data effectively by applying grouping and sorting functionalities within tables and matrices. This allows users to quickly identify patterns and trends within the data.
Custom Expressions: Leverage the power of expressions to perform calculations, manipulate data, and control the presentation of elements within your report. This enables you to create dynamic elements that adapt based on the data or user interactions.
3. Other Advanced Features
Embedded Code: For complex logic beyond what expressions can handle, you can embed code directly within your report. This allows developers to incorporate custom functionalities using C# or VB.NET code. (Note: Referencing custom DLL files within the report is not supported)
Azure Functions: Take report interactivity to the next level by integrating with Azure Functions. These serverless functions can be triggered by user actions within the report, allowing for real-time data updates, external data access, or triggering workflows based on report data.
Power BI Paginated Reports: Considerations and Troubleshooting
While Power BI paginated reports offer a powerful toolset, creating and maintaining them can present some challenges. Here’s a breakdown of common issues and best practices to ensure your reports function smoothly and deliver value:
Common Issues
- Formatting Issues: Exporting reports to different formats (PDF, Excel) might lead to minor formatting inconsistencies. This can be mitigated by embedding fonts, avoiding overly complex layouts, and testing exports thoroughly.
- Data Source Connectivity: Ensure a stable connection between your report and the underlying Power BI dataset. Data refresh failures can lead to outdated or inaccurate information within the report.
- Report Rendering Errors: Complex reports or those with embedded code might encounter rendering errors. Double-check for syntax errors in expressions or code, and simplify report structure if necessary.
- Limited Interactivity: Remember, paginated reports prioritize formatting over extensive interactivity. While features like parameters and drill-downs exist, they might not offer the same level of interaction as Power BI dashboards.
Troubleshooting Tips
- Preview Mode: Utilize the report preview mode extensively during development to identify and address formatting or layout issues before finalizing the report.
- Error Messages: Pay close attention to error messages displayed within Power BI Report Builder. These often provide valuable clues regarding the source of the problem.
- Community Resources: The Microsoft Power BI community forums are a wealth of information. Search for solutions to common issues or post your specific questions for assistance from experienced users.
Cognos vs Power BI: A Complete Comparison and Migration Roadmap
A comprehensive guide comparing Cognos and Power BI, highlighting key differences, benefits, and a step-by-step migration roadmap for enterprises looking to modernize their analytics.
Best Practices for Maintaining Performance and Quality
1. Optimize Data Models and Queries
Focus on simplifying and optimizing your data models and queries. Efficient queries reduce processing time and improve report responsiveness. Use indexed views or summary tables in your database if querying large datasets.
2. Use Appropriate Visuals
Choose visuals that are suitable for paginated reports. Since these reports are static, complex interactive visuals are unnecessary and can impact performance. Stick to simple, informative visuals like tables, charts, and matrices that render well in printed form.
3. Manage Report Size and Complexity
Avoid overloading a single report with too much data or too many visuals. Break down complex data into multiple reports or pages to improve load times and user experience.
4. Regular Testing and Updates
Regularly test the reports with real data scenarios to ensure they function as expected. Update the reports to accommodate any changes in the underlying data or business requirements and keep the Power BI and Report Builder software up to date.
5. Training and Documentation
Ensure that report creators are well-trained and that comprehensive documentation is available. This can reduce errors in report design and ensure consistent quality across all reports.
6. Monitor and Audit
Use the Power BI service’s monitoring and auditing features to track the usage and performance of your reports. This can help identify which reports are underperforming or are not being used, allowing you to make informed decisions about which reports to optimize or decommission.
How to Migrate from SSRS to Power BI: Enterprise Migration Roadmap
Discover a structured approach to migrating from SSRS to Power BI, enhancing reporting, interactivity, and cloud scalability for enterprise analytics.
Empower Your Business with Kanerika’s Advanced Power BI Reporting Services
As a renowned Microsoft solutions partner for data and AI, Kanerika is your trusted ally in leveraging Power BI to transform your organization’s data reporting capabilities. Our team of experts specializes in designing and implementing robust Power BI solutions, including the seamless integration of paginated reports, to address your unique data visualization and reporting challenges.
Backed by our deep expertise in data management, we offer a comprehensive suite of services that span data integration, analytics, migration, governance, and visualization. By combining the latest technologies, including AI and ML, we automate and enhance your data analytics processes, driving improved business performance and fostering sustainable growth. Experience the difference our advanced Power BI reporting services can make in elevating your organization’s data-driven capabilities.
Drive Operational Excellence with Advanced Power BI Analytics
Partner with Kanerika Today!
Frequently Asked Questions
What is a Power BI paginated report?
Power BI paginated reports are like professional, print-ready documents you create within Power BI. Unlike regular Power BI reports, they’re designed for precise layout and formatting, perfect for invoices, statements, or any report needing a fixed structure. They offer more control over page breaks and visual elements, ensuring a polished, consistent output. Think of them as the formal cousin to interactive dashboards.
What is the difference between SSRS and Power BI paginated reports?
SSRS (SQL Server Reporting Services) paginated reports are designed for precise, print-ready documents with fixed layouts, ideal for formal, complex reports needing exact control over page breaks and formatting. Power BI paginated reports offer similar print-ready functionality but integrate seamlessly with the Power BI ecosystem, leveraging its data connectivity and interactive visualization capabilities. Essentially, SSRS prioritizes precise layout; Power BI emphasizes integration within a broader data analytics platform.
What is the difference between a paginated report and a dashboard?
Paginated reports are like detailed, printed documents – ideal for precise data analysis and archiving. Dashboards, conversely, are dynamic visual summaries showing key metrics at a glance. Think of a dashboard as a high-level overview, while a paginated report provides the granular details supporting that overview. They serve different purposes and have distinct presentation styles.
What are the five types of Power BI reports?
Power BI doesn’t rigidly categorize reports into *five* specific types. Instead, it offers flexible report creation allowing diverse visualizations. Think of it as building blocks: you combine charts, tables, maps, etc. to create reports tailored to specific needs (e.g., dashboards, paginated reports). The ‘type’ emerges from the *purpose* and design, not a predefined classification.
What are DAX formulas?
DAX formulas are the secret sauce of Power BI and other data analysis tools. They’re essentially custom calculations that let you manipulate and analyze data within your reports, going beyond simple sums and averages. Think of them as mini-programs built directly into your data model, allowing you to create powerful insights from complex datasets. They use a syntax similar to Excel but are far more powerful for data modeling.
What is the limit of paginated report?
Our paginated reports don’t have a fixed page limit, but performance can degrade with extremely large reports. Think of it like a very long document – it’ll take longer to generate and potentially strain resources. We recommend optimizing your report design for efficiency if dealing with extensive data. For truly massive datasets, consider alternative reporting approaches.
What are the data types of DAX?
DAX offers several data types to handle different kinds of information in your Power BI models. These range from simple types like numbers (integers, decimals) and text to more complex ones such as dates, booleans (true/false), and tables. Understanding these data types is crucial for writing efficient and accurate DAX formulas. Choosing the correct data type ensures your calculations produce reliable results.
What is the purpose of Power BI report Builder?
Power BI Report Builder lets you create highly customized and complex reports, going beyond what’s easily done in the main Power BI desktop. It’s ideal for intricate data visualizations and analyses requiring specific formatting or advanced features. Think of it as a powerful tool for expert report creation, offering granular control over every detail. Essentially, it’s for building reports that demand precision and extensive customization.
What is the meaning of paginated?
Paginated means something is divided into numbered pages, like a book. Think of it as a structured way to organize information, ensuring each section has its own unique identifier. This makes finding specific content much easier than in an unstructured document. Essentially, it’s the opposite of a continuous scroll.
What is the purpose of Power BI reports?
Power BI reports distill complex data into easily digestible visuals. They transform raw numbers and facts into actionable insights, revealing trends and patterns hidden within your data. Ultimately, they help you make better, data-driven decisions across your organization, improving efficiency and strategy. Think of them as your data’s personalized storytellers.
What is the size of a paginated report in Power BI?
A Power BI paginated report’s size isn’t fixed like a single file; it depends on the report’s complexity (data volume, visuals, etc.). Think of it as a blueprint – the file itself is relatively small, but the rendered output (what the user sees) can be huge if the report generates many pages of complex data. The actual file size mainly reflects the report definition, not the rendered data.
How to share paginated reports in Power BI?
Sharing paginated reports in Power BI isn’t like sharing regular reports. You distribute them primarily through the Power BI service, embedding them in portals, or distributing the .pdf exports directly. Access is controlled through workspace permissions and potentially URL restrictions. Think of them as sophisticated, printable documents rather than interactive dashboards.
How many pages can a Power BI report have?
There’s no fixed page limit in Power BI reports. You can create as many pages as your data and storytelling needs require. However, excessively large reports can become unwieldy for users. Strive for clarity and efficient navigation rather than endless pages.
What is the timeout for paginated reports in Power BI?
Power BI paginated reports don’t have a fixed timeout; instead, their processing time depends on report complexity and server resources. Essentially, there’s no preset limit, but excessively long-running reports might be interrupted by the server. Consider optimizing your report’s data queries and design to prevent timeouts.


