Business Intelligence (BI) is no longer a novelty for businesses. Once considered only accessible to large companies, BI tools have become a mainstay for businesses of all sizes. As the world consumes and shares more data every year, it has become essential for companies to manage and draw actionable insights from their data. We have compiled a collection of the most compelling and insightful business intelligence statistics, so you don’t have to go and research them yourself!
These statistics offer valuable insights into the current state and trends of the BI industry, as well as the potential benefits and challenges of adopting BI strategies. Let us know which of these impressed you the most!
5 Business Intelligence Statistics That Will Define 2024
The Global Business Intelligence Market is Growing Rapidly
In 2022, the global business intelligence market was valued at USD 27.11 billion. It is poised to grow at about 9% annually and touch almost $30 billion in the current year. The projection for 2030 is $54 billion. There is a huge demand for real-time analytics, which is one of the key drivers for growth.

In 2022, the global business intelligence market was valued at USD 27.11 billion.
One in Three US businesses Set to Adopt Decision Intelligence
A recent study has revealed that a significant proportion of large-scale organizations – one-third, to be precise – are set to embrace decision intelligence by 2023.
The study further highlights that the primary reason for adopting this innovative approach is to improve the quality of decision-making. Alongside this, other motivating factors for adoption include reducing costs, improving customer service, and boosting revenue.
Decision intelligence is a cutting-edge process that utilizes data and analytics to help organizations make better decisions.
The Adoption Rate of Business Intelligence Stands at 26%
The adoption rate of Business Intelligence (BI) is positively correlated with the size of a company.
Specifically, organizations with 5,000 or more employees are more likely to have 80% or higher adoption rates.
On the other hand, smaller organizations are more likely to exhibit lower adoption rates. Indeed, 22% of companies with 250 or fewer employees have BI adoption rates of 20% or less, compared to just 2% of companies with 5,000 or more employees.
These findings suggest that larger organizations increasingly recognize the value of BI in generating meaningful insights and driving strategic decision-making processes. Meanwhile, smaller organizations may face challenges in implementing and integrating BI tools due to budgetary constraints.
More Than Half of All Data is Never Utilized
Recent studies by Accenture have shown that a staggering amount of enterprise data goes unanalyzed. In fact, between 60 and 73 per cent of all data generated by enterprises is never subjected to any form of analysis.
This means that a significant portion of potentially valuable insights is left untapped. This results in lost opportunities for organizations to drive growth, improve efficiency, and gain a competitive advantage. Companies must prioritize data management and invest in the necessary infrastructure, tools, and talent to unlock the value of their data. Failure to do so could result in missed opportunities to generate insights that could drive innovation.

Three-quarters of Employees Feel Overwhelmed by Data
A lack of data skills is hindering workplace productivity. Despite the increased availability of data, 74 per cent of employees report feeling overwhelmed or unhappy when working with it.
As a result, their performance is negatively affected, with more than a third of overwhelmed employees globally admitting to procrastinating over data-related tasks for at least an hour each week. These negative feelings often lead to employees avoiding data altogether, with many opting to find alternative methods to complete tasks.
This presents a significant challenge for companies seeking to build a data-driven culture. Reluctance to work with data limits the potential insights and benefits that can be derived from it.
Foundations of Business Intelligence
Business Intelligence (BI) is a process of analyzing data and converting it into actionable insights to help businesses make informed decisions. BI can help organizations to identify trends, patterns, and insights that can drive business growth. In this section, we will discuss the foundations of BI, including data management and data warehousing.
Data Management
Data management is a crucial aspect of BI. It involves the collection, storage, processing, and analysis of data. To make informed decisions, organizations need to ensure that the data they collect is accurate, complete, and relevant. Data management involves the following steps:
- Collection: The process of collecting data from various sources, including internal and external sources
- Storage: The process of storing data in a secure and accessible location
- Processing: The process of transforming data into a usable format
- Analysis: The process of analyzing data to identify trends, patterns, and insights
Data Warehousing
It is another important aspect of BI. It involves the process of collecting, storing, and managing data from various sources. Data warehousing allows organizations to store large amounts of data in a centralized location, making it easier to access and analyze. Data warehousing involves the following steps:
- Data Extraction: The process of extracting data from various sources and transforming it into a usable format
- Data Loading: The process of loading data into a data warehouse
- Data Transformation: The process of transforming data into a format that is suitable for analysis
- Data Analysis: The process of analyzing data to identify trends, patterns, and insights
In conclusion, data management and data warehousing are critical components of BI. By effectively managing and analyzing data, organizations can gain valuable insights that can drive business growth.

Business Intelligence Statistics Concepts
Business Intelligence (BI) is the process of analyzing data and turning it into actionable insights. It involves the use of statistical methods, tools, and techniques to extract meaningful information from raw data. BI statistics concepts can be broadly classified into three categories: Descriptive Analytics, Predictive Analytics, and Prescriptive Analytics.
Descriptive Analytics
Descriptive analytics involves the use of statistical methods to describe and summarize data. It helps in understanding historical data and identifying patterns and trends. Some common examples of descriptive analytics include mean, median, mode, variance, standard deviation, and frequency distribution.
One way to represent descriptive analytics is through a frequency distribution table. This table shows the number of times each value occurs in a dataset. It can help you identify the most common values and outliers in the data.

Predictive Analytics
Predictive analytics involves the use of statistical methods to make predictions about future events. It helps in identifying patterns and trends in historical data and using them to make predictions about future outcomes. Some common examples of predictive analytics include regression analysis, time series analysis, and machine learning algorithms.
One way to represent predictive analytics is through a scatter plot. This plot shows the relationship between two variables in a dataset. It can help you identify the direction and strength of the relationship between the variables.
Prescriptive Analytics
Prescriptive analytics involves the use of statistical methods to make decisions about future events. It helps in identifying the best course of action based on historical data and predictions. Some common examples of prescriptive analytics include optimization algorithms, decision trees, and simulation models.
One way to represent prescriptive analytics is through a decision tree. This tree shows the possible outcomes of a decision and the probability of each outcome. It can help you identify the best decision based on the available options and their probabilities.
In conclusion, BI statistics concepts are essential for businesses to make informed decisions based on data. Descriptive analytics helps in understanding historical data, predictive analytics helps in making predictions about future events, and prescriptive analytics helps in making decisions about future events. By using these concepts, businesses can gain a competitive advantage and improve their bottom line.

Data Visualization Techniques
When it comes to Business Intelligence statistics, data visualization techniques are essential. They help you to understand your data and communicate it to others in a way that is easy to understand. In this section, we will discuss two important data visualization techniques: Dashboard Design and Data Storytelling.
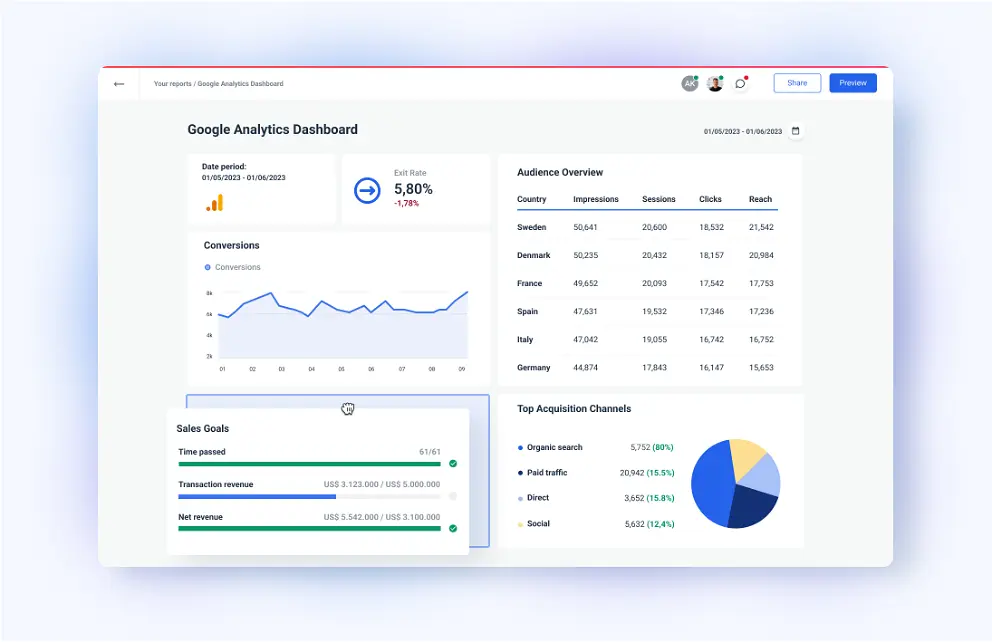
Dashboard Design
Dashboards are an essential tool for Business Intelligence. They provide a visual representation of your data, allowing you to see trends and patterns quickly. When designing a dashboard, it is important to keep in mind the following best practices:
- Keep it simple: Don’t overload your dashboard with too much information. Focus on the most important metrics and KPIs
- Use clear and concise labels: Make sure your labels are easy to read and understand
- Choose the right visualizations: Use the appropriate visualization for each data point. For example, use a line chart for trends over time, and a pie chart for proportions
Data Storytelling
Data storytelling is the art of using data to tell a story. It is a powerful technique for communicating complex data in a way that is easy to understand. When using data storytelling, keep the following tips in mind:
- Know your audience: Tailor your story to your audience. Use language and visuals that they will understand
- Keep it simple: Don’t overwhelm your audience with too much information. Focus on the most important points
- Use visuals: Use charts, graphs, and other visualizations to help tell your story
In conclusion, using effective data visualization techniques is essential for Business Intelligence statistics. By following best practices for dashboard design and data storytelling, you can effectively communicate your data and make informed decisions.
Advanced Statistical Methods
If you want to take your business intelligence to the next level, you need to incorporate advanced statistical methods. These methods can help you discover patterns and relationships in your data that you might not have been able to find otherwise. In this section, we’ll explore two advanced statistical methods: machine learning integration and big data analytics.
Machine Learning Integration
Machine learning is a type of artificial intelligence that allows systems to learn and improve from experience without being explicitly programmed. By integrating machine learning into your business intelligence, you can gain insights that might have been impossible to uncover using traditional methods.
One way to integrate machine learning into your business intelligence is by using predictive modeling. Predictive modeling uses historical data to make predictions about future events. For example, you could use predictive modeling to forecast sales for the next quarter based on past sales data.
Another way to integrate machine learning is by using clustering analysis. Clustering analysis is a technique that groups similar data points together. This can be useful for identifying patterns in customer behavior, for example.

Big Data Analytics
Big data analytics is the process of examining large and complex data sets to uncover hidden patterns, correlations, and other insights. This can be especially useful for businesses with massive amounts of data, such as those in the tech industry.
One way to perform big data analytics is by using distributed computing frameworks like Apache Hadoop. These frameworks allow you to process large amounts of data across multiple machines.
Another way to perform big data analytics is by using data visualization tools. Data visualization tools can help you make sense of large amounts of data by presenting it in a visual format, such as a chart or graph.
By incorporating advanced statistical methods like machine learning integration and big data analytics into your business intelligence, you can gain insights that might have been impossible to uncover using traditional methods.
BI Tools and Applications
When it comes to Business Intelligence (BI), there are a variety of tools and applications available to help you analyze and visualize your data. In this section, we’ll take a look at two popular types of BI solutions: self-service BI tools and cloud-based BI solutions.
Self-Service BI Tools
Self-service BI tools are designed to be user-friendly, allowing non-technical users to analyze and visualize data without the need for IT assistance. These tools typically offer drag-and-drop interfaces, pre-built templates, and other features that make it easy to create reports and dashboards. Some popular self-service BI tools include:
- Microsoft Power BI: A cloud-based BI tool that offers a range of features, including data modeling, data visualization, and collaboration tools
- Tableau: A data visualization tool that allows users to create interactive dashboards and reports
- QlikView: A BI tool that offers in-memory data processing and a range of visualization options

Cloud-Based BI Solutions
These solutions are becoming increasingly popular, as they offer a range of benefits over traditional on-premises solutions. Cloud-based BI solutions are typically more flexible and scalable than on-premises solutions, and they can be accessed from anywhere with an internet connection. Some popular cloud-based BI solutions include:
- Amazon Web Services (AWS) QuickSight: A cloud-based BI tool that offers data visualization and reporting features.
- Google Cloud Platform (GCP) BigQuery: A cloud-based data warehousing and BI tool that allows users to analyze large datasets.
- Microsoft Azure: A cloud-based platform that offers a range of BI tools and services, including Power BI and Azure Analysis Services.
Overall, there are many BI tools and applications available to help you analyze and visualize your data. Whether you choose a self-service BI tool or a cloud-based BI solution, it’s important to choose a solution that meets your specific needs and requirements.
Kanerika: Your Trusted Business Intelligence Partner
At Kanerika, we pride ourselves on being a reliable partner in business intelligence (BI), offering all-inclusive solutions that meet the intricate requirements of companies in data analytics and visualization. Our commitment to maximizing Microsoft Power BI‘s capabilities helps our clients to quickly and easily convert unstructured data into insightful, actionable intelligence. A key component of our BI offerings, Power BI is renowned for its extraordinary data processing, visualization, and networking capabilities. But we are more than simply a one-tool expert. We are adept at employing a wide range of business intelligence (BI) tools and systems, making sure that our customers can successfully traverse and comprehend their data environments. Our multifaceted approach makes our ability to provide bespoke, scalable, and dynamic BI solutions that enable our clients to make wise decisions, streamline processes, and spur expansion possible.