TL;DR
Data analytics for pharma development pays off most in trial enrollment, site monitoring, safety signals and batch quality, where decisions repeat weekly. For trial and safety analysis, pick validated statistical tools such as SAS, R or Python over general dashboards. For cross-functional reporting, pick one platform such as Microsoft Fabric, Databricks or Snowflake, topped with Power BI, Tableau or Qlik Sense.
Use machine learning only on large data, and document each model’s context of use as FDA’s January 2025 draft guidance asks. Any analysis that feeds a GxP decision needs audit trails, access control and validation under 21 CFR Part 11. Start with one decision and its metric, baseline it, then expand to the next use case.
Key Takeaways
- Analytics earns its keep on repeated decisions such as site selection, enrollment forecasting, central monitoring, safety signals, batch release and gross-to-net.
- Match the method to the decision, with statistics for small trials, machine learning for large repeated data and generative AI for text under human review.
- Unify EDC, CTMS, safety, quality and ERP data on one governed platform before adding AI, because every model inherits source errors.
- Separate exploratory analytics from validated analytics, since only the validated path needs Part 11 audit trails and formal validation.
- Measure ROI against a baseline of the decision metric, captured before the build starts.
- A US pharma company that unified Model N, SQL Server, SAP and SAP Vistex data on Microsoft Fabric cut data-related errors by 78%.
Two Systems, Two Enrollment Numbers, One Data Review
It is Monday afternoon, and the interim data review is on Friday. Clinical operations exports enrollment from the clinical trial management system (CTMS) and gets one count of randomized patients.
Data management runs the same query against the electronic data capture (EDC) system and gets a smaller number. Both are right. The CTMS logs a patient when the site reports the visit, while the EDC counts the patient once the case form is entered.
Three days go to spreadsheets, and nobody reaches the real question of whether the slow sites need help or a replacement.
That week shows why data analytics for pharma development is hard and why it pays. The data exists, but it sits in systems built for different jobs and owned by different teams.
This guide covers where analytics pays off across the drug lifecycle and which methods and tools fit each job. It also shows how to build it without breaking compliance.
What Data Analytics for Pharma Development Means
Data analytics for pharma development turns research, clinical, safety, manufacturing and commercial data into decisions that move a medicine from lab to patient. For example, it covers everything from an enrollment dashboard to a model that predicts which patients may drop out of a trial.
Pharma data is harder to work with than data in most industries, for three reasons. First, it is regulated, so the records behind a GxP decision must be attributable and traceable. Second, the data is siloed, because each function bought its own system. Finally, it is long-lived, since a molecule can spend many years in development and its data must stay usable the whole time.
That is why slow or poorly informed decisions are so expensive here. Deloitte’s 2026 study of 20 large biopharma companies put the average cost to develop one drug at $2.67 billion in 2025 (Deloitte, 2026). That was up from $2.23 billion in 2024, and it includes the cost of programs that failed. Analytics will not shrink the cost on its own, but it helps teams spend it on the right trials, sites and batches.
The Four Types of Analytics, With a Pharma Example Each
Analysts usually group analytics into four types, and each one also answers a different question. The value grows as you move from describing the past to recommending an action, yet each type depends on the one before it being trustworthy. Our guide to AI predictive analytics covers the predictive step in more depth.
For example, take a single Phase 3 trial. A descriptive dashboard shows enrollment by site, and a diagnostic view explains why one region lags. A predictive model then flags patients who may drop out, while a prescriptive tool suggests where to send the next drug supply.
| Type |
Question it answers |
Pharma example |
Typical data |
| Descriptive |
What happened? |
Enrollment by site and country |
CTMS, EDC |
| Diagnostic |
Why did it happen? |
A site under-enrolls because of strict exclusion criteria |
Screening logs, feasibility data |
| Predictive |
What is likely next? |
Patients at risk of dropping out |
Visit history, adverse events |
| Prescriptive |
What should we do? |
Where to open sites or allocate drug supply |
Enrollment forecasts, supply plans |
Where Pharma Data Comes From
Before any analysis starts, it helps to know which system holds which data and who owns it. In most pharma companies, each function also runs its own separate system.
In practice, that ownership matters more than the technology. When an analyst wants to join safety cases to trial visits, the request crosses two departments, two validation scopes and often two vendors. Good data integration tools handle the technical join, while the ownership question needs a named data steward on each side.
| System |
What it holds |
Typical owner |
| EDC |
Case report form data from trial sites |
Clinical data management |
| CTMS |
Sites, visits, enrollment and milestones |
Clinical operations |
| LIMS and ELN |
Lab results, assay data and experiment notes |
Research and QC labs |
| Safety database |
Adverse event cases and narratives |
Pharmacovigilance |
| MES and QMS |
Batch records, deviations and CAPAs |
Manufacturing and quality |
| ERP |
Inventory, cost and supply |
Finance and supply chain |
| CRM and contracting |
Accounts, contracts, rebates and chargebacks |
Commercial and market access |
| Real-world data |
Claims, electronic health records and registries |
Medical affairs and outcomes research |
With that map in hand, the next question is which decisions deserve analytics first. The answer changes by stage of the lifecycle, so the next section walks through each one.
Kanerika Service
Data Analytics for Pharma and Life Sciences
Kanerika connects clinical, quality and commercial systems into one governed analytics platform, so pharma teams can trust the numbers behind each decision.
Explore Pharma Solutions
Where Data Analytics for Pharma Development Pays Off: Use Cases Across the Drug Lifecycle
A use case is worth funding when it improves a decision that repeats and has a measurable outcome. The seven below run from first assay to contract renewal, and each names the decision, the data behind it and the metric to watch.
Notice that the data changes at every stage while the pattern stays the same. Someone makes the same call again and again, and analytics makes that call faster or better informed.
Discovery and Preclinical Research
Early research generates large volumes of assay, screening and literature data. The repeated decision is which compounds and targets deserve the next round of spending, so analytics ranks candidates by potency, selectivity and early safety signals.
Most of this data, however, sits in the LIMS and electronic lab notebooks, often in formats that differ by instrument and by lab. Standardizing those formats is therefore usually the first real project. A useful metric is cycle time from hit to lead. Also track the share of candidates that later fail for reasons the early data could have shown. For model-level depth, see our guide to AI in drug discovery.
Clinical Trial Design, Site Selection and Enrollment
Enrollment is where many trials lose months, so it makes a strong first use case. To fix that, feasibility analytics combines site performance history, patient population data and protocol criteria to predict which sites will actually recruit.
Once the trial is running, an enrollment forecast compares actual randomizations against plan by site and country. When a site falls behind, the team can add support or open a backup site weeks before a monthly report would show the gap. The metrics to watch, then, are screen-failure rate, time from site activation to first patient, and forecast accuracy.
Trial Monitoring and Risk-Based Quality Management
Traditional monitoring sent staff to every site to check every data point. Central monitoring uses analytics instead to spot sites whose data looks unusual, such as very low adverse event rates or identical vital signs across visits. For the data-cleaning side of the same work, see our guide to AI in clinical data management.
Regulators also support the shift. ICH E6(R3), which FDA issued as final guidance in September 2025, encourages quality management that is proportionate to risk (FDA, E6(R3) Good Clinical Practice). In practice, teams define risk indicators (KRIs) for each study, set thresholds and review flagged sites on a fixed cadence. The metric to watch, then, is how many issues central review finds before an on-site visit does.
Pharmacovigilance and Safety Signal Detection
Safety teams receive adverse event reports from trials, spontaneous reports, literature and partners. Analytics helps with two jobs here. The first is triage, so serious cases reach a reviewer first. The second is detecting signals across the whole case database, so that a pattern no single report shows still reaches a reviewer.
Signal detection, for example, often relies on disproportionality analysis, which tests whether a drug and an event appear together more often than expected. Statistics flags the pair, and a safety physician still judges whether the signal is real. Useful metrics are case processing time and the time from first report to signal evaluation.
Real-World Evidence and Post-Market Studies
FDA draws a clear line between two terms that often get mixed up. Real-world data (RWD) is health data collected outside trials, such as claims, electronic health records and registries. Real-world evidence (RWE), by contrast, is the clinical evidence about a product’s usage, benefits and risks that comes from analyzing that data (FDA, Real-World Evidence).
FDA created its RWE framework in 2018, following the 21st Century Cures Act of 2016. Since then, sponsors have used RWE for post-market safety studies and questions about new uses of an approved product. The analytics challenge is mostly data quality and bias, because claims and health records were never designed for research. So track completeness of the core variables before trusting any result.
Manufacturing Quality and Batch Analytics
In manufacturing, the repeated decision is whether a batch is right first time and, if not, why. To answer it, batch analytics links process parameters from the MES, test results from the LIMS and deviations from a laboratory quality management system. Quality teams can then see which variables move yield and which ones tend to precede a deviation.
Continued process verification (CPV) then turns this into routine trend monitoring across batches. Watch deviation rate per batch, right-first-time rate and time to close investigations. Because these records support CGMP decisions, they fall under FDA’s data integrity expectations, which the compliance section below covers.
Commercial, Market Access and Contracting
Analytics does not stop at approval. Commercial teams manage gross-to-net, the gap between a product’s list price and what the company keeps after rebates, chargebacks and discounts.
That data typically lives in contracting and revenue management systems such as Model N or SAP Vistex, alongside ERP and sales data. Joining them shows which contracts leak margin, which chargebacks are disputed and how a launch is tracking by account. The metrics are gross-to-net accuracy, rebate accrual variance and days to close the month.
Watch on YouTube
How Microsoft Fabric Improved Sales & Financial KPIs for a Leading Pharma Manufacturer
A short Kanerika video on how a pharma manufacturer joined the sales, contract and financial data behind gross-to-net on Microsoft Fabric, and got KPI reports it could rely on.
The table below pulls the seven use cases together, so you can see the decision, data and KPI for each stage side by side.
| Stage |
Decision improved |
Main data |
KPI to watch |
| Discovery |
Which compounds advance |
LIMS, ELN, assay data |
Hit-to-lead cycle time |
| Trial design and enrollment |
Which sites to open or support |
CTMS, feasibility data |
Time to first patient |
| Monitoring |
Which sites need attention |
EDC, KRIs |
Issues found centrally |
| Safety |
Which signals to evaluate |
Safety database, literature |
Case processing time |
| Real-world evidence |
Whether RWD can answer the question |
Claims, EHR, registries |
Completeness of core variables |
| Manufacturing |
Why batches deviate |
MES, LIMS, QMS |
Right-first-time rate |
| Commercial |
Which contracts leak margin |
Model N, SAP Vistex, ERP |
Gross-to-net accuracy |
Commercial data is often the easiest place to prove value, because its owners are clear and its outcomes are measured in money.
Which Analytics Methods Fit Which Pharma Decision
Choosing a method comes down to fit with the decision and the data. Classical statistics, machine learning and generative AI each solve different problems, and in pharma each also carries a different validation load.
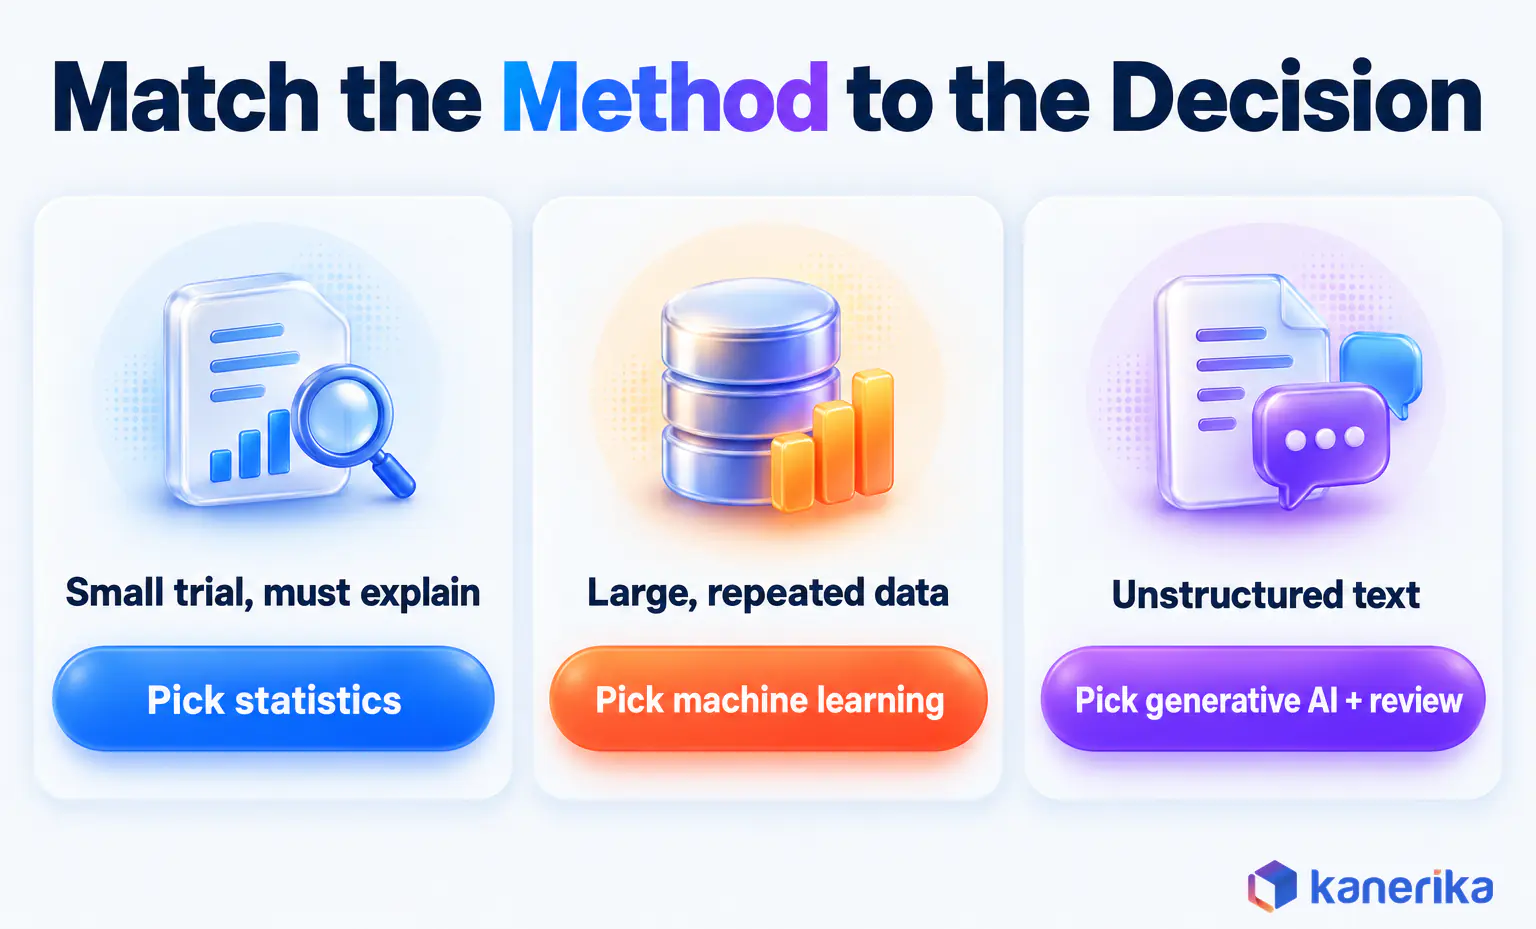
Statistics remains the default for trial analysis because samples are small, endpoints are pre-specified and regulators expect methods they can reproduce. Machine learning, by contrast, fits large, repeating patterns, such as enrollment across hundreds of sites or drift across thousands of batch records. Generative AI is strongest with text, such as drafting case narratives or summarizing literature, if a qualified person reviews every output.
Sometimes AI is simply the wrong tool. For instance, with a few dozen patients in a rare disease trial, a model has too little data to learn from. When a decision must be explained line by line to an inspector, a simpler model that people can audit often beats a black box.
What FDA Expects When AI Does Fit
Regulators are also setting expectations for the cases where AI does fit. In January 2025, FDA published a draft guidance on using AI to support regulatory decision-making for drugs and biological products (FDA draft guidance, docket FDA-2024-D-4689). It asks sponsors to define the model’s context of use, assess the model’s risk and show evidence of its credibility.
The guidance is non-binding and still a draft, yet it works as a checklist for any model that touches a submission. Pair it with clear AI compliance controls and a view of what AI for pharma teams looks like in production.
| Scenario |
Approach |
Why |
Evidence needed |
| Primary endpoint analysis in a Phase 3 trial |
Pre-specified statistics in SAS or R |
Small sample, must be reproducible |
Statistical analysis plan, validated code |
| Enrollment forecasting across many sites |
Machine learning |
Large, repeated data |
Back-tested forecast accuracy |
| Batch drift across many lots |
Statistical process control, then machine learning |
Continuous, repeated data |
CPV trend records |
| Adverse event narratives and literature |
Generative AI with human review |
Unstructured text |
Review logs, sampled error rates |
| Rare disease trial with few patients |
Statistics or Bayesian methods, no machine learning |
Too little data to train |
Documented assumptions |
For a wider view of where these methods are heading outside pharma, see our roundup of broader data analytics trends.
Data Analytics Tools and Platforms for Pharma in 2026
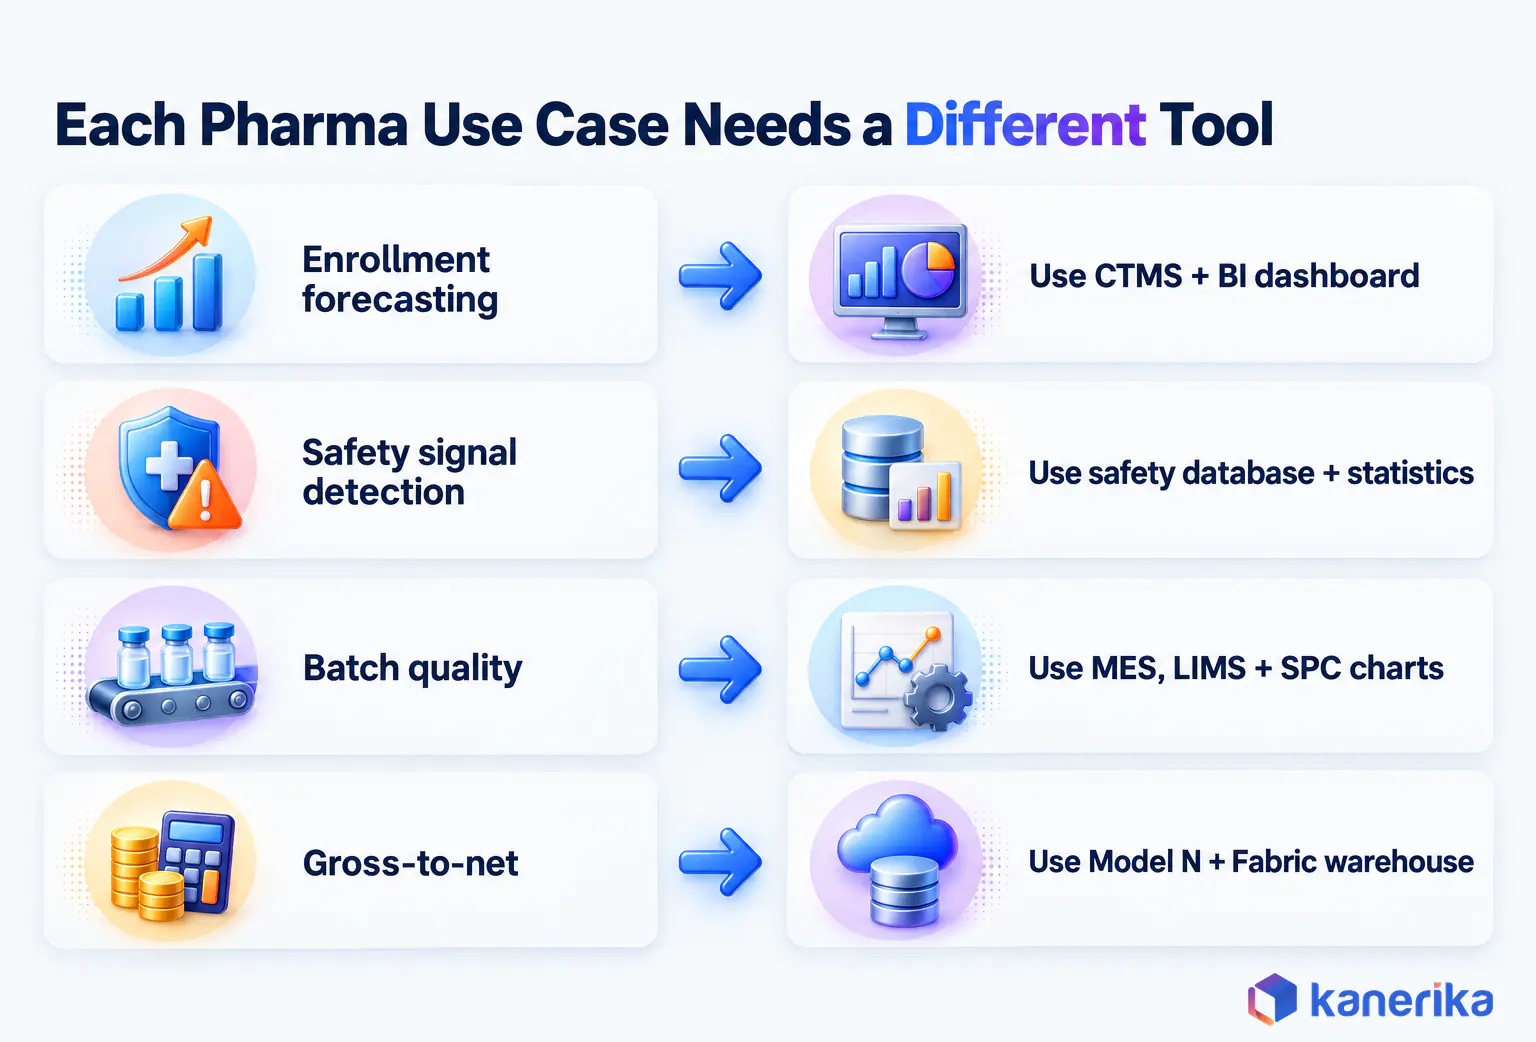
Pharma analytics tools fall into five categories, and most companies need one from each rather than one product that claims to do everything. For a cross-industry shortlist, see our roundup of general-purpose data analytics tools.
The easiest way to see how they fit is to follow one number through the stack. Take the enrollment count from the opening, for example, which the EDC and CTMS capture as source data. An enterprise data platform such as Microsoft Fabric, Databricks or Snowflake then joins those two sources for analysis and AI.
From there, a BI tool such as Power BI, Tableau or Qlik Sense puts the count in front of study teams. When that number feeds an endpoint, statisticians rerun the analysis in SAS, R or Python. Along the way, a governance and catalog tool such as Microsoft Purview records where the number came from and who can change it.
| Category |
What it is for in pharma |
Examples |
What to check |
| Clinical data systems |
Capture and manage trial data |
EDC, CTMS, safety databases |
Part 11 controls, export APIs |
| Enterprise data platforms |
Unify sources for analysis and AI |
Microsoft Fabric, Databricks, Snowflake |
Governance, GxP hosting, cost model |
| Business intelligence |
Dashboards and self-service reporting |
Power BI, Tableau, Qlik Sense |
Row-level security, semantic models |
| Statistical and data science |
Trial analysis and modeling |
SAS, R, Python |
Validated environments, reproducibility |
| Governance and catalog |
Lineage, access and data quality |
Microsoft Purview and peers |
Lineage depth, policy enforcement |
Legacy Names and Further Reading
One older name is missing on purpose. IBM agreed in January 2022 to sell its healthcare data and analytics assets to Francisco Partners (IBM newsroom). Watson Health therefore no longer belongs on a list of pharma analytics platforms.
Platform choice also deserves its own analysis, and our guide on how Microsoft Fabric and Databricks compare covers it. For dashboards on regulated data, see our article on Power BI reporting for pharma teams. If both tools are on your shortlist, our Power BI vs Tableau comparison weighs them side by side.
Many teams still run reports on older tools such as Crystal Reports. Moving those reports to a modern BI layer is often the quickest visible win. Our Crystal Reports to Power BI migration guide explains what to know first. The episode below, for instance, covers that move for pharma teams.
What to Check Before Buying Pharma Analytics Software
A feature list says little about whether a tool will survive an audit. So use these seven checks before you sign, and ask each vendor to show you rather than tell you.
- Validation support. Does the vendor provide validation documents and test scripts for GxP use?
- Audit trails. Are changes logged with user, time and reason, in a form users cannot edit?
- Access control. Can you restrict data by study, site, country and role?
- Lineage. Can you trace a dashboard number back to its source system and every transformation?
- GxP hosting. Does the cloud setup support qualified infrastructure and documented change control?
- Integration. Are there tested connectors for your EDC, CTMS, LIMS and ERP?
- Total cost. Count licenses, compute, validation effort and the people who run the platform.
The access-control and lineage checks (three and four) are easier to pass with dedicated data governance tools for regulated data, which work across platforms rather than inside one. They also make the compliance work in the next section far less manual.
Compliance and Data Integrity: What Makes Pharma Analytics Different
Compliance is the main reason pharma analytics cannot copy what a retailer does. When an analysis supports a regulated decision, such as releasing a batch or reporting a safety finding, the records behind it must meet FDA rules.
The core rule is 21 CFR Part 11, which sets criteria for trustworthy electronic records and signatures. Above all, it requires secure, computer-generated, time-stamped audit trails for records that are created, modified or deleted (eCFR, 21 CFR Part 11). FDA’s final guidance on data integrity and drug CGMP, issued in December 2018, then explains how those records should stay complete and reliable (FDA).
Industry often sums up these expectations with the shorthand ALCOA, meaning attributable, legible, contemporaneous, original and accurate. For an analytics team, this means in practice that every number in a GxP report must trace to who entered it, when, and in which system.
Exploratory vs Validated Analytics
The practical answer, therefore, is to split analytics into two paths. Exploratory analytics, such as a scientist testing a hypothesis in a sandbox, does not drive a GxP decision and can move fast. Validated analytics feeds a regulated decision, so it needs validation, controlled change and full audit trails.
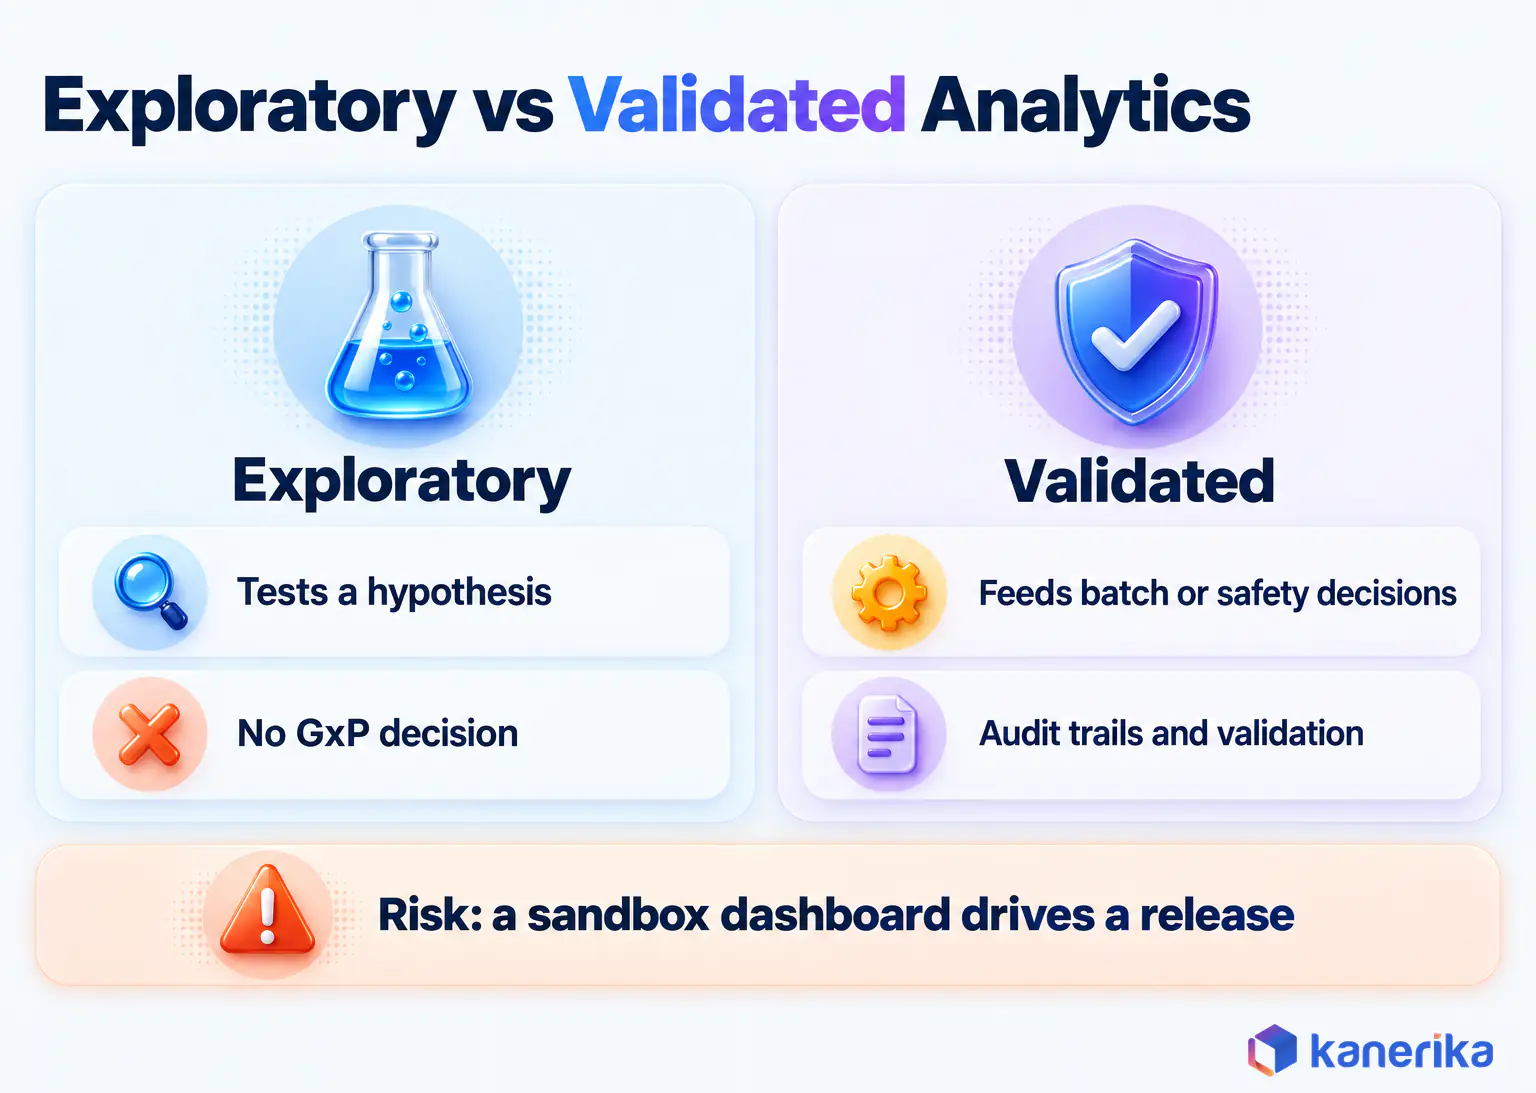
Trouble usually starts when an exploratory dashboard quietly becomes the basis for a batch or safety call. Governance tools help prevent that drift because they record lineage, classify data and enforce who can see or change what. The table below maps each requirement to the control an analytics platform needs.
| Requirement |
What it means for an analytics platform |
Control |
| Audit trails (Part 11) |
Every change to GxP data is logged |
Uneditable logs with time stamps and user IDs |
| Access control |
Only authorized people see or change data |
Role-based and row-level security |
| Electronic signatures |
Approvals link to a named person |
Signature workflow in the source system |
| Data integrity (CGMP) |
Records stay complete and reliable |
Lineage, data quality checks |
| Validation |
The system does what it claims |
Risk-based validation, change control |
Tracing a number to its source is the control most teams lack. Our practical guide to data lineage shows how to add it without slowing analysts down.
How to Build Data Analytics for Pharma Development in Five Steps
A pharma analytics capability works best as a series of small, controlled releases rather than one large program. The five steps below start narrow on purpose, so each release proves value before the next one begins.
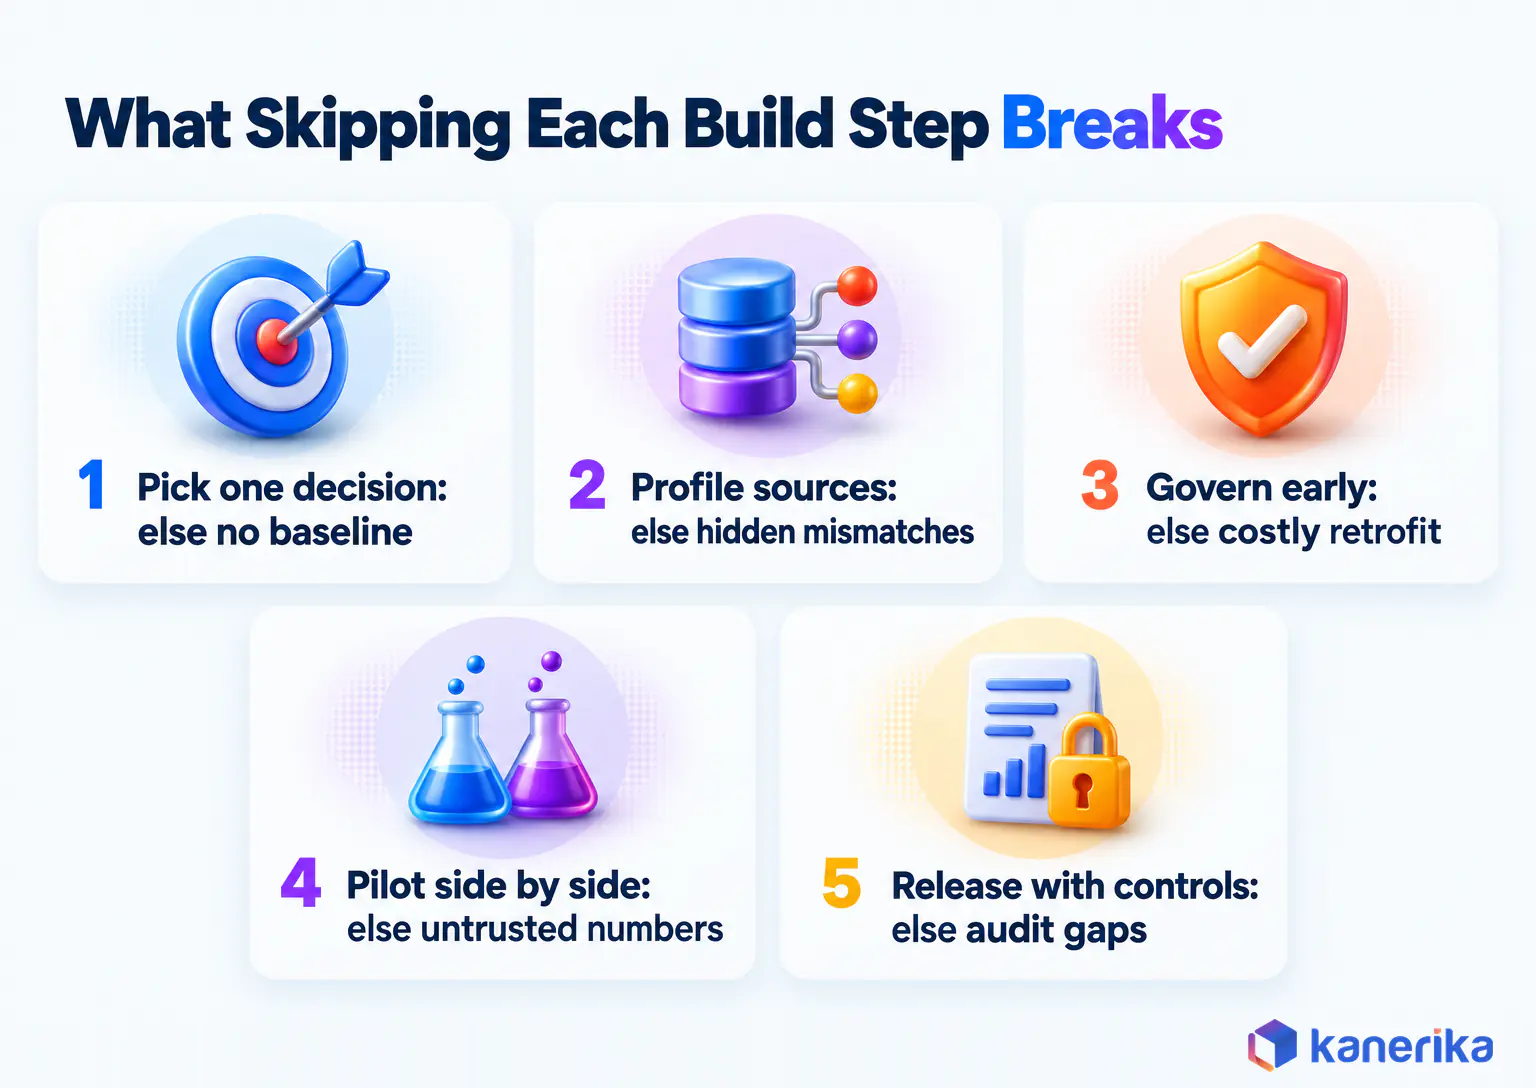
- Start from one decision and its metric. Pick a decision that repeats, name its owner and record today’s value of the metric.
- Connect and profile the source data. Map the systems involved, then measure completeness, duplicates and mismatched definitions before building anything. Once pipelines run, data observability checks keep watching for the same issues.
- Govern early. Set lineage, access rules and the validation scope at the start, because retrofitting them later costs far more.
- Pilot and test. Run the new view alongside the old process, and check its numbers against a known source.
- Release with controls, measure and expand. Move to production under change control, compare the metric with its baseline, then pick the next decision.
The order matters more than the speed. Teams that skip step one cannot prove a return, and teams that skip step three end up rebuilding access and lineage under audit pressure.
Worked Example: The Enrollment Count, Step by Step
Worked example (illustrative). Go back to the enrollment problem from the opening. Step one names the decision, which is the weekly site support call, owned by clinical operations, with forecast accuracy as the metric. Step two then maps the CTMS and EDC and finds that each counts a patient at a different event.
In step three, the team agrees one definition of “randomized” and records it in the data catalog. Next, step four runs the new enrollment report beside the old spreadsheet for a few weeks, until both match. Finally, step five releases it to study teams with access limited by study, and site activation becomes the next decision on the list.
No new AI model was needed, yet the Friday reconciliation problem is gone.
Challenges That Stall Pharma Analytics Programs
Pharma analytics programs stall where data, people and validation rules pull in different directions and nobody owns the gap between them.
The same six problems come up again and again, and each has a practical fix. None of the fixes is expensive on its own, but each needs a named owner.
- Data silos. Each function bought its own system, so nobody sees the whole trial at once. Bring the data onto one governed platform and leave ownership with the function that knows it best.
- Validation burden. Validating everything is the slowest path there is. Validate only what feeds a GxP decision, scaled by risk.
- Data quality. Errors tend to show up in a dashboard, long after they entered the source system. Profile data at the point of entry and publish a quality score for each source. A data quality framework gives that work a repeatable shape.
- Skills gap. People who know both data engineering and GxP are rare, so pair them up. A statistician and a quality lead should sit with the data engineers on every project.
- Change management. Old spreadsheets rarely die on their own. Retire each legacy report as soon as its replacement goes live.
- Vendor lock-in. Insist on open formats and documented exports from day one.
Of the six, silos and validation burden do the most damage, because they slow every later project as well as the first one.
Talk to Kanerika
Scoping Your First Pharma Analytics Use Case?
Book a working session with Kanerika to map one repeated decision, its source systems and the governance it needs, and leave with a scoped first release.
Book a Consultation →
What Pharma Analytics Costs and How to Measure ROI
Cost depends mostly on how many systems you connect and how much of the work must be validated. For example, a single commercial dashboard on two sources is a very different project from a validated platform that spans clinical, quality and safety data.
Return is just as specific to the project. The only reliable way to show it is to baseline the decision metric before the build, then measure it again after release. Express the change in time or money, such as days saved per site activation. Then compare it with the full cost, including validation and the people who run the platform.
The upside at scale can be large, though the best-known estimate is several years old. McKinsey estimated in 2018 that analytics could deliver pharma operating efficiencies as high as 15 to 30 percent of EBITDA over five years. Over a decade, the same estimate accelerates to 45 to 70 percent.
A more recent check is sobering. Deloitte’s 2026 analysis found that AI has not yet cut development time and cost at scale, largely because companies run it as pilots, one function at a time (Deloitte, 2026). So treat the 2018 range as an upper estimate for a mature program, not a target for a first project.
Where the Budget Goes
The table lists the five main cost drivers, why each one matters and how to keep it in check.
| Cost driver |
Why it matters |
How to contain it |
| Integration |
Each source needs connectors and mapping |
Start with the systems one decision needs |
| Validation |
GxP scope adds testing and documents |
Validate only the regulated path, by risk |
| Platform |
Licenses and compute grow with use |
Monitor usage and size capacity to workloads |
| Skills |
People who know data and GxP are scarce |
Pair internal experts with partners and train users |
| Change |
Old reports and habits persist |
Retire legacy reports when the new one goes live |
Validation and integration usually decide the budget, so scope them first and let the platform choice follow.
How Kanerika Helps Pharma Teams Build Trusted Analytics
Kanerika works with pharma and life sciences teams that have plenty of data but cannot join or trust it fast enough. The method follows the five steps above. First, we assess the decisions and sources. Then we unify them on Microsoft Fabric with Power BI, govern access and lineage through our data governance practice. Finally, we scale one use case at a time. Our pharma industry page shows where we work across the lifecycle.
Four Sources, One Fabric Warehouse
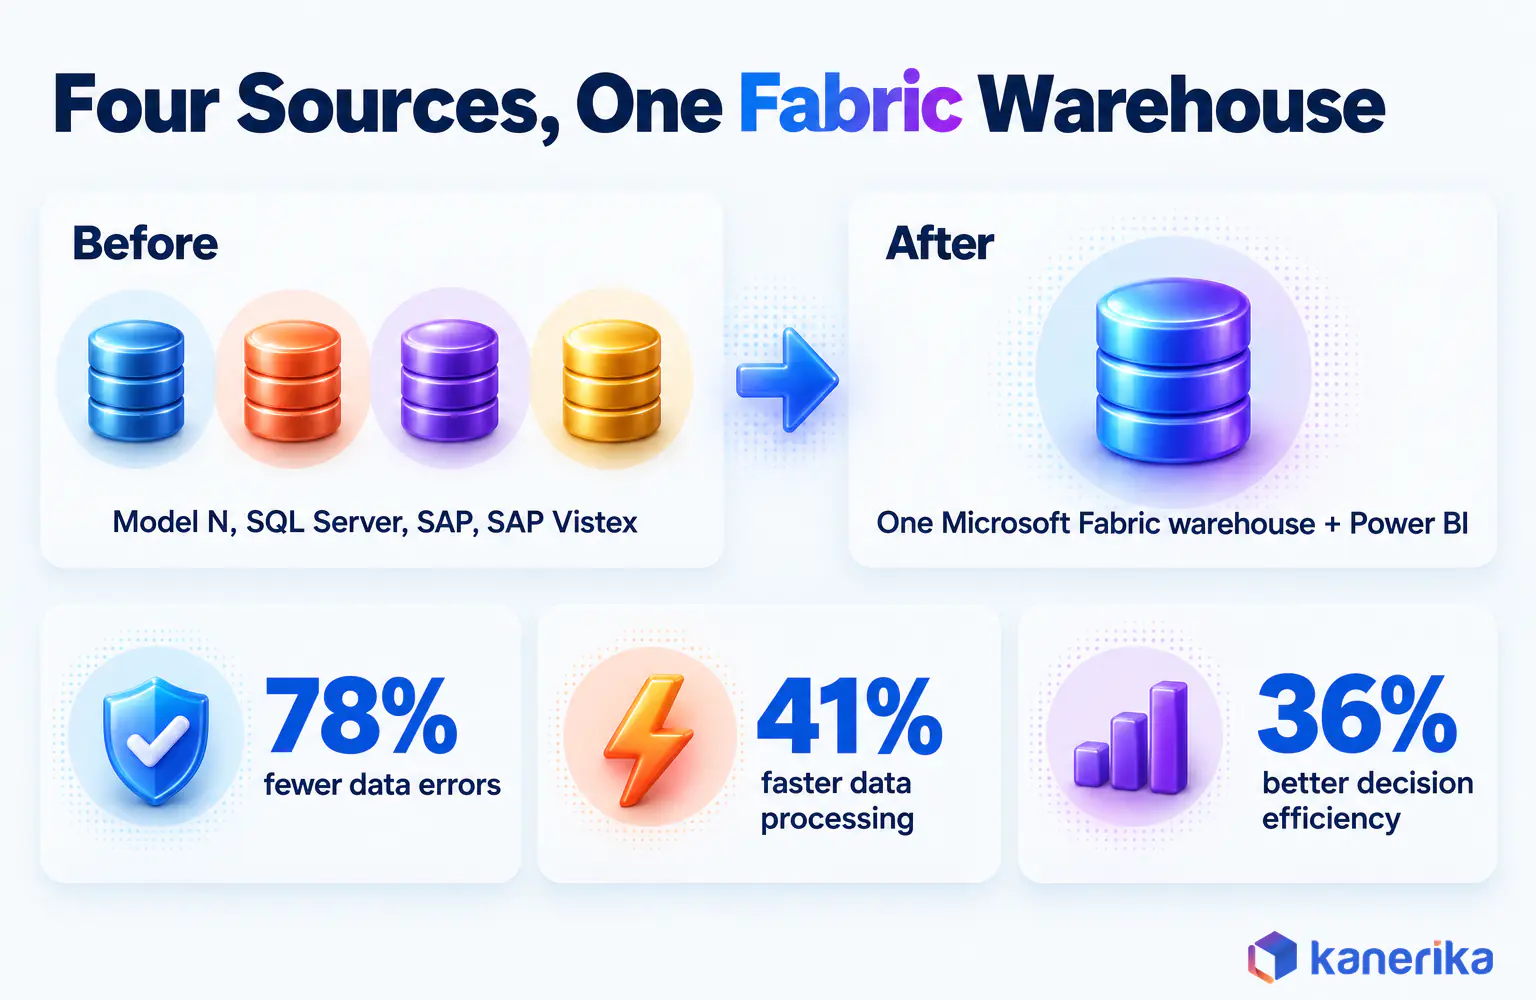
The approach is easiest to see in one engagement. The client is a US pharma company with more than 500 SKUs, over 30 manufacturing plants and operations in more than 55 countries.
Its commercial and finance reporting ran on four disconnected sources, Model N, SQL Server, SAP and SAP Vistex. Teams duplicated effort reconciling them, and decisions waited on the numbers.
The work followed three steps. First, the team centralized data from Model N, SQL Server and SAP into a single Microsoft Fabric lakehouse. Next, it structured and organized that data inside the lakehouse, so access was simpler and data integrity held for analysis. Finally, it built custom Power BI reports on top, so every team worked from one governed set of numbers.
The results were a 78% reduction in data-related errors, a 41% increase in data processing speed and a 36% increase in decision-making efficiency.
Note, however, that the gains came from the commercial and finance data foundation, not from trial timelines or approvals. That is often the right place to start. It proves the platform and governance model on data with clear owners. It also gives finance a number to check every month before clinical or quality data joins. Commercial records also carry less validation overhead than trial or batch records, so early wins arrive sooner.
From there, the same governed platform can take on enrollment reporting, batch analytics or safety dashboards, each with its own validation scope. Every new use case reuses the same lineage, access model and data catalog, so the second release moves faster than the first. Our data analytics services and Microsoft Fabric practice cover that path end to end. The full pharma case study also shows the before and after in detail.
Case Study
78% Fewer Data Errors for Pharma with Microsoft Fabric
A US pharma company unified Model N, SQL Server, SAP and SAP Vistex data in a Microsoft Fabric warehouse with Power BI, cutting data-related errors by 78% and raising decision-making efficiency by 36%.
Read the Case Study →
The Bottom Line
Analytics pays off where a pharma development decision repeats, so start with enrollment forecasting, central monitoring, safety triage, batch review or gross-to-net. Use SAS, R or Python for trial-grade analysis, because that work needs validated, reproducible environments. For cross-functional reporting, use one governed platform such as Microsoft Fabric, Databricks or Snowflake with a BI layer on top. Finally, keep Part 11 controls on the validated path. In the end, the right tool is the one that fits each decision and keeps its data audit-ready.
Frequently Asked Questions
How is data analytics used in pharma development?
Pharma companies use data analytics to improve decisions that repeat across the drug lifecycle. Typical uses include ranking compounds in discovery, picking trial sites, forecasting enrollment, monitoring sites centrally, detecting safety signals, analyzing batch quality and tracking gross-to-net in commercial teams. Each use case links one decision to its source data and a measurable KPI.
What are the four types of data analytics in pharma?
The four types are descriptive, diagnostic, predictive and prescriptive. Descriptive analytics shows what happened, such as enrollment by site. Diagnostic analytics explains why, such as a site screening out too many patients. Predictive analytics estimates what comes next, like dropout risk, and prescriptive analytics recommends an action, like where to send drug supply.
How much does a pharma analytics program cost, and what ROI can be expected?
Cost depends on how many source systems you connect and how much of the work must be validated, plus platform, skills and change effort. ROI should be measured against a baseline of the decision metric taken before the build. McKinsey estimated in 2018 that analytics efficiencies could reach as high as 15 to 30 percent of EBITDA over five years.
How does AI support analytics in pharma development?
AI supports pharma analytics where data is large or unstructured. Machine learning can forecast enrollment, flag batch drift or rank compounds, while generative AI can summarize literature and draft case narratives for human review. FDA’s January 2025 draft guidance asks sponsors to define each model’s context of use, assess its risk and demonstrate its credibility.
What does 21 CFR Part 11 require from analytics systems?
21 CFR Part 11 sets the criteria under which FDA treats electronic records and signatures as trustworthy. For analytics systems that hold or produce GxP records, it means secure, computer-generated, time-stamped audit trails, controlled access, validated software and electronic signatures linked to named people. Exploratory analysis that never feeds a regulated decision usually sits outside this scope.
Which data platforms do pharma companies use for analytics?
Pharma companies typically combine clinical systems such as EDC and CTMS with an enterprise data platform like Microsoft Fabric, Databricks or Snowflake. Power BI, Tableau or Qlik Sense handle dashboards, SAS, R and Python handle statistical work, and governance tools such as Microsoft Purview track lineage and access across all of them.
What are the biggest challenges in pharma data analytics?
The biggest challenges are data silos across functions, the effort of validating GxP systems, poor data quality at the source, a shortage of people who understand both data and regulation, slow change management and vendor lock-in. Most can be solved with named data owners, risk-based validation, profiling at the source and open data formats.
How do you start a pharma analytics program?
Start with one decision that repeats, such as weekly enrollment reviews, and record the current value of its metric. Then connect and profile the source systems, set lineage and access rules early, pilot the new report alongside the old process, and release it under change control. Measure against the baseline before moving on.
What does a pharmaceutical data analyst do?
A pharmaceutical data analyst collects, cleans and analyzes data from clinical, safety, manufacturing or commercial systems, then turns it into reports and insights for decision makers. The work includes building dashboards, checking data quality, supporting statisticians, and documenting methods so that analysis feeding regulated decisions stays traceable, reproducible and ready for an audit.
What skills or training does a pharma analytics role need?
A pharma analytics role needs strong SQL and data modeling skills, working knowledge of statistics, and fluency in tools such as Python, R, SAS or Power BI. Equally important is domain knowledge of clinical trials, GxP rules and data integrity. Courses in clinical data management, biostatistics or regulatory compliance help analysts move into the field.
What is the future of analytics in pharma?
The future of pharma analytics points toward unified data platforms, wider use of real-world evidence, risk-based trial monitoring and carefully governed AI. Regulators are shaping that path, with ICH E6(R3) encouraging risk-proportionate quality and FDA drafting guidance on AI credibility. Companies that govern their data well will adopt these methods faster and with less risk.
How do pharmaceutical companies collect data?
Pharmaceutical companies collect data through many specialized systems. Trial sites enter patient data into EDC systems, operations teams track sites in a CTMS, labs record results in LIMS and notebooks, and safety teams log adverse events in a safety database. Manufacturing, ERP and contracting systems add batch, cost and commercial data, while claims and health records supply real-world data.
What is data integrity in pharma?
Data integrity in pharma means records are complete, consistent and accurate throughout their life. FDA expects it under drug CGMP rules and explained its view in final guidance issued in December 2018. Industry often uses the shorthand ALCOA, meaning attributable, legible, contemporaneous, original and accurate, to describe what trustworthy records look like in practice.
How is pharma analytics different from healthcare analytics?
Pharma analytics focuses on developing, making and selling medicines, so it works with trial, lab, safety, batch and contract data. Healthcare analytics focuses on delivering care, using patient records, claims and hospital operations data. The two meet in real-world evidence, where pharma companies analyze healthcare data to study how their products perform in everyday use.
What is the difference between real-world data and real-world evidence?
Real-world data is health information collected outside clinical trials, such as insurance claims, electronic health records and disease registries. Real-world evidence is the clinical evidence about a product’s use, benefits or risks that comes from analyzing that data. FDA set up its real-world evidence framework in 2018, following the 21st Century Cures Act of 2016.
How does data analytics speed up clinical trials?
Data analytics speeds up clinical trials mainly by improving site selection and enrollment. Feasibility analysis predicts which sites will recruit, and enrollment forecasts show lagging sites weeks earlier than monthly reports. Central monitoring with risk indicators finds data issues without visiting every site, and clean, unified data shortens the time needed to prepare reviews and reports.