Business Intelligence (BI) has become an important tool for organizations striving to thrive in a data-driven world. BI tools and strategies empower businesses to make informed decisions, optimize operations, and gain a competitive edge in their respective industries. Moreover, as BI continues to evolve, recent statistics underscore its growing importance and transformative impact. In this blog, we’ll explore five critical Business Intelligence Statistics, along with key trends shaping the future of business intelligence.
1. Explosive Market Growth
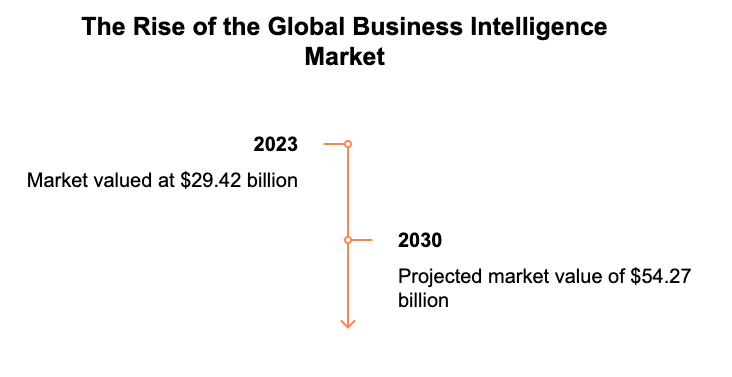
The global business intelligence market is experiencing unprecedented growth. According to recent reports, the market was valued at $29.42 billion in 2023 and is projected to reach $54.27 billion by 2030, growing at a compound annual growth rate (CAGR) of 9.1%. This rapid expansion reflects the increasing demand for BI solutions across industries as businesses prioritize data-driven decision-making.
Additionally, the mobile business intelligence market is set to grow at an even faster pace, with a CAGR of 15.3% between 2024 and 2032, reaching a valuation of $51.5 billion by 2032. This trend highlights the shift toward mobility and real-time analytics as organizations adapt to decentralized work environments and remote operations.
The growth of BI is fueled by several factors:
- The rise of big data analytics.
- Increased adoption of cloud-based solutions.
- The need for actionable insights in competitive markets.
Additionally, companies that fail to invest in BI risk falling behind their competitors as data becomes the driving force behind innovation and efficiency.

2. Adoption Rates and ROI
Business intelligence statistics are climbing steadily across organizations of all sizes. By late 2024, approximately 75% of businesses will rely on cloud-based BI solutions, up from just 45% in 2021. Cloud-based platforms offer scalability, accessibility, and cost-efficiency, making them ideal for businesses seeking flexibility in their analytics strategies.
The ROI of implementing BI tools is undeniable:
- Data-driven organizations are 23 times more likely to acquire customers.
- They are 6 times more likely to retain customers.
- They are 19 times more likely to achieve profitability.
These statistics underscore how leveraging BI tools can transform businesses by improving customer acquisition and retention while boosting overall financial performance.
Furthermore, companies that embrace advanced analytics report faster decision-making processes. A study conducted in August 2024 revealed that organizations using real-time data analytics reduced decision-making time by an average of 30%, enabling them to respond more quickly to market changes and customer needs.

3. AI and Machine Learning Integration
Artificial intelligence (AI) and machine learning (ML) are reshaping business intelligence by automating complex processes and uncovering deeper insights from data. AI-powered predictive analytics enables businesses to forecast trends, customer behavior, and market dynamics based on historical data. Prescriptive analytics goes even further by offering actionable recommendations tailored to optimize outcomes.
Recent statistics highlight the growing reliance on AI within BI:
- By 2025, over 70% of organizations will leverage real-time analytics powered by AI for decision-making, up from just 40% in 2020.
- Companies using AI-driven BI tools report a 25% increase in operational efficiency compared to those relying on traditional methods.
AI integration also enhances personalization efforts. For example, e-commerce platforms use AI-powered BI tools to analyze customer preferences and deliver tailored product recommendations, boosting sales conversions significantly.
As AI becomes more accessible, even small businesses are beginning to adopt these technologies to stay competitive. The democratization of AI within BI ensures that companies across industries can benefit from advanced analytics capabilities without requiring extensive technical expertise.
Transform Your Business with AI-Powered Solutions!
Partner with Kanerika for Expert AI implementation Services
4. Importance of Data Governance
Data governance has emerged as a top priority for organizations utilizing business intelligence tools. In a survey conducted in late 2024, practitioners ranked data security/privacy, data quality management, and governance as the most critical trends in BI implementation.
Why does data governance matter? It ensures that businesses can trust their data while complying with regulatory requirements such as GDPR or CCPA. Companies that fully invest in robust governance frameworks outperform their peers financially by an average of 20%, according to recent studies.
Key components of effective data governance include:
- Ensuring data accuracy and consistency across all systems.
- Implementing strict access controls to protect sensitive information.
- Establishing clear policies for data usage within the organization.
Enhanced governance also fosters a culture of collaboration within companies by breaking down silos between departments. When employees trust their data sources, they can work together more effectively to drive innovation and achieve organizational goals.

5. Self-Service BI Tools
The rise of self-service BI tools is democratizing access to analytics within organizations. These tools empower non-technical users—such as marketing teams or HR departments—to analyze data independently without relying on IT teams or specialized analysts.
By late 2025:
- Companies offering self-service analytics will generate more than twice the business value from their investments compared to those that do not.
- Approximately 60% of employees will regularly use self-service BI tools as part of their daily workflows.
Self-service BI solutions also cater to remote teams by fostering seamless collaboration through cloud-based platforms. This trend aligns with the increasing demand for flexible analytics capabilities in hybrid work environments.
For example:
- A marketing manager can use self-service BI tools to track campaign performance metrics without waiting for IT-generated reports.
- HR teams can analyze employee engagement survey results independently, enabling faster responses to workforce challenges.
The adoption of self-service tools enhances productivity across departments while reducing bottlenecks caused by centralized reporting processes.

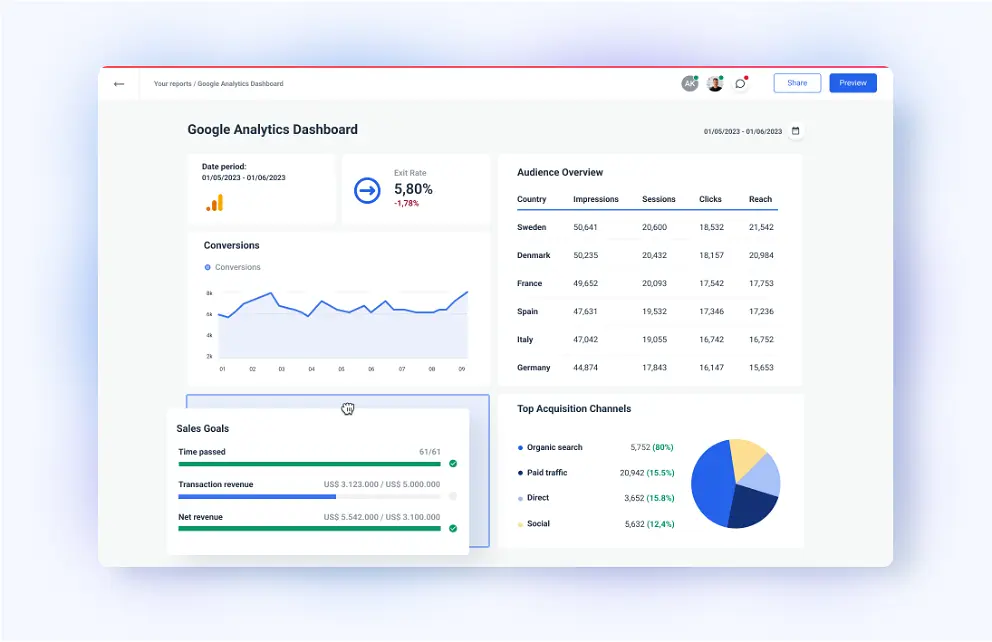
Example of Internal Custom Dashboard Used by Kanerika Marketing Team
Key Trends Shaping Business Intelligence
In addition to these business intelligence statistics, several trends are shaping the future of business intelligence:
Natural Language Processing (NLP)
NLP integration is making BI tools more user-friendly by allowing users to query data using conversational language instead of complex SQL queries or coding skills. This innovation is particularly beneficial for non-technical users who want quick access to insights without requiring extensive training.
Enhanced Data Privacy
As cyber threats become more sophisticated, businesses are prioritizing robust security measures within their BI frameworks. Encryption technologies and multi-factor authentication protocols are being integrated into modern BI platforms to safeguard sensitive information from breaches.
Collaborative Analytics
Remote teams benefit from collaborative BI tools that enable real-time sharing of insights across geographies. Features such as shared dashboards and live commenting ensure that employees can work together seamlessly regardless of location.
Cloud Computing
The adoption of cloud-based solutions continues to accelerate due to their scalability and cost-effectiveness. Cloud computing allows organizations to store vast amounts of data securely while providing easy access for authorized users worldwide.

Conclusion
Business Intelligence is no longer optional—it’s essential for companies aiming to stay competitive in today’s fast-paced markets. The statistics highlighted above demonstrate how BI tools are driving growth, improving ROI, enhancing decision-making through AI integration, ensuring data security via governance frameworks, and empowering employees with self-service capabilities.
Organizations that embrace these trends will be better positioned to harness the full potential of their data while gaining a significant edge over competitors. As we move further into 2025 and beyond, staying updated on emerging BI developments will be crucial for businesses aiming to thrive in an increasingly data-driven world.
By leveraging advanced technologies like AI-powered predictive analytics or adopting self-service platforms tailored for remote teams, companies can unlock new opportunities for growth while fostering innovation across departments. The future belongs to those who embrace change—and Business Intelligence is leading that charge.
A Complete Guide to Business Intelligence Architecture
Business Intelligence Architecture is increasingly seen as a business-critical function, but most organizations still struggle to make it effective.
Choosing Kanerika as Your Business Intelligence Partner
In the rapidly growing field of Business Intelligence (BI), selecting the right partner can significantly impact your organization’s ability to harness data effectively and drive strategic growth. Kanerika Inc stands out as an exceptional choice for businesses seeking cutting-edge BI solutions, thanks to its expertise, innovative technologies, and client-centric approach. Here’s why Kanerika should be your go-to partner for BI and analytics.
Unmatched Expertise in Business Intelligence
Kanerika Inc has established itself as a leader in BI by offering comprehensive solutions that span Artificial Intelligence (AI), Machine Learning (ML), Data Analytics, Data Integration, and Robotic Process Automation (RPA). Moreover, with over 9 years of experience and a team of 300+ consultants worldwide, Kanerika brings unparalleled expertise to the table.
Our specialization includes:
- Data Analytics: Providing actionable insights to empower informed decision-making.
- Data Integration: Seamlessly merging diverse data sources to create cohesive datasets.
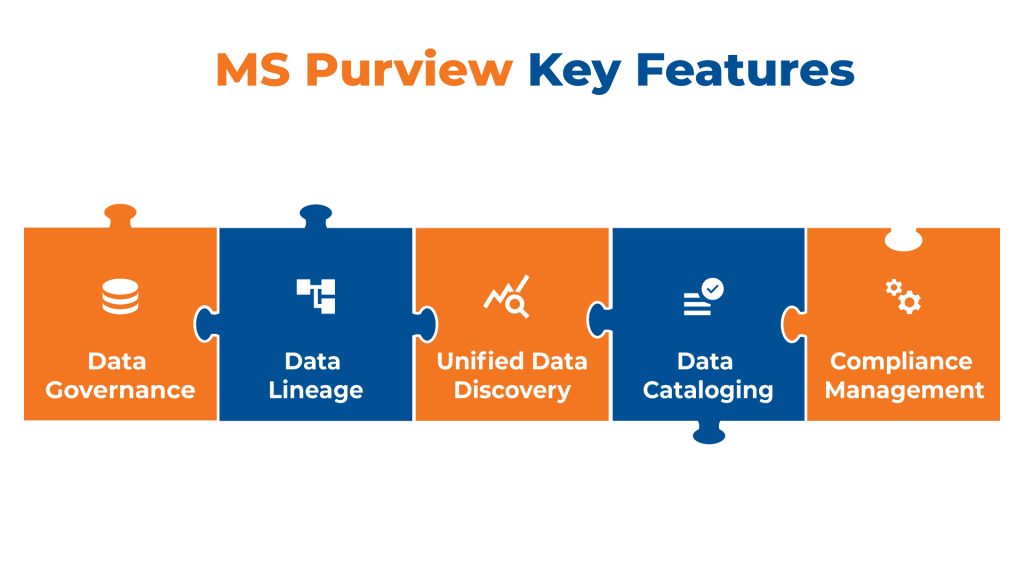
- Data Governance: Ensuring data security, compliance, and strategic utilization.
- Generative AI: Leveraging AI-powered algorithms for advanced analytics and automation.
Kanerika’s SOC II compliance and ISO certifications further demonstrate our commitment to maintaining the highest standards of data security and operational excellence.
Innovative Solutions Tailored for Your Industry
Kanerika delivers industry-specific BI solutions that cater to diverse sectors such as logistics, BFSI (Banking, Financial Services, and Insurance), manufacturing, retail, healthcare, and telecommunications. Their targeted approach ensures that businesses receive customized solutions designed to address their unique challenges.
For example:
- In logistics, Kanerika helps businesses predict demand, optimize inventory management, and enhance customer experiences through personalized solutions
- Additionally, in the financial sector, we drive efficiency with AI-powered analytics and automation. Moreover, for manufacturing, Kanerika focuses on process improvement, predictive maintenance, and innovative product development.
- These specialized solutions ensure that businesses across industries can leverage BI tools effectively to achieve operational efficiency and strategic growth.
FAQs
What is the statistic for business intelligence?
Business intelligence (BI) statistics are the numerical summaries and insights derived from data analysis. They reveal trends, patterns, and anomalies crucial for strategic decision-making. Essentially, they translate raw data into actionable knowledge about your customers, market, and operations. These statistics are the foundation of effective BI, powering everything from sales forecasts to risk assessments.
What is statistical analysis in business intelligence?
In business intelligence, statistical analysis is like a detective using data to solve business mysteries. It digs into numbers to uncover hidden patterns, trends, and relationships that drive decisions. This helps businesses understand customer behavior, predict future outcomes, and optimize operations for better results. Essentially, it transforms raw data into actionable insights.
Is business intelligence in high demand?
Yes, business intelligence (BI) skills are extremely sought-after. Companies rely heavily on data-driven decisions, creating a huge need for professionals who can analyze information and translate it into actionable strategies. This demand spans various industries, from tech to finance, and shows no sign of slowing down. Essentially, anyone who can make sense of data and guide business choices is highly valuable.
What is the growth rate of business intelligence?
Business intelligence (BI) growth is booming, driven by the explosion of data and the need for actionable insights. We’re seeing rapid adoption across all sectors, fueled by advancements in cloud computing and AI. This translates to consistently high market expansion, with projections showing continued strong growth for years to come. Essentially, BI is no longer a luxury; it’s a necessity for competitive survival.
What is business statistics?
Business statistics is the science of using data to make smarter business decisions. It involves collecting, analyzing, and interpreting numerical information to understand trends, predict outcomes, and improve processes. Essentially, it bridges the gap between raw data and actionable insights for profit and growth. It helps businesses navigate uncertainty and make data-driven choices rather than gut feelings.
What is the statistic of intelligence?
There’s no single statistic perfectly capturing intelligence. IQ scores are the most common, but they measure only certain cognitive abilities and don’t encompass the full breadth of human intellect. Other measures exist, focusing on specific skills or broader conceptual understanding, highlighting the multifaceted nature of intelligence. Ultimately, intelligence is too complex for a single numerical representation.
What statistics is used in AI?
AI relies on a diverse toolbox of statistics, not just one. Crucially, probability and distributions are fundamental for tasks like prediction and uncertainty modeling. Regression and classification algorithms heavily use statistical methods to find patterns in data. Essentially, AI leverages statistics to make sense of and draw inferences from complex datasets.
What is business analytics in statistics?
Business analytics uses statistical methods to uncover hidden patterns and insights within business data. It’s essentially using numbers to tell a story about your company’s performance, customer behavior, and market trends. This allows for better decision-making, improved efficiency, and ultimately, a stronger bottom line. Think of it as translating raw data into actionable intelligence.
What is statistical intelligence?
Statistical intelligence isn’t just about crunching numbers; it’s the ability to think critically about data. It means understanding how data is collected, interpreted, and potentially misused, allowing you to discern meaningful patterns from noise. Essentially, it’s the skill of using statistics to make informed decisions and solve real-world problems effectively. It’s about seeing the story within the data.
How many companies use AI statistics?
Precise numbers on AI adoption are hard to pin down because many companies don’t publicly share this data. Available statistics often represent a snapshot and lack depth on implementation levels. Therefore, it’s more accurate to say that AI usage is widespread and rapidly growing across diverse industries, rather than quoting a specific number of companies.
What are the statistics on business success?
Defining “success” is key—profitability? longevity? market share? Statistics vary wildly depending on the metrics used and the industry. Generally, a significant portion of businesses fail within the first few years, while a smaller percentage achieve long-term, substantial growth. Ultimately, success rates are less predictable than often portrayed and heavily influenced by countless factors.
What is business intelligence in analytics?
Business intelligence (BI) in analytics uses data to give businesses a clearer picture of their performance and the market. It transforms raw data into actionable insights, revealing trends, patterns, and potential problems. Essentially, BI helps companies make smarter, data-driven decisions to improve profitability and efficiency. It’s about using past and present data to shape the future.
Who uses business intelligence?
Essentially, anyone who needs to make better decisions based on data uses business intelligence. This includes everyone from C-suite executives strategizing long-term growth to frontline managers optimizing daily operations. BI tools empower informed choices across all levels of an organization, from marketing and sales to finance and operations. It’s about turning data into actionable insights for improved performance.
What is statistical average in business statistics?
In business, the statistical average (or mean) is a single number summarizing a dataset’s typical value. It’s calculated by adding all data points and dividing by the count, offering a quick overview of central tendency. However, it can be skewed by outliers, so it’s crucial to consider other measures like median and mode for a complete picture. Essentially, it’s a useful, but not always perfect, representation of the “middle ground.”
What is the statistical average for an intelligence test?
The average score on most intelligence tests is designed to be 100. This is a statistically constructed mean, not an absolute measure of intelligence. Scores are normalized around this average, with deviations indicating relative position within the population. Think of it as a benchmark, not a definitive assessment.


